Alternative Splicing and Protein Diversity: From Molecular Mechanisms to Therapeutic Applications
This article provides a comprehensive overview of the mechanisms by which alternative splicing generates proteomic diversity, a process crucial for normal development and cellular homeostasis.
Alternative Splicing and Protein Diversity: From Molecular Mechanisms to Therapeutic Applications
Abstract
This article provides a comprehensive overview of the mechanisms by which alternative splicing generates proteomic diversity, a process crucial for normal development and cellular homeostasis. We explore the foundational biology of splicing regulation, including the roles of cis-acting elements and trans-acting factors like SR proteins and hnRNPs. The review covers cutting-edge computational and experimental methods for splicing analysis, including the use of AlphaFold2 for predicting structural consequences of splice variants. We address the significant challenge of interpreting splice-disruptive variants in disease and discuss emerging RNA-targeted therapeutic strategies, such as antisense oligonucleotides, that correct aberrant splicing. Finally, we examine evolutionary perspectives on splicing across species and outline future directions for translating splicing research into clinical applications, offering insights highly relevant to researchers and drug development professionals in the biomedical field.
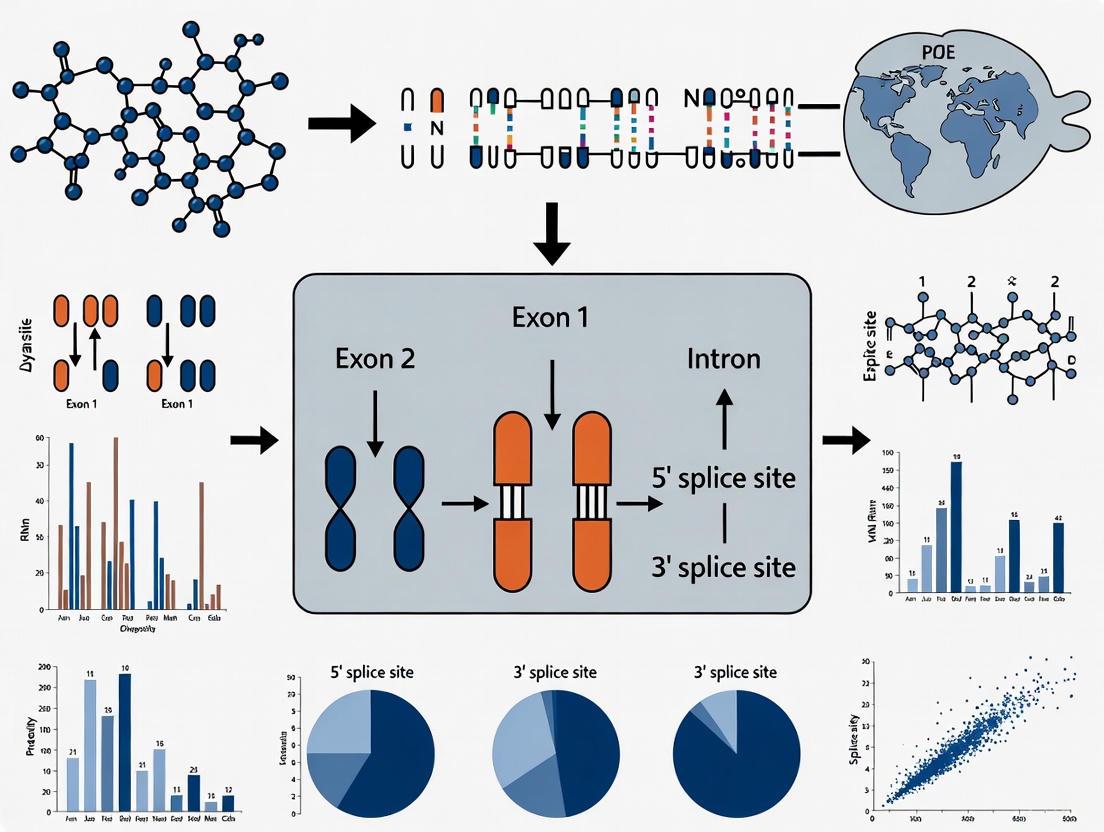
The Fundamental Mechanisms of Alternative Splicing in Proteome Expansion
RNA splicing represents a critical post-transcriptional process in eukaryotic gene expression, enabling a single gene to produce multiple mRNA variants and significantly increasing proteomic diversity. This whitepaper provides a comprehensive technical examination of RNA splicing mechanisms, from fundamental constitutive splicing to the complex regulation of alternative isoforms. We detail the molecular machinery of the spliceosome, the cis-acting elements and trans-acting factors governing splicing regulation, and the experimental methodologies driving discovery in this field. Within the broader context of protein diversity research, we highlight how alternative splicing contributes to tissue-specific functions and disease pathogenesis, particularly in cancer and neurodegenerative disorders. The document further presents quantitative analyses of splicing types, structured methodologies for splicing quantitative trait loci (sQTL) analysis, and visualizations of key pathways, providing researchers and drug development professionals with both foundational knowledge and advanced tools for investigating splicing mechanisms and developing targeted therapeutic interventions.
Alternative splicing of pre-mRNA is an essential mechanism for increasing the complexity of proteins in humans, causing diverse expression of transcriptomes and proteomes in a tissue-specific manner [1]. This process allows a single gene to generate multiple mRNA variants through different combinations of exons, following the removal of introns [2]. Current data indicate that each transcript of protein-coding genes contains approximately 11 exons and produces 5.4 mRNAs on average [1]. The significance of alternative splicing is underscored by its prevalence—more than 95% of human genes undergo splicing in a developmental, tissue-specific, or signal transduction-dependent manner [3]. This process represents a central element in gene expression that influences nearly every aspect of protein function, including interactions between proteins and ligands, nucleic acids or membranes, protein localization, and enzymatic properties [3].
The functional implications of alternative splicing extend across biological systems, with higher eukaryotes exhibiting a higher proportion of alternatively spliced genes, indicating its prominent role in evolution [3]. Alternative splicing mediates diverse biological processes throughout an organism's lifespan and plays significant functional roles in species differentiation, genome evolution, and the development of functionally complex tissues with diverse cell types [3]. The precision and diversity of alternative splicing events are governed by multiple factors, including the strength of splice sites, the concentration and combination of enhancing and silencing splicing factors, chromatin modifications, and RNA secondary structures [1].
Molecular Mechanisms of Splicing
Spliceosome Assembly and Function
The spliceosome, a dynamic and massive macromolecular complex, executes the precise mechanism of RNA splicing. This complex comprises five small nuclear RNAs (U1, U2, U4, U5, and U6) and hundreds of associated proteins known as small nuclear ribonucleoproteins (snRNPs) [1] [2]. The spliceosome undergoes stepwise assembly through a series of complexes (E, A, B, and C) in a highly regulated process [1]:
- Complex E: U1 snRNP binds to the 5'-splice site (SS) GU dinucleotide, while splicing factor 1 (SF1) and U2AF65 bind to the branch point site (BPS) and polypyrimidine tract (PPT), respectively.
- Complex A: U2 snRNP base-pairing interacts with the BPS, displacing SF1.
- Complex B: The complex recruits U4/U6/U5 tri-snRNP, with U5 snRNP binding to 3'-SS and U6 snRNP binding to U2 snRNP. U1 and U4 snRNPs are released during this step.
- Complex C: Formation of this complex leads to two transesterification steps where the intron is folded into a lariat and the 5'-SS is cleaved. The two exons are subsequently joined, and the lariat is released with snRNPs recycled for further splicing cycles [1].
This assembly process facilitates the two transesterification reactions that define splicing chemistry. The first reaction involves the 2'-OH of the branch point adenosine attacking the 5'-splice site to create a lariat and free the 5'-exon. In the second reaction, the 3'-OH of the 5'-exon attacks the 3'-splice site to join the exons and release the intron lariat [4]. While the overall reaction is isoenergetic and requires no phosphoryl transfer to the pre-mRNA, the spliceosome consumes both ATP and GTP to power essential conformational rearrangements during assembly, catalysis, and disassembly [4].
cis-Acting Regulatory Elements
The boundaries between exons and introns are defined by specific consensus sequences that guide spliceosome recognition and catalysis [1] [3]:
- 5'-splice site (5'-SS): Highly conserved GU dinucleotide sequence at the intron/exon boundary
- 3'-splice site (3'-SS): Highly conserved AG nucleotide sequence at the exon/intron boundary
- Branch point sequence (BPS): Located 18-40 nucleotides upstream of the 3'-SS, containing the adenosine residue that forms the lariat structure
- Polypyrimidine tract (PPT): A pyrimidine-rich region critical in recognizing the 3'-SS
The decision to remove or retain specific exons depends on short nucleotide sequences called cis-acting elements, which function as binding sites for regulatory proteins [1]. These elements are categorized based on their location and function:
- Exonic splicing enhancers (ESEs): Bind positive regulatory factors to promote exon inclusion
- Exonic splicing silencers (ESSs): Bind negative regulatory factors to promote exon skipping
- Intronic splicing enhancers (ISEs): Enhance splicing from intronic positions
- Intronic splicing silencers (ISSs): Suppress splicing from intronic positions [1] [3]
These cis-acting elements function additively, with enhancing elements playing dominant roles in constitutive splicing and silencers being relatively more important in controlling alternative splicing [3].
trans-Acting Splicing Factors
The regulation of alternative splicing is mediated by RNA-binding proteins (RBPs) known as trans-acting factors or splicing factors. The two major families of cellular RNA-binding proteins participating in splicing regulation are serine/arginine-rich (SR) proteins and heterogeneous nuclear ribonucleoproteins (hnRNPs) [1] [2].
SR Proteins typically contain RNA recognition motifs (RRMs) and serine/arginine-rich domains (RS domains) that facilitate their function in splicing regulation [1]. SR proteins mediate the interaction between U1 snRNP and the 5'-splice site and recruit U2 snRNP to the 3'-splice site [1]. They often cooperate with other positive splicing factors to form enhancing complexes, such as TRA2, SRRM1, and SRRM2 [1]. The function of SR protein family members depends on phosphorylation regulation by Cdc2-like kinases (CLKs) and SR-specific protein kinases (SRPKs) [2]. SR proteins also participate in post-splicing activities, including mRNA nuclear export, nonsense-mediated decay (NMD), and mRNA translation [3].
hnRNPs generally function as splicing repressors that bind to ESSs and ISSs to inhibit spliceosome assembly [1] [2]. hnRNPs are highly conserved from nematodes to mammals and have several critical roles in pre-mRNA maturation [3]. Their function often involves binding to ESSs to the exclusion of SR proteins or looping out pre-mRNA to sequester exons from the rest of the transcript [3].
SR proteins and hnRNP families generally have opposing effects during the selection of alternative splice sites and exons, often acting in a competitive manner [1]. For example, in the β-tropomyosin gene, splicing of exon 6B depends on a G-rich intronic sequence that can act as either an enhancer or silencer. ASF/SF2 and SC35 (SR proteins) bind to this sequence and stimulate splicing of exon 6B, whereas hnRNP A1 competitively disrupts their interaction [1].
Table 1: Major Splicing Factor Families and Their Functions
| Protein Family | Representative Members | Primary Function | Mechanism of Action |
|---|---|---|---|
| SR Proteins | SRSF1, SRSF2, SC35, ASF/SF2 | Splicing activation | Bind ESEs/ISEs; recruit spliceosomal components via RS domains; facilitate exon definition |
| hnRNPs | hnRNP A1/A2, hnRNP H, hnRNP F, hnRNP M | Splicing repression | Bind ESSs/ISSs; compete with SR proteins; sterically block splice site recognition |
| Tissue-Specific Regulators | nPTB, NOVA1/2, CELF1-6, RBM35a/b | Context-dependent regulation | Modulate splicing in tissue-specific manner; respond to developmental cues |
Types and Patterns of Alternative Splicing
Systematic analyses of ESTs and microarray data have identified seven main types of alternative splicing, each with distinct characteristics and prevalence across species [3]. The most common patterns include:
- Cassette exon (Exon skipping): The most prevalent pattern (~30%) in vertebrates and invertebrates, where an exon is either included or skipped in the mature mRNA [3]
- Alternative 5' splice site: Selection of different 5' splice sites within an exon, accounting for approximately 25% of alternative splicing events [1] [3]
- Alternative 3' splice site: Selection of different 3' splice sites within an exon, representing approximately 25% of events [1] [3]
- Mutually exclusive exons: Selection of one exon from a pair or set of possible exons [1]
- Intron retention: The most common pattern in lower metazoans, where an intron is retained in the mature transcript. In human transcripts, intron retention is positioned primarily in untranslated regions (UTRs) and has been associated with weaker splice sites, short intron length, and regulation of cis-regulatory elements [3]
- Alternative promoter: Utilization of different transcription start sites [1]
- Alternative polyadenylation: Selection of different polyadenylation sites, which influences coding potential or 3'UTR length by modifying microRNA or protein binding availability [1] [3]
Table 2: Types of Alternative Splicing and Their Characteristics
| Splicing Type | Description | Prevalence in Humans | Functional Impact |
|---|---|---|---|
| Exon Skipping (Cassette) | Entire exon is included or skipped | ~30% (Most common) | Can dramatically alter protein structure and function |
| Alternative 5'SS | Different donor splice sites selected | ~25% | Subtle changes at protein N-terminus |
| Alternative 3'SS | Different acceptor splice sites selected | ~25% | Subtle changes at protein C-terminus |
| Mutually Exclusive Exons | One exon selected from a cluster | Variable | Significant domain alterations |
| Intron Retention | Intron remains in mature transcript | ~1-5% (Higher in UTRs) | Can introduce PTCs or alter UTR regulation |
| Alternative Promoters | Different transcription start sites | Not quantified | Affects N-terminal protein sequence |
| Alternative Polyadenylation | Different cleavage/polyA sites | Widespread | Affects 3'UTR length and regulatory elements |
A notable example of alternative splicing complexity is the human gene TTN, which encodes the muscle protein titin and contains 364 coding exons with 4,039 different splicing events identified by RNA-sequencing [1]. Most human genes generate at least two transcript variants, with the alternative spliced mRNAs translated into protein variants that differ in function and structure [1].
Experimental Methods and Analysis
Single-Molecule Splicing Visualization
Advanced methodologies now enable the study of splicing of isolated single pre-mRNA molecules in real time, providing unprecedented resolution of spliceosome dynamics [4]. In this system, a fluorescently tagged pre-mRNA is tethered to a glass surface via its 3'-end. Splicing can be observed in Saccharomyces cerevisiae whole cell extract by monitoring loss of intron-specific fluorescence with a multi-wavelength total internal reflection fluorescence (TIRF) microscope [4].
Key Technical Considerations:
- Fluorophore Selection: Rhodamines, Cy dyes, and Alexa dyes with high quantum yields are necessary due to substantial autofluorescence of cell extracts
- Oxygen Scavenging: Enzymatic systems using protocatechuate dioxygenase (PCD) or galactose oxidase extend fluorophore lifetimes >100-fold without inhibiting splicing, unlike traditional glucose oxidase systems that deplete ATP [4]
- Two-Color Colocalization: Pre-mRNA molecules tagged with fluorescent dyes of different colors in the intron and exon enable detection of splicing as conversion from dual-color to exon-only fluorescence [4]
Experimental Workflow:
- Substrate Preparation: 3'-biotinylated pre-mRNA covalently tagged with Alexa647 in the 3'-exon
- Surface Immobilization: Attachment to PEG-biotin-derivatized glass surface via streptavidin
- Intron Labeling: Hybridization with fluorescent 2'-O-Me/locked nucleic acid (LNA) oligo complementary to intron sequence
- Splicing Reaction: Addition of whole cell extract and splicing components
- Real-Time Imaging: TIRF microscopy to monitor fluorescence changes during splicing
- Data Analysis: Quantification of splicing kinetics through fluorescence signal loss from intron tag [4]
Splicing Quantitative Trait Loci (sQTL) Analysis
sQTL mapping identifies genetic variants that influence splicing patterns, providing functional insights into disease-associated variants from genome-wide association studies (GWAS) [5] [6]. Advanced statistical methods have been developed to analyze sQTLs using RNA-Seq data:
Exon-Inclusion Level Estimation: The proportion of mRNAs originating from the exon-inclusion isoform is estimated using algorithms like PennSeq, which considers all mapped reads in an exon-trio (alternative exon plus flanking constitutive exons) [6]. Unlike methods that only use junction reads, PennSeq utilizes reads aligning to the alternative exon body and flanking constitutive exons, accounting for non-uniform read distribution and paired-end information [6].
Statistical Methods for sQTL Detection:
- Random Effects Meta-Regression: Currently the most reliable and powerful method, accounting for both within-study variation (variance in exon-inclusion level estimation) and between-study variation (variation in exon-inclusion levels across samples) [6]
- Beta Regression: Models exon-inclusion level directly as a beta-distributed variable, producing readily interpretable results without logit transformation [6]
- Generalized Linear Mixed Effects Model (GLiMMPS): An earlier approach that accounts for variation in exon-specific read coverage and overdispersion of read counts but has limitations in handling non-uniform read distribution [6]
The random effects meta-regression approach demonstrates lower false discovery rates and higher power compared to other methods, making it particularly valuable for identifying sQTLs with functional significance in complex diseases [6]. Application of these improved methods has implicated specific variants in neurodegenerative diseases, such as rs528823 in Alzheimer's disease, where antisense oligonucleotides blocking the implicated YBX3 binding site lead to exon skipping in MS4A3 [5].
Research Reagent Solutions
Table 3: Essential Research Reagents for Splicing Studies
| Reagent/Category | Specific Examples | Function/Application | Technical Notes |
|---|---|---|---|
| In Vitro Splicing Systems | HeLa Nuclear Extract, S. cerevisiae Whole Cell Extract | Provide splicing machinery for biochemical assays | Yeast extract allows genetic manipulation; HeLa extract for mammalian contexts |
| Fluorescent Dyes | Alexa488, Alexa555, Alexa647, Cy Dyes | Single-molecule visualization; FRET studies | High quantum yields needed for extract autofluorescence; PCD system extends lifetime |
| Oxygen Scavengers | Protocatechuate Dioxygenase (PCD), Galactose Oxidase | Prolong fluorophore lifetime in single-molecule assays | Preferred over glucose oxidase in yeast extract to prevent ATP depletion |
| Specialized Oligos | 2'-O-Me/LNA Chimeras, Biotinylated RNAs | Detection, immobilization, and manipulation | LNA increases specificity and reduces dissociation rates |
| sQTL Analysis Tools | PennSeq, MAJIQTL, GLiMMPS | Quantify isoform expression; identify genetic regulators | PennSeq accounts for non-uniform read distribution; MAJIQTL improves sGene discovery |
| Splicing Modulators | Small molecule inhibitors, Antisense Oligonucleotides | Mechanistic studies; therapeutic development | Target conserved active site of splicing machines; induce specific exon skipping |
Tissue Specificity and Physiological Regulation
The distribution of alternative splicing factors exhibits remarkable tissue specificity, contributing to cellular differentiation and functional diversity across tissues [1]. More than 50% of genes express different alternative spliced isoforms among tissues, with specialized splicing programs particularly evident in the nervous system, muscle tissues, and epithelial cells [1].
Neural Tissue: The human brain, the most functionally diverse tissue, contains several specific splicing factors including nPTB, NOVA1, and NOVA2 [1]. During neuronal differentiation, the expression of splicing factors shifts from PTB to nPTB, with PTB upregulation responsible for approximately a quarter of nervous system-specific alternative splicing [1]. The CELF family proteins (CELF1, CELF2, CELF5, CELF6) are broadly expressed in the brain, serving as alternative splicing regulators that primarily target gene TNTT2, with CELF2 and CELF5 also distributed in heart and skeletal muscle tissues [1].
Epithelial Tissue: RBM35a and RBM35b function as epithelial cell-specific splicing factors, controlling the expression of epithelial characteristics-related exons [1]. This tissue-specific regulation enables the generation of protein isoforms tailored to the specialized functions of different cell types.
The regulation of alternative splicing extends to coupling with transcription processes, where physical and functional connections between mRNA splicing, RNA polymerase II, and chromatin structure create coordinated regulatory mechanisms [3]. The carboxyl terminal domain (CTD) of the large subunit of RNAPII, consisting of 52 tandem repeats of the heptapeptide YSPTSPS in mammals, serves as a platform to recruit different factors to nascent transcripts via dynamic phosphorylation of serine residues [3]. This coupling mechanism ensures efficient and coordinated gene expression, with splicing factors recruited to transcription sites influencing both splicing outcomes and transcriptional elongation.
Pathological Implications and Therapeutic Targeting
Splicing Dysregulation in Disease
Aberrations in splicing regulation represent a fundamental mechanism in numerous diseases, particularly cancer and neurodegenerative disorders [1] [2]. Mutations in splicing factor genes or dysregulation of their expression can disrupt the network of downstream splicing targets, leading to pathological consequences [1].
Cancer Pathogenesis: Alternative splicing plays a key role in post-transcriptional regulation and controls the formation of spliced variants, with mutations and altered levels of splice factors contributing to tumorigenesis [1]. Abnormal expressions of specific splicing isoforms impact cellular activities central to cancer progression, including sustaining proliferation, preventing cell death, rewiring cell metabolism, promoting angiogenesis, enabling invasion and metastatic dissemination, and conferring drug resistance [1].
Key splicing factors implicated in oncogenesis include:
- SF3B1: Mutations highly associated with chronic lymphocytic leukemia (CLL), cutaneous melanomas, and uveal melanomas. Mutated SF3B1 disturbs interaction with SF3B14a, preventing proper branch point recognition and causing 3'-splice site mis-selection [1]
- SRSF1: Frequently upregulated in breast tumors through binding with MYC, increasing cell proliferation and decreasing apoptosis. SRSF1 overexpression in lung cancer leads to resistance to chemotherapy drugs cisplatin and topotecan [1]
- SRSF2: Mutations associated with myelodysplastic syndromes (MDS), where altered binding specificity induces inclusion of premature termination codons in EZH2, encoding a histone methyltransferase related to MDS pathogenesis [1]
- hnRNP A1/A2: Upregulated in lung cancer and functions as a carcinogenic factor to promote cell proliferation. These proteins also participate in recognizing and protecting telomeric sequences, linking them to cancer regulation [1]
Neurodegenerative Disorders: Splicing abnormalities are increasingly recognized as contributors to neurodegenerative diseases. Advanced sQTL analysis methods have identified specific variants like rs528823 in Alzheimer's disease, affecting splicing regulation through disruption of transcription factor binding sites [5]. Similarly, splicing dysregulation features in Parkinson's disease and other neurological conditions, often through altered expression of neural-specific splicing factors like NOVA and nPTB [1] [5].
Therapeutic Interventions Targeting Splicing
The modulation of RNA splicing by small molecules has emerged as a promising therapeutic strategy for treating pathogenic infections, human genetic diseases, and cancer [7]. Recent structural studies have visualized splicing modulation at near-atomic resolution, enabling structure-based drug design approaches [7].
Small Molecule Modulators: Integrating enzymatic, crystallographic, and simulation studies has demonstrated that self-splicing group II introns recognize small molecules through their conserved active site [7]. These RNA-binding small molecules selectively inhibit splicing steps by adopting distinctive poses at different catalytic stages and preventing crucial active site conformational changes essential for splicing progression [7]. This work provides a solid basis for rational design of splicing modulators targeting not only bacterial and organellar introns but also the human spliceosome, a validated drug target for congenital diseases and cancers [7].
Antisense Oligonucleotides (ASOs): ASOs designed to block specific splicing regulatory elements can redirect splicing outcomes. For example, antisense oligonucleotides targeting the YBX3 binding site affected by Alzheimer's-associated variant rs528823 induce exon skipping in MS4A3, demonstrating the therapeutic potential of splicing modulation [5].
Novel Chemical Compounds: Patent applications have been filed covering novel chemical compounds acting as splicing modulators, with future development aimed at regulating production of specific proteins linked to defective or mutated genes [7]. These advances hold promise for developing new antibacterials and antitumor agents that directly target genetic mutations altering gene expression processes [7].
The comprehensive understanding of RNA splicing mechanisms, from constitutive splicing to alternative isoform generation, provides critical insights into gene regulation and protein diversity. The intricate coordination of spliceosome assembly, cis-regulatory elements, trans-acting factors, and tissue-specific regulators enables precise control of gene expression outcomes. Experimental advances, particularly in single-molecule visualization and sQTL mapping, continue to reveal the complexity of splicing regulation and its functional consequences.
The pathological significance of splicing dysregulation underscores the importance of this process in human health and disease. As structural insights into splicing mechanisms improve and therapeutic targeting strategies advance, the potential for developing novel treatments for cancer, neurodegenerative diseases, and genetic disorders through splicing modulation continues to expand. The integration of biochemical, genetic, computational, and structural approaches will further elucidate the fundamental principles of splicing regulation and its applications in precision medicine.
Alternative splicing (AS) is a fundamental mechanism in eukaryotic gene regulation that enables a single gene to produce multiple mRNA isoforms, thereby vastly expanding proteomic diversity from a finite genome [3]. This process is critical for cellular differentiation, organismal development, and response to environmental stimuli, and its misregulation is implicated in numerous human diseases [3] [8]. While constitutive splicing involves the removal of introns and ligation of exons in a fixed order, alternative splicing creates variation by differentially selecting splice sites. This review focuses on three major types of alternative splicing—exon skipping, intron retention, and alternative splice site selection—framed within the context of their contributions to protein diversity mechanisms. We provide a technical guide for researchers and drug development professionals, complete with quantitative comparisons, experimental methodologies, and visualization of underlying mechanisms.
Classification and Prevalence of Major Alternative Splicing Types
Systematic analyses have revealed several major types of alternative splicing events. The most prevalent pattern in vertebrates and invertebrates is cassette-type alternative exon (exon skipping), accounting for approximately 30% of alternative splicing events in these organisms [3]. In contrast, intron retention is the most frequent alternative splicing event in plants and is also common, though scientifically neglected, in animals [9] [3]. Alternative 5' or 3' splice site selection, which involves subtle changes in exon boundaries, constitutes approximately 25% of alternative splicing events [3]. The prevalence of different splicing types varies significantly across biological kingdoms, with intron retention being particularly prominent in lower metazoans [3].
Table 1: Major Types of Alternative Splicing and Their Characteristics
| Splicing Type | Prevalence in Vertebrates | Key Features | Impact on Coding Sequence |
|---|---|---|---|
| Exon Skipping | ~30% [3] | Complete exclusion of an exon from mature transcript | Can cause large deletions of protein domains |
| Intron Retention | Most common in plants; frequent in animals [9] | Retention of entire intron in mature mRNA | Often introduces PTCs leading to NMD or truncated proteins |
| Alternative 5' Splice Site | ~25% (combined) [3] | Alternative donor site selection within same exon | Subtle changes at protein N-terminus |
| Alternative 3' Splice Site | ~25% (combined) [3] | Alternative acceptor site selection within same exon | Subtle changes at protein C-terminus |
| Mutually Exclusive Exons | Less common | Selection of one exon from a set of possibilities | Domain swapping in resulting protein |
Molecular Mechanisms and Regulatory Principles
Fundamental Splicing Machinery
The splicing process is executed by a massive ribonucleoprotein complex called the spliceosome, which consists of five small nuclear ribonucleoproteins (snRNPs: U1, U2, U4, U5, and U6) and numerous associated protein factors [3]. Splicing requires two consecutive transesterification reactions: first, a nucleophilic attack of the branch point adenosine on the 5' splice site, forming a lariat intermediate; second, the 3' OH of the upstream exon attacks the 3' splice site, resulting in exon ligation and intron release [9]. The spliceosome recognizes core splicing signals: the 5' splice site (5'ss), branch point sequence (BPS), polypyrimidine tract (PPT), and 3' splice site (3'ss) [3] [10].
Diagram 1: Pre-mRNA Splicing Mechanism
cis-Acting Elements and trans-Acting Factors
Alternative splicing decisions are governed by the interplay between cis-regulatory elements and trans-acting factors. Cis-acting elements include exonic splicing enhancers (ESEs), intronic splicing enhancers (ISEs), exonic splicing silencers (ESSs), and intronic splicing silencers (ISSs) [3]. These elements are recognized by trans-acting factors: SR proteins (serine/arginine-rich proteins) typically bind enhancers and promote splicing, while heterogeneous nuclear ribonucleoproteins (hnRNPs) often bind silencers and inhibit splicing [3]. The combinatorial action of these regulatory components determines the splicing outcome, with silencers playing a particularly important role in alternative splicing control [3].
Splice Site Selection Principles
Splice site selection follows specific principles influenced by genomic architecture. The "proximity rule" states that when multiple splice sites compete, the spliceosome preferentially pairs sites that are closest to each other [10]. However, this rule operates differently depending on intron-exon architecture. For short introns (<250 nucleotides), the intron definition mode predominates, favoring pairing of the 5' and 3' splice sites closest across the intron [10]. For exons flanked by long introns (>250 nucleotides), exon definition operates, favoring pairing of the 5' and 3' splice sites closest across the exon [10].
Table 2: Genomic Architecture Influences on Splice Site Selection
| Architectural Context | Definition Mode | Proximity Principle | Prevalence |
|---|---|---|---|
| Short Flanking Introns (<250 nt) | Intron Definition | Splice sites closest across the intron are paired [10] | Common in lower eukaryotes [10] |
| Long Flanking Introns (>250 nt) | Exon Definition | Splice sites closest across the exon are paired [10] | Common in humans (>87% of introns) [10] |
| Hybrid Architecture (one short, one long intron) | Context-Dependent | Intermediate behavior with bias toward intron or exon definition [10] | Less common |
Exon Skipping
Mechanism and Functional Consequences
Exon skipping, also known as cassette exon splicing, involves the complete exclusion of an exon from the mature mRNA transcript [3]. This is the most prevalent alternative splicing type in vertebrates and invertebrates [3]. The mechanism involves the splicing machinery skipping over an exon and joining the upstream and downstream exons directly. This results in an mRNA missing the coding information of the skipped exon, which can lead to deletion of entire protein domains or disruption of the reading frame [11].
From a protein diversity perspective, exon skipping represents a powerful mechanism for generating functionally distinct protein isoforms. When the reading frame is preserved, exon skipping can produce proteins with altered functional properties, including modified binding characteristics, subcellular localization, enzymatic activity, or protein-protein interaction domains [3].
Therapeutic Application: Duchenne Muscular Dystrophy
Exon skipping has been successfully leveraged as a therapeutic strategy for Duchenne muscular dystrophy (DMD), a severe genetic disorder caused by mutations in the dystrophin gene that disrupt the reading frame [11]. The approach uses antisense oligonucleotides (AONs) that bind to specific exons in the pre-mRNA and induce skipping of the mutated exon, thereby restoring the reading frame and converting the lethal DMD phenotype to the milder Becker muscular dystrophy (BMD) phenotype [11].
Diagram 2: Exon Skipping Therapeutic Mechanism for DMD
Several exon-skipping drugs have received FDA approval: eteplirsen (Exondys 51) targets exon 51, golodirsen (Vyondys 53) and viltolarsen (Viltepso) target exon 53, and casimersen targets exon 45 [11]. Since DMD mutations cluster in "hot spot" regions (primarily exons 45-53), skipping these exons could potentially treat up to 50% of DMD patients [11].
Intron Retention
Mechanism and Functional Consequences
Intron retention (IR) occurs when an intron remains in the mature mRNA transcript instead of being spliced out [8]. This was historically considered a splicing error but is now recognized as a functionally important regulatory mechanism [9] [8]. IR is the most prevalent alternative splicing type in plants and is increasingly recognized as significant in mammalian systems [9].
Retained introns often contain premature termination codons (PTCs), making the transcripts targets for nonsense-mediated decay (NMD), thus providing a mechanism for post-transcriptional gene regulation [8]. In some cases, intron-retaining transcripts (IRIs) are detained in the nucleus and can undergo further splicing in response to specific signals or cellular states [9] [8]. Alternatively, IRIs may escape NMD and be translated into protein isoforms that are often truncated and may lack functional domains or, in some cases, contain extra domains encoded by the retained intronic sequence [8].
Biological Functions and Regulatory Roles
Intron retention serves as an important regulatory mechanism in various biological processes. During neuronal differentiation, increased IR contributes to gene expression downregulation by targeting transcripts to NMD [8]. In activated CD4+ T cells, upregulation of most genes is accompanied by significantly decreased IR levels, suggesting a rapid response mechanism to extracellular stimuli [8]. IR also plays roles in erythropoiesis, where dynamic increases in IR occur during late erythroblast differentiation [8].
Recent studies have identified intron retention quantitative trait loci (irQTLs) in human tissues, with 8,624 unique IR events associated with genetic polymorphisms [12]. Notably, 16% of these irQTLs are associated with genome-wide association study (GWAS) traits, highlighting the clinical relevance of IR [12].
Alternative Splice Site Selection
Mechanism and Functional Consequences
Alternative splice site selection involves the use of different 5' or 3' splice sites within the same exon, leading to subtle changes in exon boundaries [3]. This results in extended or shortened exons in the mature mRNA. Alternative 5' splice site selection changes the upstream boundary of an exon, while alternative 3' splice site selection alters the downstream boundary [3].
The functional impact of alternative splice site selection is typically more subtle than exon skipping but can still significantly affect protein function. These changes may alter the coding sequence by adding or removing a small number of amino acids, potentially affecting protein interaction interfaces, catalytic sites, or post-translational modification sites [3]. In some cases, alternative splice site selection can introduce frameshifts with more dramatic consequences.
Determinants of Splice Site Strength
Splice site selection is heavily influenced by splice site strength, which is determined by how well the sequence conforms to consensus motifs and its ability to recruit splicing factors [13] [14]. The 5' splice site consensus in mammals is MAG|GURAGU (where | indicates the exon-intron boundary and M = A/C, R = purine) [14], while the 3' splice site consists of the branch point sequence, polypyrimidine tract, and YAG| (where Y = pyrimidine) [10].
Recent approaches have focused on empirically quantifying splice site usage/strength rather than relying solely on predictive algorithms. The SpliSER (Splice-site Strength Estimate from RNA-seq) tool quantifies empirical usage of individual splice sites from RNA-seq data, providing a direct measurement of splice site strength [13] [14]. This approach has revealed that sequence variation in cis rather than trans is primarily associated with splicing variation among natural accessions of Arabidopsis thaliana [13].
Experimental Methods for Detection and Quantification
Computational Detection Methods
Various computational methods have been developed to detect and quantify alternative splicing events from RNA-seq data:
GESS (graph-based exon-skipping scanner): A de novo method for detecting exon-skipping events from raw RNA-seq reads without prior knowledge of gene annotations [15]. It builds a splice-site-link graph from RNA-seq reads and identifies sub-graphs with patterns corresponding to exon-skipping events.
SpliSER (Splice-site Strength Estimate from RNA-seq): Quantifies empirical usage of individual splice sites, defined as SSE = α / (α + β1 + β2), where α represents reads supporting site usage, and β1 and β2 represent reads indicating non-usage [13].
IRFinder and iREAD: Tools specifically designed for intron retention detection that quantify IR levels by assessing reads aligning to intronic regions compared to exonic regions [8].
MISO (Mixture of Isoforms): A probabilistic framework that quantifies the expression of alternatively spliced isoforms from RNA-seq data [15].
Research Reagent Solutions
Table 3: Essential Research Reagents for Alternative Splicing Studies
| Reagent/Tool | Application | Key Features | References |
|---|---|---|---|
| Antisense Oligonucleotides (AONs) | Therapeutic exon skipping; experimental splicing modulation | Short nucleic acid polymers (typically ≤50 bases) that bind target sequences to modulate splicing | [11] |
| SpliSER | Quantifying empirical splice site usage | Provides Splice-site Strength Estimate (SSE) from RNA-seq data; enables GWAS of splicing variation | [13] [14] |
| GESS | De novo exon-skipping detection | Identifies skipping events without annotation bias; uses splice-site-link graphs | [15] |
| IRFinder | Intron retention quantification | Specifically optimized for IR detection; accounts for mapping biases | [8] |
| MISO | Isoform quantification | Bayesian framework for estimating isoform ratios; incorporates uncertainty | [15] |
The major types of alternative splicing—exon skipping, intron retention, and alternative splice site selection—represent powerful mechanisms for generating proteomic diversity and regulating gene expression. Each mechanism possesses distinct characteristics, prevalence across species, and functional consequences. Exon skipping enables domain-level changes in proteins and has proven clinically actionable for DMD treatment. Intron retention serves as an important regulatory mechanism, particularly in differentiation and stress response. Alternative splice site selection provides fine-scale modulation of protein features. Ongoing technological advances in empirical splice site quantification and detection methods continue to enhance our understanding of the splicing code and its contributions to phenotypic diversity and disease pathogenesis.
Alternative splicing is a fundamental post-transcriptional process that enables a single gene to generate multiple mRNA and protein isoforms, dramatically expanding the functional complexity of the genome and proteome [16] [17]. Over 90% of human multi-exonic genes undergo alternative splicing, producing distinct proteoforms with varied functions, localization, and interaction partners [16] [18]. This process is critically regulated by cis-acting regulatory elements—short, non-coding RNA sequences that serve as binding platforms for trans-acting splicing factors [16] [17]. These elements fine-tune splice site selection and exon inclusion rates, forming a sophisticated "splicing code" that determines transcriptional outcomes [19]. Disruption of this delicate balance can lead to aberrant splicing associated with numerous human diseases, including cancer, neurological disorders, and channelopathies [20] [17]. Understanding the mechanisms and locations of these regulatory elements is therefore essential for both basic research and therapeutic development.
Classification and Mechanisms of cis-Acting Splicing Elements
Cis-acting splicing elements are traditionally classified based on their location and function into four main categories. These elements work combinatorially to define exon boundaries and regulate alternative splicing patterns.
Table 1: Classification of cis-Acting Splicing Regulatory Elements
| Element Type | Location | Function | Key Binding Proteins |
|---|---|---|---|
| Exonic Splicing Enhancer (ESE) | Exon | Promotes exon inclusion | SR proteins (e.g., SRSF1) [17] |
| Exonic Splicing Silencer (ESS) | Exon | Promotes exon skipping | hnRNPs (e.g., hnRNP A1) [17] [19] |
| Intronic Splicing Enhancer (ISE) | Intron | Promotes exon inclusion | SR proteins, other activators [17] |
| Intronic Splicing Silencer (ISS) | Intron | Promotes exon skipping | hnRNPs, other repressors [17] |
The precise spatial organization of these elements creates a regulatory landscape that guides the spliceosome. The core spliceosome machinery, consisting of U1, U2, U4, U5, and U6 snRNPs, recognizes canonical splice sites but requires additional regulation for accurate splicing decisions [16] [17]. Splicing enhancers facilitate exon definition by promoting the recruitment and stability of spliceosomal components, particularly U1 and U2 snRNPs, at flanking splice sites [16]. Silencers, in contrast, act antagonistically by blocking the access of core splicing factors or recruiting inhibitory complexes [17]. The functional outcome for a given exon depends on the dynamic interplay between these antagonistic forces.
Table 2: Characteristics of Core Splicing Motifs and Regulatory Elements
| Feature | Core Splicing Motifs | Splicing Regulatory Elements (ESEs, ESSs, etc.) |
|---|---|---|
| Primary Function | Define exon-intron boundaries (5'SS, 3'SS, BPS, PPT) [21] | Modulate the strength of core motifs and fine-tune exon inclusion [17] |
| Sequence Conservation | Highly conserved GU-AG rule at intron boundaries [16] | Less conserved, degenerate sequences [19] |
| Typical Length | Short, defined motifs (e.g., 5'SS: 9 nt; BPS: 7 nt) [21] | Short, degenerate sequences (6-8 nt) [19] |
| Effect of Mutation | Often complete loss of splicing at the affected site [16] | Subtle to strong modulation of exon inclusion levels [19] |
The following diagram illustrates the spatial relationships and functional impacts of these cis-regulatory elements within a prototypical exon-intron unit:
Diagram 1: Spatial organization and function of cis-acting splicing elements. Enhancers (green) and silencers (red) within exons and introns bind trans-acting factors to either promote or inhibit splice site recognition.
Quantitative Analysis of Splicing Regulatory Landscapes
Large-scale genomic studies have systematically defined the sequence and spacing requirements for effective splicing. Analysis of approximately 202,000 canonical protein-coding exons revealed that 95.9% adhere to defined minimal splicing criteria encompassing specific sequence motifs, strength thresholds, and spatial organization [21]. The branch point sequence (BPS), a critical cis-element, is typically located 18-48 nucleotides upstream of the 3' splice site, with the adenosine branch point itself positioned 21-34 nucleotides from the 3'SS [21].
Table 3: Quantitative Parameters of Core Splicing Motifs from Genome-Wide Analysis
| Splicing Motif | Consensus Sequence | Typical Location | Strength Metric (Range) |
|---|---|---|---|
| 5' Splice Site (5'SS) | AGGTRAGT | Exon-Intron Junction | MaxEntScan Score: 4.0 - 11.9 [21] |
| 3' Splice Site (3'SS) | YAG | Intron-Exon Junction | MaxEntScan Score: 3.5 - 13.2 [21] |
| Branch Point (BP) | YURAY | 18-48 nt upstream of 3'SS [21] | Distance from 3'SS: 21-34 nt (A branch) [21] |
| Polypyrimidine Tract (PPT) | Pyrimidine-rich (C/T) | Between BP and 3'SS | Length: Highly variable |
Not all exons are equally dependent on regulatory elements. The concept of "exon vulnerability" has emerged from studies showing that certain exons, such as ACADM exon 5, are highly sensitive to exonic mutations because they inherently lack strong splicing enhancers or possess potent silencers [19]. These vulnerable exons exist in a precarious balance, where even single nucleotide variations can disrupt the equilibrium between enhancer and silencer elements, leading to aberrant splicing and disease [19]. Computational tools like VulExMap have been developed specifically to identify such constitutive exons that are vulnerable to exonic splice mutations [19].
Experimental Methodologies for Mapping and Validation
Genome-Wide Epigenomic Profiling
Comprehensive identification of regulatory elements in complex genomes requires integrated epigenomic approaches. A multi-assay strategy can map active regulatory regions, including promoters and enhancers that may influence splicing patterns.
- Assay for Transposase-Accessible Chromatin with Sequencing (ATAC-seq): Identifies genomically accessible, open chromatin regions, a key feature of active regulatory elements [22].
- Chromatin Immunoprecipitation followed by Sequencing (ChIP-seq): Maps histone modifications associated with active enhancers (H3K27ac, H3K4me1) and promoters (H3K4me3) [22].
- Whole Genome Bisulfite Sequencing (WGBS): Provides single-nucleotide resolution DNA methylation maps. Active regulatory elements often exhibit hypomethylation, particularly in CG and CHG contexts [22].
- RNA Sequencing (RNA-seq): Measures transcriptome-wide gene expression and alternative splicing patterns, allowing correlation of regulatory element activity with transcriptional outcomes [22].
Integrated analysis of these datasets enables the discrimination of different classes of regulatory elements based on their combinatorial chromatin signatures. Active promoters are typically marked by open chromatin, H3K4me3, and H3K27ac, while enhancers are primarily characterized by open chromatin with variable H3K27ac and H3K4me1 levels [22].
Functional Validation of Splicing Elements
Once candidate regulatory elements are identified, their functional validation is essential. The following workflow outlines a standard pipeline for experimental characterization:
Diagram 2: Experimental workflow for validating cis-acting splicing elements, incorporating computational prediction and database interrogation.
Detailed Experimental Protocol: Minigene Splicing Assay
The minigene assay is a gold-standard method for functionally testing putative splicing regulatory elements without endogenous genomic context confounding effects.
Research Reagent Solutions:
Table 4: Essential Reagents for Splicing Analysis Experiments
| Reagent / Tool | Function / Application | Key Features |
|---|---|---|
| SpliceVec Minigene Vector | Backbone for inserting genomic fragments of interest | Contains multiple cloning sites, constitutive exons, and viral promoter (e.g., CMV) [21] |
| Site-Directed Mutagenesis Kit | Introduction of specific variants into minigene constructs | Enables testing of wild-type vs. mutant regulatory elements [21] |
| Cell Line (HEK293T, HeLa) | Heterologous system for splicing analysis | High transfection efficiency, well-characterized splicing patterns [21] |
| RT-PCR Kit | Analysis of splicing patterns from expressed minigenes | Detects alternative isoforms; use of fluorescent primers enables quantitative analysis [21] |
| Capillary Electrophoresis System | High-resolution separation of splicing isoforms | Provides quantitative data on exon inclusion/skipping ratios [21] |
Step-by-Step Methodology:
Minigene Construct Design: Clone the genomic region of interest (typically containing an exon with flanking intronic sequences) into a splicing reporter vector between two constitutive exons. The insert size is generally 500-1500 bp [21].
Variant Introduction: Use site-directed mutagenesis to introduce specific mutations into candidate regulatory elements (ESEs, ESSs, etc.) within the cloned fragment. Include positive and negative control constructs.
Cell Transfection: Transfect the minigene constructs into mammalian cells using a standardized method (e.g., lipofection). Perform triplicate transfections and include an empty vector control.
RNA Isolation and cDNA Synthesis: Harvest cells 24-48 hours post-transfection. Isolate total RNA using a column-based method, treating with DNase I to remove genomic DNA contamination. Synthesize cDNA using reverse transcriptase with oligo(dT) or random hexamer primers.
PCR Amplification: Amplify the minigene transcript using PCR with primers binding to the vector's constitutive exons. Use a fluorescently labeled primer for quantitative analysis. Limit PCR cycles to remain in the exponential amplification phase (typically 25-30 cycles).
Splicing Product Analysis: Separate and quantify PCR products by capillary electrophoresis. Calculate the Percent Spliced In (PSI or Ψ) for the exon of interest using the formula: Ψ = (Inclusion peak height / (Inclusion peak height + Skipping peak height)) × 100. Compare Ψ values between wild-type and mutant constructs to determine the functional impact of the mutated regulatory element.
Sequence Verification: Sanger sequence the PCR products to confirm the identity of each splicing isoform.
Computational Tools and Databases for Splicing Element Analysis
Advancements in computational biology have produced sophisticated tools for predicting the impact of sequence variations on splicing regulation. These resources are invaluable for prioritizing variants for functional studies.
SpliceVarDB: A comprehensive database consolidating over 50,000 experimentally validated variants assayed for their effects on splicing across more than 8,000 human genes [23]. Approximately 25% are classified as "splice-altering," with 55% of these located outside canonical splice sites, providing crucial data for interpreting variants of uncertain significance [23].
DeepCLIP: A deep learning-based tool that predicts the binding of RNA-binding proteins (RBPs) to RNA sequences, and how mutations affect this binding [19]. This is particularly valuable for understanding how sequence variations in regulatory elements disrupt protein-RNA interactions critical for splicing regulation.
VulExMap: A computational method specifically designed to identify constitutive exons that are vulnerable to exonic splice mutations [19]. This helps prioritize exons where exonic mutations are most likely to cause splicing defects.
PTM-POSE: An open-source Python tool that projects post-translational modification (PTM) sites onto splice events, enabling systematic analysis of how alternative splicing may alter the PTM landscape of protein isoforms [18]. This is relevant for understanding the functional consequences of splicing regulation on protein function.
These tools, combined with established splice prediction algorithms like SpliceAI and Pangolin, provide researchers with a powerful toolkit for in silico assessment of splicing regulatory elements [21].
Therapeutic Implications and Future Perspectives
The modulation of splicing through cis-regulatory elements represents a promising therapeutic avenue for genetic diseases and cancer. Splice-switching antisense oligonucleotides (ASOs) are synthetic molecules designed to bind specific RNA sequences and block the access of trans-acting factors to cis-regulatory elements, thereby altering splicing patterns [16] [17]. For example, ASOs can be targeted to ISS elements to promote exon inclusion or to ESEs to block enhancer function and induce exon skipping [16]. This approach has achieved clinical success in treating neuromuscular disorders like Duchenne muscular dystrophy and spinal muscular atrophy [16].
Furthermore, the discovery of poison exons—exons whose inclusion introduces a premature termination codon leading to nonsense-mediated decay (NMD) of the transcript—offers another therapeutic strategy [24]. Small molecules or ASOs can be designed to modulate the splicing of these PEs, thereby tuning the expression of specific genes [24]. This is particularly promising for targeting genes traditionally considered "undruggable."
In cancer, aberrant splicing is a hallmark, with tumors exhibiting up to 30% more alternative splicing events than normal tissues [17]. Mutations in splicing factors (e.g., SF3B1, SRSF2, U2AF1) and dysregulation of SR proteins and hnRNPs are common oncogenic drivers [17]. Small molecule inhibitors targeting the spliceosome (e.g., sudemycins, pladienolide B) and ASOs designed against cancer-specific isoforms are under active investigation as anticancer therapeutics [17]. The ongoing development of these targeted interventions underscores the critical importance of understanding cis-acting regulatory elements for advancing precision medicine.
Alternative splicing represents a pivotal regulatory mechanism in eukaryotic gene expression, dramatically expanding the functional and regulatory complexity of the proteome. This process is orchestrated by intricate interactions between cis-acting regulatory elements within pre-mRNA and trans-acting splicing factors, primarily comprising serine/arginine-rich (SR) proteins and heterogeneous nuclear ribonucleoproteins (hnRNPs). These two major families of RNA-binding proteins function antagonistically and cooperatively to define splice site selection, regulate alternative splicing outcomes, and influence downstream mRNA metabolism. SR proteins generally promote exon inclusion through binding to exonic splicing enhancers, while hnRNPs often facilitate exon exclusion by recognizing exonic or intronic splicing silencers. Understanding the precise mechanisms, structural features, and functional relationships between these regulators provides critical insights into normal development, tissue-specific differentiation, and disease pathogenesis, particularly in neurological disorders and cancer. This technical guide comprehensively examines the molecular architecture, regulatory mechanisms, and experimental approaches for investigating SR proteins and hnRNPs, serving as an essential resource for researchers exploring splicing mechanisms and their therapeutic applications.
Alternative splicing enables a single gene to generate multiple mRNA isoforms through differential inclusion of exonic and intronic sequences, contributing significantly to proteomic diversity. More than 95% of human multi-exon genes undergo alternative splicing, with the highest complexity observed in neural tissues [2] [25]. This process is governed by the coordinated action of cis-regulatory elements and trans-acting factors that collectively determine splice site recognition and usage [3].
The two principal classes of trans-acting splicing factors—SR proteins and hnRNPs—operate within an integrated network that responds to cellular signals, environmental cues, and developmental programs. SR proteins, characterized by RNA recognition motifs (RRMs) and arginine/serine-rich (RS) domains, typically function as splicing activators [26]. In contrast, hnRNPs, containing varied RNA-binding domains such as RRMs, quasi-RRMs (qRRMs), KH domains, and RGG boxes, often serve as splicing repressors [27] [25]. The balance between these antagonistic forces fine-tunes splicing outcomes in a context-dependent manner, with disruptions leading to numerous human diseases [2].
Beyond their splicing functions, both protein families participate in broader RNA metabolic processes, including mRNA export, stability, translation, and decay. This functional versatility positions SR proteins and hnRNPs as central regulators of gene expression pathways, making them compelling targets for therapeutic intervention in splicing-related disorders [2].
Molecular Structure and Classification
SR Proteins: Domain Architecture and Family Members
SR proteins constitute a conserved family of splicing regulators characterized by a modular structure comprising one or two N-terminal RNA recognition motifs (RRMs) and a C-terminal RS domain rich in arginine-serine dipeptides [26]. The RRM domains mediate sequence-specific RNA binding, primarily to exonic splicing enhancers (ESEs), while the RS domain facilitates protein-protein interactions with other splicing components and recruits the basal splicing machinery [28] [26].
Table 1: Major SR Protein Family Members and Characteristics
| Gene | Protein Aliases | Molecular Weight (kDa) | Domains | Functional Notes |
|---|---|---|---|---|
| SRSF1 | ASF/SF2, SRp30a | 28-33 | 2xRRM, RS | Prototypical SR protein; essential for viability; regulates alternative splicing and mRNA export |
| SRSF2 | SC35, SRp30b | ~30 | 1xRRM, RS | Critical for spliceosome assembly; recognizes specific purine-rich ESEs |
| SRSF3 | SRp20 | ~20 | 1xRRM, RS | Shuttling SR protein; involved in mRNA export; regulates alternative polyadenylation |
| SRSF7 | 9G8 | ~30 | 1xRRM, RS, Zn knuckle | Unique zinc knuckle domain; shuttling protein; binds GAC triplet sequences [28] |
| TRA2B | Transformer-2 beta | ~33 | 1xRRM, RS | Regulates specific exons including SMN2 exon 7; binds to GAARE sequences |
The RS domain exists in a largely unstructured state but undergoes regulated phosphorylation that controls SR protein localization, activity, and interactions. Phosphorylation of serine residues in the RS domain promotes nuclear localization and integration with the splicing machinery, while dephosphorylation facilitates nuclear export and participation in translational regulation [26].
hnRNPs: Structural Diversity and Functional Domains
The hnRNP family encompasses approximately 20 canonical members (hnRNP A-U) with diverse domain architectures and molecular weights ranging from 34-120 kDa [27] [25]. Unlike SR proteins, hnRNPs lack a unifying domain structure but typically contain combinations of RRMs, quasi-RRMs (qRRMs), K homology (KH) domains, and RGG boxes that confer RNA-binding specificity [27].
Table 2: Major hnRNP Family Members and Characteristics
| hnRNP | Isoforms | Molecular Weight (kDa) | RNA-Binding Domains | Primary Functions |
|---|---|---|---|---|
| hnRNP A/B | A0, A1, A2/B1, A3 | 34-40 | 2xRRM, Gly-rich, RGG | Splicing repression; mRNA stability; telomere maintenance |
| hnRNP C | C1, C2 | 41/43 | RRM, Acid-rich | Early spliceosome assembly; uridine-rich RNA binding |
| hnRNP K | AUKS | 55-65 | 3xKH, Other | Integrates transcription and splicing; regulated by multiple PTMs |
| hnRNP U | SAF-A | 120 | Acid-rich, Gly-rich, RGG, Other | Nuclear matrix association; chromatin interactions |
| hnRNP L | 68 | 4xRRM, Gly-rich | Regulates splicing of specific transcripts including vascular endothelial genes |
The modular composition of hnRNPs, with varied arrangements of structured RNA-binding domains and unstructured auxiliary regions, enables recognition of diverse RNA sequences and participation in multiple steps of RNA processing [25]. Post-translational modifications including phosphorylation, methylation, and ubiquitination further expand the functional repertoire of hnRNPs by modulating their RNA-binding affinity, protein-protein interactions, and subcellular localization [27].
Mechanisms of Splicing Regulation
Basic Splicing Machinery and Regulatory Elements
The spliceosome, a dynamic macromolecular complex comprising five small nuclear ribonucleoproteins (snRNPs) and numerous associated proteins, catalyzes pre-mRNA splicing through recognition of consensus sequences at exon-intron boundaries: the 5' splice site, 3' splice site, branch point sequence, and polypyrimidine tract [3]. Alternative splicing introduces additional regulatory complexity through cis-acting elements categorized as exonic splicing enhancers (ESEs), intronic splicing enhancers (ISEs), exonic splicing silencers (ESSs), and intronic splicing silencers (ISSs) [2].
SR proteins predominantly bind to ESEs and ISEs through their RRM domains, then recruit and stabilize core splicing components (U1 snRNP at 5' splice sites and U2AF at 3' splice sites) via phosphorylated RS domains [26]. This recruitment promotes spliceosome assembly on adjacent introns, leading to enhanced inclusion of regulated exons [3] [26].
Conversely, hnRNPs typically bind to ESSs or ISSs and repress splicing through several mechanisms: competitive binding with SR proteins for overlapping sites, steric hindrance that blocks access of spliceosomal components, or direct protein-protein interactions that interfere with spliceosome assembly [27] [2]. Some hnRNPs, such as hnRNP A1, can also promote exon skipping by bridging across exons and looping out intervening sequences [3].
Diagram 1: Competitive regulation of alternative splicing by SR proteins and hnRNPs. SR proteins bind exonic splicing enhancers (ESEs) and recruit spliceosomal components through RS domain interactions, promoting exon inclusion. hnRNPs bind exonic or intronic splicing silencers (ESSs/ISSs) and repress splicing through steric hindrance or competitive binding, leading to exon exclusion.
Coordination with Transcription and Chromatin Landscape
Splicing occurs predominantly co-transcriptionally, with the carboxyl-terminal domain (CTD) of RNA polymerase II serving as a platform for recruiting splicing factors to nascent transcripts [29] [30]. The phosphorylation state of the CTD heptad repeats (YSPTSPS) changes during transcription elongation, creating a "splicing code" that coordinates the recruitment of specific SR proteins and other splicing regulators at appropriate positions along the gene [30].
Chromatin structure further influences splicing outcomes through multiple mechanisms. Nucleosome positioning correlates with exon definition, with exons exhibiting higher nucleosome occupancy than introns [29]. Histone modifications also impact splicing; for example, H3K36me3 marks associated with transcriptional elongation recruit specific splicing regulators through adaptor proteins [29]. These interconnections demonstrate that splicing regulation is integrated within a broader transcriptional machinery rather than operating as an independent process.
Experimental Approaches and Methodologies
Analyzing Splicing Factor Binding Specificity
Systematic Evolution of Ligands by Exponential Enrichment (SELEX) has been instrumental in defining the RNA-binding preferences of SR proteins and hnRNPs. The experimental workflow involves:
- Library Preparation: Generating a random oligonucleotide library (typically 20-40 nucleotides in length) flanked by constant primer binding sites.
- Binding Reaction: Incubating the RNA library with the purified splicing factor of interest.
- Partitioning: Separating protein-bound RNAs from unbound sequences through nitrocellulose filter binding, immunoprecipitation, or other capture methods.
- Amplification: Reverse transcribing and PCR amplifying the bound RNAs to generate an enriched library for subsequent rounds of selection.
- Sequencing and Analysis: Cloning and sequencing the selected RNAs after 5-15 rounds of selection, followed by motif analysis to identify consensus binding sequences.
Application of this approach revealed that SR protein 9G8 selects RNA sequences containing GAC triplets, while a mutated zinc knuckle variant of 9G8 selects different sequences centered around a (A/U)C(A/U)(A/U)C motif, demonstrating the importance of auxiliary domains in RNA recognition specificity [28]. Similarly, SELEX experiments with SC35 identified pyrimidine or purine-rich motifs as preferred binding sites [28].
Distinguishing cis- and trans-Directed Splicing Events
Long-read RNA Sequencing with Allelic Linkage Analysis enables systematic identification of splicing events primarily regulated by cis-acting genetic variants versus those controlled by trans-acting factors [31]. The isoLASER method provides a comprehensive workflow:
- Library Preparation and Sequencing: Generating full-length cDNA libraries suitable for PacBio or Oxford Nanopore long-read sequencing platforms.
- Variant Calling: Identifying heterozygous single nucleotide polymorphisms (SNPs) directly from RNA-seq data using local reassembly approaches and machine learning classifiers to eliminate false positives.
- Gene-level Phasing: Grouping sequencing reads by haplotype using k-means clustering based on variant alleles weighted by quality scores.
- Allelic Linkage Testing: Quantifying allele-specific splicing ratios for each heterozygous gene by comparing splicing patterns between haplotypes.
- Classification: Designating exons with significant haplotype-biased inclusion as "cis-directed" and those with balanced inclusion across haplotypes as "trans-directed" [31].
This approach has revealed that genetic background significantly influences individual splicing profiles, with cis-directed events being particularly abundant in highly polymorphic regions like the HLA locus [31].
Diagram 2: isoLASER workflow for identifying cis- and trans-directed splicing events. Long-read RNA sequencing enables haplotype phasing and allele-specific splicing quantification, distinguishing events regulated by local genetic variants (cis) from those controlled by cellular environments (trans).
The Scientist's Toolkit: Essential Research Reagents
Table 3: Key Research Reagents for Studying SR Proteins and hnRNPs
| Reagent/Category | Specific Examples | Function/Application | Technical Notes |
|---|---|---|---|
| SR Protein Antibodies | mAb104, B52 | Immunodetection, immunoprecipitation | mAb104 recognizes phosphoepitope on RS domains; B52 binds SRSF6 [26] |
| Kinase Inhibitors | SRPK1 inhibitors, CLK inhibitors | Modulate SR protein phosphorylation | Affect nucleocytoplasmic shuttling and splicing activity [26] |
| SELEX Components | Random oligonucleotide library, Purified splicing factors | Defining RNA-binding specificity | Typically 5-15 selection rounds with increasing stringency [28] |
| Long-read Sequencing | PacBio Sequel II, Oxford Nanopore | Full-length isoform sequencing, haplotype phasing | Enables direct observation of complete splicing patterns [31] |
| Crosslinking Methods | UV crosslinking, CLIP variants | Mapping protein-RNA interactions in vivo | Critical for distinguishing direct versus indirect binding |
Functional Roles in Development and Disease
Tissue Development and Differentiation
SR proteins and hnRNPs exhibit distinct yet coordinated expression patterns during tissue development and differentiation. The brain represents a particularly complex regulatory environment, exhibiting the highest diversity of alternative splicing events among human tissues [25]. hnRNPs such as hnRNP H and F regulate the proteolipid protein (PLP/DM20) ratio in oligodendrocytes by modulating U1 snRNP recruitment, with implications for myelin formation and maintenance [3]. Similarly, PTBP1 (hnRNP I) and PTBP2 control neurodevelopmental transitions through regulated splicing of transcripts encoding synaptic proteins and ion channels [2].
In stem cells, hnRNPs maintain pluripotency and regulate differentiation through multiple mechanisms including alternative splicing of transcription factors, mRNA stability control, and telomere maintenance [27]. For example, hnRNP A1 regulates the alternative splicing of FOXP1 to produce isoforms that differentially influence embryonic stem cell differentiation [27].
Implications for Human Disease
Dysregulation of SR proteins and hnRNPs contributes significantly to human disease pathogenesis. In cancer, aberrant expression of splicing factors promotes oncogenic transformation through multiple mechanisms: generating proliferative isoforms of oncogenes, inactivating tumor suppressors via alternative splicing, and enhancing angiogenesis and metastasis [2]. SRSF1 is frequently overexpressed in tumors and promotes alternative splicing of BIN1, MNK2, and other cancer-relevant transcripts [2].
Neurodevelopmental and neurodegenerative disorders represent another major category of splicing factor-related pathologies. Mutations in hnRNP genes cause neurological syndromes including intellectual disability, epilepsy, microcephaly, amyotrophic lateral sclerosis, and frontotemporal dementia [25]. The particular vulnerability of neural tissues to splicing defects reflects the exceptionally complex alternative splicing patterns required for neuronal development and function [25].
Table 4: Splicing Factor Dysregulation in Human Disease
| Splicing Factor | Related Diseases | Molecular Mechanisms | Therapeutic Approaches |
|---|---|---|---|
| SRSF1 | Various cancers, Ataxia telangiectasia | Oncogenic isoform switching; disrupted DNA damage response | SRPK1 inhibitors; antisense oligonucleotides |
| hnRNP A1 | ALS, FTD, Alzheimer's disease | Altered splicing of tau and other neuronal transcripts; toxic nuclear aggregates | Small molecule inhibitors; modulators of autoregulation |
| hnRNP H | Familial ALS, Frontotemporal dementia | Dysregulation of cryptic exon inclusion in neurodegeneration genes | Antisense oligonucleotides targeting pathogenic exons |
| TRA2B | Spinal muscular atrophy | Impaired SMN2 exon 7 inclusion contributing to SMN protein deficiency | Splicing-switching oligonucleotides (Nusinersen) |
Concluding Perspectives
The intricate regulatory networks governed by SR proteins and hnRNPs represent a crucial layer of gene expression control that expands the functional complexity of eukaryotic genomes. Ongoing research continues to elucidate the precise molecular mechanisms through which these factors recognize their RNA targets, recruit the splicing machinery, and integrate with other gene regulatory pathways. Emerging technologies—particularly long-read sequencing, improved proteomic methods, and single-cell approaches—promise to reveal unprecedented detail about splicing regulation in different cellular contexts and disease states.
Therapeutic targeting of splicing factors and their regulatory networks represents a promising frontier for treating numerous human diseases. Several strategies show considerable potential: small molecule inhibitors of splicing factor kinases (e.g., SRPK1), antisense oligonucleotides that modulate splicing of specific disease-relevant transcripts, and compounds that directly disrupt protein-RNA interactions. As our understanding of SR proteins and hnRNPs continues to deepen, these regulatory proteins will undoubtedly yield new insights into fundamental biology and provide innovative approaches for precision medicine.
The expression of eukaryotic genes requires the precise coordination of transcription and pre-mRNA splicing. For the majority of human genes, these processes are functionally coupled, with RNA Polymerase II (Pol II) playing a central role in orchestrating splicing alongside transcription. This coupling enables the regulation of alternative splicing, which affects over 95% of human genes and dramatically expands proteomic diversity. This technical review examines the molecular mechanisms underlying co-transcriptional splicing coupling, focusing on spatial and kinetic models mediated by Pol II, with implications for understanding gene regulation and developing therapeutic interventions for splicing-related diseases.
In eukaryotes, the separation of transcription and translation necessitates sophisticated RNA processing mechanisms. Pre-mRNA splicing, the removal of non-coding introns and ligation of coding exons, represents a critical step in gene expression. Historically viewed as a post-transcriptional event, substantial evidence now demonstrates that splicing occurs predominantly co-transcriptionally [32] [33]. This paradigm shift recognizes that the physiological substrate for splicing is not a full-length, freely diffusible pre-mRNA, but a nascent RNA chain growing at approximately 0.5-4 kb/min as it emerges from the transcribing Pol II complex [34] [35].
The C-terminal domain (CTD) of Pol II's largest subunit serves as a central platform for coordinating RNA processing. This unique appendage, consisting of 52 tandem repeats of the heptad sequence YSPTSPS in humans, undergoes dynamic phosphorylation during the transcription cycle, creating distinct binding surfaces for processing factors at different transcriptional stages [32] [33]. The coordination between transcription and splicing has profound implications for alternative splicing regulation, which generates multiple mRNA isoforms from single genes and affects approximately 95% of human genes [34] [35].
Molecular Mechanisms of Coupling
Spatial Coupling: Recruitment via the Pol II CTD
Spatial coupling ensures that splicing factors are positioned at the right place and time during transcription through direct physical interactions with the transcription machinery. The phospho-CTD code dictates the recruitment of specific processing factors throughout the transcription cycle [34] [35].
Table 1: CTD Phosphorylation States and Splicing Factor Recruitment
| Phosphorylation Site | Transcription Stage | Recruited Splicing Factors | Functional Consequences |
|---|---|---|---|
| Ser5-P | Promoter-proximal | U1 snRNP, SR proteins | Enhanced early spliceosome assembly [33] |
| Ser2-P | Elongation | U2AF65, U2 snRNP | Stabilization of 3' splice site recognition [34] |
| Ser7-P | Initiation/Elongation | Unknown splicing factors | Potential role in integrator recruitment [32] |
The CTD directly facilitates the recruitment of key splicing components. Inhibition of Ser2 phosphorylation reduces co-transcriptional splicing and impairs recruitment of U2AF65 and U2 snRNP [34]. The FUS protein, a regulator of alternative splicing, binds the CTD and helps maintain Ser2 phosphorylation, while acting as an adaptor for U1 snRNP binding to Pol II [34]. Beyond the CTD, the mediator complex influences alternative splicing through its Med23 subunit contacting splicing factors hnRNPL, SF3B, and Eval1 [34].
Figure 1: Spatial coupling mechanism showing Pol II CTD-mediated recruitment of splicing factors to nascent RNA
Kinetic Coupling: Transcription Elongation Rate
Kinetic coupling links the speed of transcription elongation with alternative splicing outcomes through a "window of opportunity" or "first come, first served" model [34] [35]. According to this model, when upstream and downstream splice sites compete for pairing partners, the upstream site gains a competitive advantage when elongation is slow, as splicing factors have more time to recognize and assemble on suboptimal splice sites before downstream competitors emerge.
Table 2: Effects of Elongation Rate on Alternative Splicing Outcomes
| Elongation Rate | Splicing Outcome | Proposed Mechanism | Example Genes |
|---|---|---|---|
| Slow | Increased inclusion of alternative exons | Extended window for weak splice site recognition | Fibronectin, NCAM [34] |
| Slow | Enhanced exon skipping | Extended window for negative regulator binding | CFTR exon 9 (ETR-3 binding) [34] |
| Fast | Altered splice site competition | Reduced time for regulatory factor binding | Genome-wide effects [34] |
| Optimal ("Goldilocks") | Proper splicing balance | Neither too fast nor too slow elongation | Majority of rate-sensitive exons [34] |
Unexpectedly, genome-wide studies using Pol II rate mutants revealed that many alternative exons require an optimal elongation rate that is "just right" – neither too fast nor too slow – suggesting a "Goldilocks" model for kinetic coupling [34]. This model posits that proper splicing regulation requires precise tuning of elongation rates within specific boundaries.
Chromatin and Spliceosome Connections
Chromatin Landscape Influences Splicing
The chromatin template plays an active role in regulating co-transcriptional splicing through several interconnected mechanisms. Nucleosome positioning exhibits a striking pattern of enrichment at exons compared to introns, creating a "punctuation" mark that may help signal exon boundaries to the splicing machinery [35]. This nucleosome positioning is influenced by higher GC content in exonic regions and contributes to transcriptional pausing that facilitates splice site recognition.
Multiple histone modifications show differential distributions between exons and introns. Exons are enriched for H3K36me3, H3K27me1/2/3, and H4K20me1, while introns show relative enrichment of H3K4me1/2, H3K9me1, and H3K79me1/2/3 [35]. These modifications can influence splicing decisions through both kinetic mechanisms (by affecting Pol II elongation rates) and spatial mechanisms (by recruiting splicing regulators).
The functional significance of chromatin in splicing regulation is demonstrated by the effects of chromatin-modifying enzymes. Inhibition of histone deacetylases (HDACs) alters alternative splicing patterns in a manner dependent on Pol II elongation rate [35]. Similarly, the histone methyltransferase SETD2, which creates H3K36me3 marks, influences splicing decisions when tethering experiments position it to a specific gene [35].
Spliceosome Assembly Pathways
Spliceosome assembly occurs through sequential, ATP-dependent steps that can follow either intron definition or exon definition pathways. In intron definition, used predominantly for short introns, recognition occurs across a single intron. In exon definition, more common for long mammalian introns, recognition occurs across the bounded exon, with subsequent conversion to intron definition before catalysis [36] [33].
Recent co-transcriptional splicing studies have challenged the conventional view of exon definition predominance in long introns. Co-transcriptional lariat sequencing (CoLa-seq) in human cells revealed that the first catalytic step of splicing often occurs before transcription of the downstream exon is complete, thereby precluding cross-exon interactions required for exon definition [33]. This suggests that co-transcriptional context may favor intron definition even for long introns.
Experimental Evidence and Methodologies
Key Experimental Systems
Several experimental approaches have been crucial for establishing the functional coupling between transcription and splicing:
In vitro transcription-splicing systems using Pol II-driven transcription coupled with splicing in nuclear extracts demonstrated that Pol II transcription directs nascent pre-mRNA into productive spliceosome assembly, while T7 polymerase transcription leads to non-productive complexes with hnRNP proteins [37]. This system revealed that Pol II transcription increases both the kinetics and efficiency of splicing compared to uncoupled systems.
Chromatin-associated RNA sequencing methods permit simultaneous identification of the RNA 3' end (indicating Pol II position) and splicing status through exon-exon junctions or lariat branch points [33]. Techniques such as co-transcriptional lariat sequencing (CoLa-seq) provide high-resolution mapping of splicing intermediates relative to transcription position.
Native elongation transcript sequencing (NET-seq) maps the 3' ends of nascent transcripts at single nucleotide resolution, revealing Pol II pausing patterns associated with splicing. Plant NET-seq (pNET-seq) adapted for Arabidopsis has demonstrated connections between splicing efficiency and Pol II pausing at gene 3' ends [38].
The Scientist's Toolkit: Research Reagent Solutions
Table 3: Essential Research Reagents for Studying Co-transcriptional Splicing
| Reagent / Method | Function / Application | Key Findings Enabled |
|---|---|---|
| Pol II CTD antibodies (Ser2P, Ser5P, Ser7P) | Mapping phosphorylation states during transcription | Phospho-CTD code correlation with splicing factor recruitment [34] [38] |
| α-amanitin | Specific inhibition of Pol II transcription | Demonstration of transcription dependence of spliceosome assembly [37] |
| DRB (5,6-dichloro-1-β-D-ribofuranosylbenzimidazole) | Reversible inhibition of transcription elongation | Genome-wide mapping of Pol II elongation rates [34] |
| NET-seq/mNET-seq | High-resolution mapping of nascent transcripts | Identification of Pol II pausing at splice sites [35] [38] |
| Chromatin-associated RNA seq | Analysis of splicing intermediates on chromatin | Determination that ~75% of introns are removed co-transcriptionally [36] [33] |
| Co-transcriptional lariat sequencing (CoLa-seq) | Mapping splicing intermediates relative to Pol II position | Discovery of "ultrafast" splicing before downstream exon synthesis [33] |
Visualization of Kinetic Coupling Models
Figure 2: Kinetic coupling models showing how elongation rate affects splice site competition
Implications for Alternative Splicing and Protein Diversity
The coupling of transcription with splicing represents a fundamental mechanism for expanding proteomic complexity. Most alternative splicing decisions are made co-transcriptionally, enabling precise regulation of tissue-specific and developmentally-controlled isoform expression [34] [32]. The functional coupling allows for sophisticated integration of transcriptional and post-transcriptional regulatory information.
Promoter identity can influence alternative splicing patterns, as demonstrated by promoter-swapping experiments with the fibronectin EDI exon, where different promoters altered sensitivity to SR proteins SF2/ASF and 9G8 [39]. This provides a mechanism for coordinating transcriptional initiation with downstream splicing decisions.
Transcription factors contribute to splicing regulation beyond their roles in initiation. Deep learning models analyzing open chromatin regions in retained introns identified enriched motifs for zinc finger transcription factors, suggesting their direct involvement in intron retention regulation [40]. ChIP-seq data confirmed strong over-representation of zinc finger transcription factor peaks in intron retention events.
Abnormal splicing patterns are hallmarks of many diseases, including cancer [34] [35]. Understanding the mechanistic basis of co-transcriptional splicing coupling may reveal new therapeutic opportunities for splicing-related diseases. For example, small molecules that modulate Pol II elongation rates could potentially correct aberrant splicing patterns in specific genetic contexts.
The functional coupling between RNA Polymerase II transcription and pre-mRNA splicing represents a sophisticated mechanism for integrating multiple layers of gene regulation. The Pol II CTD serves as a central coordinating platform, while elongation rate provides a kinetic control mechanism for alternative splicing decisions. Chromatin features, including nucleosome positioning and histone modifications, further contribute to splicing regulation by influencing elongation kinetics and recruiting regulatory factors.
Future research directions include elucidating how RNA secondary structures formed during transcription influence splicing decisions, understanding the bidirectional coupling whereby splicing factors reciprocally influence transcription elongation, and developing therapeutic strategies that target the coupling machinery to correct disease-associated splicing defects. The continued development of high-resolution methods for monitoring transcription and splicing simultaneously in living cells will be crucial for advancing our understanding of this complex regulatory network.
Alternative splicing (AS) is a fundamental post-transcriptional mechanism that enables a single gene to generate multiple mRNA transcripts through the selective inclusion or exclusion of exons and introns [41] [42]. This process significantly expands proteomic diversity without increasing gene number and serves as a crucial regulatory mechanism for functional specialization across tissues, developmental stages, and environmental conditions [42] [43]. The evolutionary dynamics of alternative splicing reveal a complex story of adaptation and innovation, with splicing rates varying dramatically across the tree of life [41]. Recent large-scale comparative genomic analyses have uncovered striking patterns: while unicellular organisms exhibit minimal splicing, mammals and birds demonstrate the highest levels of alternative splicing, despite sharing conserved intron-rich genomic architectures [42]. This technical review examines the evolutionary patterns of splicing variation, provides standardized metrics for cross-species comparison, details experimental methodologies for splicing characterization, and explores the structural and functional implications of splice variation with particular relevance to biomedical and pharmaceutical research.
Evolutionary Patterns of Alternative Splicing Across Taxa
Large-Scale Comparative Analysis Using the Alternative Splicing Ratio
To enable systematic cross-species comparisons, researchers have developed a novel genome-wide metric termed the Alternative Splicing Ratio (ASR), which quantifies the average number of distinct transcripts generated per coding sequence [42] [43]. This standardized measure captures the extent to which coding DNA sequences are reused across entire transcriptomes, providing a single numerical value that facilitates large-scale evolutionary analysis. The ASR was computed for 1,494 species spanning the entire tree of life, with normalization (ASR*) applied to correct for annotation-related biases introduced by differences in sequencing depth, tissue diversity, assembly quality, and computational gene prediction methods [42].
Table 1: Alternative Splicing Ratio (ASR) Distribution Across Major Taxonomic Groups
| Taxonomic Group | Representative Species | ASR Range | Splicing Complexity | Genomic Features |
|---|---|---|---|---|
| Mammals | Human, mouse, bat | High | Highest | Intron-rich, ~50% intergenic DNA |
| Birds | Chicken, zebra finch | High | High | Intron-rich, conserved architecture |
| Plants | Maize, Arabidopsis | Moderate | Variable | Large genomes, transposable elements |
| Arthropods | Fruit fly, mosquito | Moderate-High | Moderate | Compact genomes |
| Unicellular Eukaryotes | Yeast, protists | Low | Minimal | Gene-dense, minimal introns |
| Prokaryotes | Bacteria, archaea | Very Low | None or minimal | No nuclear introns |
Variation Across Major Lineages
Comparative analysis of ASR values reveals significant differences across taxonomic groups [42] [43]. Unicellular organisms—including archaea, bacteria, fungi, and unicellular eukaryotes—display consistently low levels of alternative splicing, supporting the hypothesis that AS represents an advanced regulatory feature associated with multicellularity [41]. Among multicellular eukaryotes, vertebrates exhibit significantly higher levels of alternative splicing than invertebrates, with mammals and birds showing the highest complexity [42]. Interestingly, despite sharing a conserved intron-rich genomic architecture, mammals and birds show considerable interspecies divergence in splicing activity, suggesting lineage-specific evolutionary pressures [42].
Plants present a distinctive pattern, exhibiting moderate levels of alternative splicing but exceptionally high variability in genomic composition [41] [43]. Plant genome expansion frequently occurs through whole-genome duplications and repetitive element accumulation, with approximately 70% of flowering plants having undergone polyploidization events [43]. These duplications lead to subfunctionalization, where duplicated genes evolve different splicing isoforms to fulfill distinct functional roles, thereby increasing alternative splicing diversity [43].
Genomic Architecture Correlations
A strong negative correlation exists between alternative splicing and the proportion of coding content in genes, with the highest levels of alternative splicing observed in genomes containing approximately 50% intergenic DNA [42] [43]. This relationship highlights the importance of non-coding genomic regions in the evolutionary development of alternative splicing regulatory mechanisms. Increased intron length specifically correlates with greater transcriptomic complexity, as longer intronic sequences contain more regulatory elements that influence splice site selection [42].
Experimental Methodologies for Splicing Characterization
RNA Extraction and Reverse Transcription
Total RNA can be extracted from any biological source, though this protocol specifically utilizes mammalian cells grown in tissue culture [44]. The E.Z.N.A. Total RNA Isolation Kit (Omega Bio-Tek) is recommended, with cells lysed directly using the provided buffer [44]. After collection in 350 μL RNA lysis buffer, the sample is mixed with 70% ethanol, transferred to an RNA purification column, and centrifuged at 10,000 × g for 1 minute [44]. Sequential washes with RNA wash buffers I and II are performed, followed by removal of residual wash buffer via maximum-speed centrifugation [44]. RNA is eluted using nuclease-free water and quantified via UV spectrometry, with high-quality RNA demonstrating a 260nm/280nm absorbance ratio of approximately 2.0 [44].
For reverse transcription, a 20μL reaction is prepared containing 250-1000 ng of total RNA, 0.05 μg random hexamer primers, 50 pmol MgCl₂, 10 pmol dNTPs, 2 μL 5× GoScript Buffer, and 1 μL of GoScript Reverse Transcriptase [44]. The reaction undergoes incubation at 25°C for 5 minutes (primer annealing), 42°C for 60 minutes (RT reaction), and 70°C for 5 minutes (enzyme inactivation) in a programmable thermocycler [44].
PCR-Based Splicing Detection Methods
Quantitative PCR (qPCR) Approach
Quantitative PCR following reverse transcription provides extreme sensitivity for detecting specific splice isoforms during the exponential phase of PCR amplification [44]. Primer design is critical for differentiating splice variants. For exon skipping events (the most common form of alternative splicing), three primers are designed: (1) a forward primer within the variable exon with a reverse primer in the immediately downstream constitutive exon to detect isoforms with the variable exon included; (2) a forward primer spanning the junction created when the variable exon is skipped with a reverse primer in the constitutive exon to specifically detect exclusion isoforms; and (3) primers in constitutive exons to detect all isoforms of the mRNA [44].
Table 2: Primer Design Strategies for Alternative Splicing Detection
| Target Isoform | Forward Primer Location | Reverse Primer Location | Amplification Specificity |
|---|---|---|---|
| Inclusion isoform | Within variable exon | Downstream constitutive exon | Only transcripts with variable exon included |
| Exclusion isoform | Junction of flanking exons (skip) | Downstream constitutive exon | Only transcripts with variable exon skipped |
| All isoforms | Upstream constitutive exon | Downstream constitutive exon | All transcript variants |
| Reference gene | Constitutive exons of housekeeping gene | Constitutive exons of housekeeping gene | Normalization control |
Semiquantitative PCR with Electrophoresis
Semiquantitative methods, while less precise for quantification, allow direct visualization and comparison of splice isoform abundance based on size disparity between differentially spliced transcripts [44]. Using HotStarTaq Plus DNA Polymerase Reagents (Qiagen), PCR products are separated on 1.5% agarose gels prepared with 0.5× TBE buffer and 0.5 μg/mL ethidium bromide, then visualized using a UV transilluminator system [44]. This approach provides rapid assessment of splicing patterns, particularly useful for initial characterization experiments.
Splicing Minigene Assays for Regulatory Studies
Splicing minigene constructs enable investigation of the regulation of alternative splicing for specific exons of interest [44]. These recombinant plasmids contain the variable exon of interest with its flanking intronic and exonic sequences cloned into an expression vector. The minigene is co-transfected into mammalian cells (such as HEK293T) along with plasmids encoding splicing factors of interest using Lipofectamine 2000 Reagent [44]. After 24-48 hours, RNA is extracted and analyzed via RT-PCR to assess how the co-expressed splicing factors influence variable exon inclusion or skipping.
Computational Splicing Analysis
High-throughput RNA sequencing coupled with sophisticated computational tools has revolutionized alternative splicing analysis. Whippet is an RNA-seq analysis method that rapidly models and quantifies AS events of any complexity with hardware requirements compatible with a laptop computer [45]. This approach uses an entropic measure of splicing complexity and has revealed that approximately one-third of human protein coding genes produce transcripts with complex AS events involving co-expression of two or more principal splice isoforms [45]. These high-entropy AS events are more prevalent in tumor tissues and correlate with increased expression of proto-oncogenic splicing factors, highlighting their biomedical relevance [45].
Structural and Functional Implications of Splicing Variation
Structural Impact Prediction Using AlphaFold2
Recent advances in protein structure prediction enable systematic investigation of how alternative splicing affects protein structure [46]. Researchers have used AlphaFold2 to predict structures of more than 11,000 human isoforms, employing multiple metrics to identify splicing-induced structural alterations including template matching score, secondary structure composition, surface charge distribution, radius of gyration, and accessibility of post-translational modification sites [46].
Analysis reveals that structural similarity between isoforms largely correlates with degree of sequence identity, though a subset of isoforms demonstrate low structural similarity despite high sequence similarity [46]. Specific splicing types induce characteristic structural changes: exon skipping and alternative last exons tend to increase surface charge and radius of gyration, while splicing events frequently bury or expose post-translational modification sites [46]. For example, isoforms of the BAX gene show dramatic differences in PTM site accessibility with potential functional consequences for apoptosis regulation [46].
Functional Consequences and Cell-Type Specificity
Structure-based function prediction identifies numerous functional differences between isoforms of the same gene, with loss of function compared to the reference isoform predominating [46]. Integration with single-cell RNA-seq data from resources like the Tabula Sapiens enables determination of the cell types in which each predicted structure is expressed, providing crucial context for understanding isoform-specific functions in different cellular environments [46].
The Scientist's Toolkit: Essential Research Reagents and Materials
Table 3: Essential Research Reagents for Alternative Splicing Analysis
| Reagent/Material | Supplier/Example | Function/Application | Technical Notes |
|---|---|---|---|
| RNA Isolation Kit | E.Z.N.A. Total RNA Kit (Omega Bio-Tek) | Total RNA extraction from cells/tissues | Maintain RNA integrity; DNase treatment recommended |
| Reverse Transcriptase | GoScript (Promega) | cDNA synthesis from RNA templates | Random hexamers or gene-specific primers |
| qPCR Master Mix | GoTaq Green (Promega) | Quantitative PCR amplification | SYBR Green or probe-based detection |
| DNA Polymerase | HotStarTaq Plus (Qiagen) | Semiquantitative PCR | For endpoint analysis with gel electrophoresis |
| Transfection Reagent | Lipofectamine 2000 (Invitrogen) | Plasmid delivery into mammalian cells | Optimize DNA:reagent ratio for cell type |
| Mammalian Cell Line | HEK293T (ATCC) | Splicing minigene expression | High transfection efficiency |
| Expression Vectors | pcDNA3, custom minigenes | Splicing factor/minigene expression | Include appropriate selection markers |
| Electrophoresis System | Bio-Rad Gel Doc XR | PCR product visualization | Densitometric analysis capability |
| Thermal Cyclers | Bio-Rad DNA Engine, Roche LightCycler | PCR amplification | Real-time capability for qPCR |
Biomedical Implications and Research Applications
Splicing Regulation in Longevity and Disease
Cross-species analysis of alternative splicing across 26 mammalian species with varying maximum lifespans has identified hundreds of conserved splicing events significantly associated with longevity [47]. These MLS-associated splicing events are enriched in pathways related to mRNA processing, stress response, neuronal functions, and epigenetic regulation, and are largely distinct from genes whose expression correlates with MLS, indicating that alternative splicing captures unique lifespan-related signals beyond transcriptional regulation [47]. Notably, the brain contains twice as many tissue-specific splicing events as peripheral tissues and shows reduced overlap between body mass-associated and lifespan-associated splicing, suggesting specialized splicing regulation in neural tissues relevant to aging [47].
Technical Considerations and Methodological Advances
When employing these methodologies, several technical considerations are essential. Primer design requires careful validation to ensure isoform-specific detection, with housekeeping gene primers (e.g., targeting TATA-binding protein) necessary for normalization [44]. Minigene constructs must include adequate flanking intronic sequences that often contain regulatory elements recognized by splicing factors [44]. Computational methods must account for phylogenetic relationships when performing cross-species comparisons, with phylogenetically independent contrasts (PIC) recommended to ensure correlations are not driven by common ancestry [47].
The field continues to advance with emerging technologies including long-read sequencing for full-length isoform characterization, single-cell splicing analysis to resolve cellular heterogeneity, and CRISPR-based screening for functional validation of splicing variants. These approaches, combined with the foundational methodologies described herein, provide powerful tools for elucidating the evolutionary patterns and functional consequences of splicing variation across the tree of life.
Alternative splicing (AS) is a fundamental post-transcriptional process that enables a single gene to produce multiple mature mRNA isoforms through the non-uniform inclusion of exonic and intronic sequences, thereby greatly expanding the functional complexity of eukaryotic genomes [48] [16]. It is currently estimated that up to 95% of multi-exon human genes undergo alternative splicing, serving as a critical mechanism for generating proteomic diversity, regulating gene expression, and enabling cellular differentiation [47] [16]. This process is particularly significant in higher eukaryotes, where it effectively quadruples the number of protein isoforms compared to the number of protein-coding genes [48].
Tissue-specific splicing represents a sophisticated regulatory layer where alternative splicing events occur in a manner restricted to particular tissues or cell types. Early genome-wide analyses detected hundreds of tissue-specific alternative splice forms, with the highest number and greatest enrichment found in brain, eye-retina, muscle, skin, testis, and lymphoid tissues [49]. This tissue-specific regulation allows distinct cell types to fine-tune protein functions to meet local physiological requirements [48]. The functional consequences of tissue-specific splicing are profound, influencing neuronal development, immune responses, and metabolic specialization, while its dysregulation contributes significantly to human diseases, including neurological disorders, cancer, and rare genetic conditions [16] [50] [51].
Molecular Mechanisms and Regulatory Networks
Core Splicing Machinery and Regulation
Pre-mRNA splicing is orchestrated by the spliceosome, a large ribonucleoprotein complex composed of five small nuclear ribonucleoproteins (snRNPs)—U1, U2, U4, U5, and U6—along with numerous associated proteins [16]. This complex recognizes conserved cis-acting elements: the 5' splice site (donor site), the branch point sequence (BPS), the polypyrimidine tract (PPT), and the 3' splice site (acceptor site) [16]. The recognition of these elements is not strictly local; accumulating evidence supports the exon definition model, wherein the 5' and 3' splice sites flanking an exon are cooperatively recognized as a functional unit, with coordination between U1 and U2 snRNPs being particularly critical in higher eukaryotes with long introns [16].
Splicing outcomes are fine-tuned by RNA-binding proteins (RBPs) that act as trans-acting splicing regulators. Two major families of these regulators are the serine/arginine-rich splicing factors (SRSFs), which typically promote exon inclusion, and heterogeneous nuclear ribonucleoproteins (hnRNPs), which often facilitate exon skipping [16]. The binding of these regulators to cis-acting elements—splicing enhancers (ESEs, ISEs) or silencers (ESSs, ISSs)—modulates splice site selection and usage probability [16]. This regulatory flexibility enables cells to adjust splicing outcomes in response to developmental or physiological cues.
Mechanisms of Tissue-Specificity
Tissue-specific splicing patterns emerge from the combinatorial control exerted by ubiquitously expressed splicing factors alongside tissue-enriched or tissue-restricted regulators. For instance, the brain expresses a unique repertoire of splicing factors that generate exceptionally complex splicing patterns, with approximately twice as many tissue-specific splicing events compared to peripheral tissues [47] [52]. This complexity is exemplified by genes such as Dscam1 in Drosophila, which can generate up to 19,008 distinct ectodomain variants through stochastic selection of mutually exclusive exons, providing a molecular basis for neuronal self-avoidance and circuit formation [48].
The regulatory code for tissue-specific splicing is embedded in genomic sequences, which are recognized by both constitutive and tissue-specific splicing factors. Deep learning models like SpTransformer have demonstrated that tissue-specific splice site usage correlates with gene expression levels and can be predicted by analyzing sequence contexts, including distal regulatory elements located hundreds of nucleotides from splice junctions [50]. These models have identified putative splicing elements matching motifs of RBPs with known tissue-specific functions, such as PTBP1 in neuronal development [50].
Table 1: Key Molecular Components of Tissue-Specific Splicing Regulation
| Component Type | Key Elements | Functional Role |
|---|---|---|
| Core Spliceosome | U1, U2, U4, U5, U6 snRNPs | Catalyzes intron removal and exon ligation [16] |
| Cis-Regulatory Elements | 5' Splice Site, Branch Point, Polypyrimidine Tract, 3' Splice Site | Define exon-intron boundaries; recognized by spliceosome [16] |
| Enhanced/Repressed Elements | Exonic Splicing Enhancers/Silencers (ESEs/ESSs), Intronic Splicing Enhancers/Silencers (ISEs/ISSs) | Modulate splice site recognition through RBP binding [16] |
| Trans-Acting Regulators | SRSF proteins, hnRNPs, Tissue-Specific RBPs | Bind regulatory elements to activate or repress splicing [16] |
Functional Consequences of Tissue-Specific Splicing
Proteomic Diversity and Protein Isoform Functions
Tissue-specific splicing significantly expands functional complexity by generating protein isoforms with distinct structures, activities, and interaction partners. Systematic analyses using tools like PTM-POSE have revealed that approximately 30% of post-translational modification (PTM) sites are excluded from at least one protein isoform, while about 2% (14,850 sites) display altered flanking sequences that can modify enzyme recognition and binding motifs [18]. This splicing-mediated PTM diversification can rewire kinase-substrate networks and protein-interaction landscapes, as demonstrated in prostate cancer contexts where ESRP1-mediated splicing alters SGK1 signaling networks [18].
In the nervous system, splicing generates remarkable functional specialization. The neurexin family of genes (NRXN1, NRXN2, NRXN3) produces thousands of distinct isoforms through combinatorial splicing at multiple alternative sites, which precisely modulate their interactions with post-synaptic partners like neuroligins, LRRTM2, and cerebellin [48]. This diversity underpins the specification of synaptic properties and neural circuit formation. Inclusion or skipping of the NRXN3 SS4 exon, for example, alters trans-synaptic interactions and reduces AMPA receptor recruitment to post-synaptic sites [48].
Physiological and Evolutionary Adaptations
Comparative transcriptomic analyses across 26 mammalian species with maximum lifespans (MLS) ranging from 2.2 to 37 years (>16-fold difference) have revealed that alternative splicing constitutes a distinct, transcription-independent axis of lifespan regulation [47]. MLS-associated splicing events are enriched in pathways related to mRNA processing, stress response, neuronal functions, and epigenetic regulation, with the brain containing twice as many tissue-specific events as peripheral tissues [47] [52]. These MLS-associated events display stronger RBP motif coordination than age-associated splicing changes, suggesting an evolutionarily programmed adaptation for lifespan determination [47].
The relationship between body mass and lifespan also exhibits tissue-specific splicing patterns. While splicing events associated with body mass and maximum lifespan significantly overlap in most tissues, the brain shows the lowest overlap, indicating that neural splicing regulation of lifespan operates more independently from body size compared to peripheral tissues [47]. This highlights how tissue-specific splicing can contribute to species-specific evolutionary adaptations.
Table 2: Functional Outcomes of Tissue-Specific Splicing
| Functional Outcome | Representative Genes | Biological Significance |
|---|---|---|
| Neuronal Self-Recognition | Dscam1 (Drosophila), Protocadherins (Mammals) | Stochastic isoform expression generates unique cell surface codes for neuronal self-avoidance [48] |
| Synaptic Specification | Nrxn1, Nrxn2, Nrxn3 | Combinatorial splicing creates trans-synaptic interaction diversity [48] |
| Lifespan Regulation | MLS-AS events across 26 mammalian species | Evolutionarily conserved splicing programs in stress response and neuronal functions [47] |
| Signaling Network Rewiring | SGK1 substrates in prostate cancer | Altered kinase-substrate networks through PTM landscape changes [18] |
Experimental and Computational Methodologies
Transcriptome-Wide Splicing Analysis
The comprehensive analysis of tissue-specific splicing requires sophisticated experimental and computational approaches. RNA sequencing (RNA-Seq) has become the cornerstone technology for transcriptome-wide splicing detection, though it presents particular challenges for isoform resolution. Short-read sequencing (75-150 base pairs) necessitates complex computational reassembly of splicing fragments, while long-read sequencing technologies (spanning thousands of base pairs) provide more complete RNA structural information by capturing full-length transcripts [51].
For tissue-specific splicing identification, experimental designs must incorporate sufficient biological replication across multiple tissues. The following workflow illustrates a standardized pipeline for detecting and validating tissue-specific splicing events:
Diagram 1: Workflow for tissue-specific splicing analysis. The process begins with sample collection across multiple tissues and progresses through sequencing to computational analysis and final validation.
In comparative lifespan studies across 26 mammalian species, researchers employed an integrated pipeline involving transcriptome assembly and sequence comparison to identify homologous AS events [47]. They calculated Percent Spliced-In (PSI) values for alternative exons in each tissue and used Spearman correlation with maximum lifespans to identify significant associations, followed by phylogenetic independent contrasts to control for evolutionary relationships [47].
Computational Prediction and Interpretation
Advanced computational tools have been developed to predict splicing effects from sequence data and prioritize functionally relevant events. SpTransformer represents a state-of-the-art deep learning framework that employs transformer architecture with multi-head attention layers to predict tissue-specific RNA splicing events directly from genomic sequences [50]. This model outperforms previous methods (SpliceAI, MMSplice, HAL, MaxEntScan) with approximately 85% top-k accuracy and 91% AU-PRC, demonstrating particular strength in identifying splice sites with low versus high tissue usage [50].
For functional interpretation of splicing variants, databases such as SpliceVarDB provide essential resources, consolidating over 50,000 experimentally validated variants assayed for their effects on splicing across more than 8,000 human genes [23]. Importantly, 55% of splice-altering variants in SpliceVarDB are located outside canonical splice sites, with 5.6% being deep intronic variants that would escape detection by traditional exome sequencing [23].
The following diagram illustrates the computational strategy for predicting and interpreting tissue-specific splicing variants:
Diagram 2: Computational pipeline for predicting tissue-specific splicing variants and their functional impacts, culminating in therapeutic target identification.
Research Reagent Solutions and Experimental Tools
Table 3: Essential Research Reagents and Tools for Splicing Studies
| Reagent/Tool Category | Specific Examples | Function/Application |
|---|---|---|
| Sequencing Technologies | Pacific Biosciences long-read sequencers, Illumina short-read systems | Transcriptome-wide isoform detection and quantification [51] |
| Computational Prediction Tools | SpTransformer, SpliceAI, MMSplice, PTM-POSE | Predict tissue-specific splicing and functional consequences from sequence [18] [50] |
| Splicing-Focused Databases | SpliceVarDB, Human Alternative Splicing Database (HASDB) | Access experimentally validated splicing variants and tissue-specific events [49] [23] |
| Validation Assays | Single-cell RT-PCR, minigene splicing reporters, RNA FISH | Confirm tissue-specific splicing patterns and variant effects [48] [16] |
| Therapeutic Modulators | Antisense oligonucleotides (Nusinersen, Eteplirsen), Small molecule modulators | Experimentally manipulate splicing patterns for functional studies [16] [51] |
Clinical Implications and Therapeutic Applications
Splicing Defects in Human Disease
Splice-disruptive variants represent a substantial category of disease-causing mutations, estimated to account for 15-30% of all pathogenic variants in genetic disorders [16] [51]. These include not only canonical splice site disruptions but also deep-intronic, synonymous, and regulatory variants that perturb splicing enhancers, silencers, or branch point recognition [16]. The clinical manifestations of splicing defects often exhibit tissue-specific patterns that mirror the expression of affected genes and their alternative isoforms.
In neurological disorders, brain-specific splicing alterations are particularly prominent. SpTransformer analyses have revealed enrichment of tissue-specific splicing alterations in brain diseases independent of gene expression variation, with validation across three brain disease datasets involving over 164,000 individuals [50]. Similarly, studies of inflammatory bowel disease (IBD) have identified numerous genetic variants in intronic regions that may disrupt alternative splicing in disease-relevant tissues, highlighting the importance of studying splicing in cell types directly involved in disease pathogenesis [51].
RNA-Targeted Therapeutic Strategies
The recognition of splicing defects as a major disease mechanism has spurred development of RNA-targeted therapeutics. Splice-switching antisense oligonucleotides (SSOs) represent a particularly promising approach, with several already approved by the FDA: Nusinersen for spinal muscular atrophy (correcting SMN2 splicing), and Eteplirsen, Golodirsen, Casimersen, and Viltolarsen for Duchenne muscular dystrophy (restoring the DMD reading frame) [16].
These therapies exemplify the principle of targeted splicing correction. Nusinersen, for instance, modulates the alternative splicing of SMN2 by promoting inclusion of exon 7, thereby producing a functional SMN protein that compensates for the defective SMN1 gene in spinal muscular atrophy patients [16] [51]. The success of these therapies underscores the therapeutic potential of manipulating splicing patterns and highlights the importance of understanding tissue-specific splicing regulation for drug development.
Tissue-specific alternative splicing represents a critical regulatory layer that expands functional diversity across tissues and contributes to species-specific adaptations. The integration of advanced computational predictions, comprehensive databases of validated variants, and sophisticated experimental models is rapidly advancing our understanding of how splicing patterns are regulated across tissues and how their disruption leads to disease.
Future research directions will likely focus on mapping tissue-specific splicing networks at single-cell resolution across diverse cell types, developmental stages, and physiological conditions. Projects like IsoIBD and Project JAGUAR are already building population-scale maps of alternative splicing in disease-relevant tissues, providing foundations for precision medicine approaches [51]. Additionally, the development of more accurate prediction tools that can interpret noncoding variants and model their effects on tissue-specific splicing will enhance diagnostic yield and therapeutic target identification.
As RNA-targeted therapies continue to advance, with several now approved for clinical use and many more in development, the understanding of tissue-specific splicing regulation will become increasingly crucial for designing effective, targeted interventions that correct pathogenic splicing events while minimizing off-target effects in unaffected tissues [51]. This progression from basic mechanistic studies to therapeutic applications underscores the fundamental importance of tissue-specific splicing in health and disease.
Computational and Experimental Approaches for Splicing Analysis
High-Throughput RNA Sequencing Strategies for Splicing Detection
Alternative splicing is a fundamental post-transcriptional process that enables the production of multiple transcript and protein isoforms from a single gene, thereby greatly expanding the functional complexity of the genome and proteome [16]. Accurate splicing is essential for normal development and cellular homeostasis, contributing not only to transcript diversity but also to dosage regulation, particularly in genes that produce isoforms with differing stability or translation efficiency [16]. The detection and quantification of splicing variants through high-throughput RNA sequencing (RNA-seq) has thus become a cornerstone of modern genomics, providing critical insights into molecular mechanisms of health and disease. It is now estimated that over 95% of multi-exon human genes undergo alternative splicing, making its comprehensive analysis crucial for understanding protein diversity mechanisms [53]. This technical guide examines established and emerging computational and experimental strategies for splicing detection, with particular emphasis on their application in protein function research and therapeutic development.
Computational Tools for Splicing Analysis from RNA-seq Data
Classification and Performance of Splicing Detection Tools
The development of novel high-throughput sequencing (HTS) methods for RNA (RNA-Seq) has provided a powerful means to study splicing under multiple conditions at unprecedented depth [54]. However, the complexity of this information has necessitated the development of sophisticated computational tools that process RNA-Seq data to study the expression of isoforms and splicing events, and their relative changes under different conditions [54]. These tools can be broadly categorized into those that quantify whole isoforms and those that focus on localized alternative splicing "events" within a gene, with the latter often providing more accurate quantification from short-read data [55].
Table 1: Key Computational Tools for Splicing Variant Detection
| Tool | Methodology | Splicing Events Detected | Strengths | Best Use Cases |
|---|---|---|---|---|
| MAJIQ v2 [55] | Local Splicing Variations (LSVs), Bayesian modeling | Complex variations, unannotated junctions | Handles large, heterogeneous datasets; incremental sample addition | Large consortium data (GTEx, ENCODE), complex tissue studies |
| AS-Quant [53] | Categorization into 5 event types, statistical testing | SE, RI, A3SS, A5SS, MXE | Superior AUC (0.84) in simulations; integrated visualization | Genome-wide detection with visualization needs |
| rMATS [53] | Statistical modeling of replicate samples | SE, RI, A3SS, A5SS, MXE | Handles biological replicates | Controlled experimental designs with replicates |
| SUPPA2 [53] | Transcript quantification-based | SE, RI, A3SS, A5SS, MXE | Fast processing; uses transcript quantification | Large-scale differential splicing screening |
| scASfind [56] | Splicing node indexing, pattern matching | Cell type-specific patterns | Single-cell resolution; exhaustive pattern search | Full-length scRNA-seq data; cell type marker discovery |
The performance of these tools varies significantly based on the application. In simulation experiments, AS-Quant demonstrated the highest overall area under the ROC curve (AUC = 0.84) compared to SUPPA2 (AUC = 0.80), rMATS (AUC = 0.65), and diffSplice (AUC = 0.74) [53]. For specific event types, AS-Quant achieved near-perfect detection for skipped exons (SE), mutually exclusive exons (MXE), and alternative 3' splice sites (A3SS) with AUC scores close to 1 [53].
Addressing Specific Computational Challenges
Recent algorithmic advances have focused on addressing three key challenges in splicing analysis: dataset heterogeneity and scale, detection of unannotated events, and single-cell resolution. The MAJIQ v2 package introduces nonparametric statistical tests (MAJIQ HET) that quantify percent spliced in (PSI, denoted by Ψ) for each sample separately and then apply robust rank-based test statistics, increasing power in large heterogeneous datasets [55]. This approach is particularly valuable for datasets scaling to thousands of samples across dozens of experimental conditions that exhibit increased variability compared to biological replicates [55].
For capturing unannotated splicing variations, MAJIQ v2 combines transcript annotations and coverage from aligned RNA-seq experiments to build an updated splicegraph for each gene which includes de novo (unannotated) elements such as junctions, retained introns, and exons [55]. This capability is particularly important for the study of diseases such as cancer and neurodegeneration, which often involve aberrant splicing [55].
At the single-cell level, scASfind utilizes an efficient data structure to store the percent spliced-in value for each splicing event, enabling exhaustive searches for patterns among all differential splicing events across cell types [56]. This approach has demonstrated that splicing events can serve as more precise markers of cell identity than gene expression alone, particularly in complex tissues like the brain [56].
Experimental Strategies and Protocols
Targeted RNA-seq Splicing Detection Protocol
A novel single-gene, straightforward 1-day hands-on protocol for detection of splicing alterations with deep RNA sequencing from blood has been developed and validated [57]. This method provides a practical approach for diagnostic laboratories and researchers needing to determine the impact of genetic variants on splicing without requiring whole transcriptome sequencing.
Table 2: Key Research Reagent Solutions for Splicing Detection
| Reagent/Kit | Function | Application Notes |
|---|---|---|
| Tempus Blood RNA Tube [57] | RNA stabilization in whole blood | Preserves RNA integrity for splicing analysis |
| Tempus Spin RNA Isolation Kit [57] | Total RNA isolation | Maintains RNA quality for long-range PCR |
| SuperScript IV VILO Master Mix [57] | cDNA synthesis | High-efficiency reverse transcription |
| LongAmp Taq 2X Master Mix [57] | cDNA amplification | Amplifies long transcripts covering full gene |
| Nextera XT Library Prep Kit [57] | NGS library preparation | Fragments and tags long amplicons for sequencing |
The experimental workflow proceeds as follows:
- Sample Collection and RNA Isolation: Collect blood into Tempus Blood RNA Tubes for RNA stabilization. Isolate total RNA using the Tempus Spin RNA Isolation Kit [57].
- cDNA Synthesis and Amplification: Perform cDNA synthesis with SuperScript IV VILO Master Mix using 100ng of total RNA. Amplify the cDNA with long-range PCR using LongAmp Taq Master Mix with primers designed to flank 5' and 3' UTR regions of the targeted gene [57].
- Library Preparation and Sequencing: Quantify PCR products and prepare libraries using the Nextera XT transposome-based system, which fragments amplicons and adds universal adapters. Sequence the libraries on Illumina platforms (e.g., NextSeq 550) with paired-end reads [57].
- Bioinformatic Analysis: Align reads to the reference genome using STAR aligner. Identify splicing junctions from the alignment files and visualize with sashimi plots [57].
This approach has been successfully validated by detecting previously published normal splicing isoforms and identifying aberrant splicing caused by genetic variants in genes such as STK11 and NBN, leading to the reclassification of variants of uncertain significance [57]. The method can detect various splicing aberrations including exonic and intronic splice-site shifts, cryptic exon inclusion, and multiple exon skipping.
Targeted RNA-seq Splicing Detection Workflow
Analytical Considerations and Thresholds
For robust splicing detection, specific analytical thresholds must be implemented. In the targeted RNA-seq approach, junctions covered with a minimum of 20 reads and present in at least two samples are considered real splicing junctions, while those below this threshold are regarded as sequencing artifacts or biological outliers [57]. This approach achieved 95% detection of previously reported STK11 splicing junctions, with the missing junctions falling below the expression threshold [57].
For quantitative analysis of alternative splicing patterns, the percent spliced in (PSI) value serves as a key metric, representing the relative ratio of isoforms including a specific splicing junction or retained intron [55]. PSI values range from 0 to 1, with changes between conditions (dPSI) ranging from -1 to 1 [55]. Statistical significance for differential splicing is typically determined using Bayesian models or nonparametric tests, with confidence thresholds such as P(|ΔΨ| > C) where C represents the minimum change of interest [55].
Clinical and Therapeutic Applications
Splicing Aberrations in Disease
Splice-disruptive variants represent a critically important category of disease-causing mutations, contributing to a substantial fraction of rare genetic diseases and even some common disorders [16]. Recent estimates suggest that up to 15-30% of all disease-causing mutations may affect splicing, either by disrupting canonical splice sites, activating cryptic sites, or altering regulatory elements such as enhancers or silencers [16]. These disruptions can manifest through various mechanisms:
- Alternative Splice Site Usage: Variants that weaken canonical splice sites or create novel splice motifs can lead to usage of nearby cryptic 5' or 3' splice sites, resulting in exon elongation or truncation that potentially disrupts the open reading frame [16].
- Exon Skipping: Mutations affecting highly conserved GU or AG dinucleotides at canonical splice sites can abolish authentic RNA splicing, often resulting in exon skipping [16].
- Intron Retention: Disruption of splice site recognition can prevent intron removal, leading to retained introns in mature transcripts [16].
- Pseudoexon Inclusion: Deep-intronic mutations can create new splice sites that lead to the inclusion of previously non-coding intronic sequences as exonic content [16].
The clinical significance of these variants is particularly evident in neuromuscular disorders, where RNA mis-splicing has emerged as a frequent and therapeutically actionable disease mechanism [16]. Comprehensive quantitative analysis of alternative splicing variants has revealed significant changes in various cancer types, as demonstrated in HNF1B mRNA splicing patterns across tumour and non-tumour tissues [58].
RNA-Targeted Therapeutic Interventions
The therapeutic correction of splicing defects represents a promising approach for precision medicine. Several RNA-targeted therapies have received regulatory approval:
- Antisense Oligonucleotides (ASOs): Nusinersen, a splice-switching antisense oligonucleotide, dramatically improves outcomes in spinal muscular atrophy by correcting aberrant splicing of the endogenous SMN2 gene [16]. Similarly, eteplirsen, golodirsen, casimersen, and viltolarsen are FDA-approved ASOs that restore the reading frame of specific DMD gene mutations in Duchenne muscular dystrophy [16].
- Small Molecule Splicing Modulators: The RNA targeting small molecules therapeutics market has reached nearly $2.77 billion in 2024, with RNA splicing modification accounting for 66.76% of the market [59]. This segment is expected to grow at a compound annual growth rate of 7.06% during 2024-2029, highlighting the increasing therapeutic focus on splicing modulation [59].
- Emerging Technologies: CRISPR-Cas13 systems represent a novel approach for RNA editing, employing programmable CRISPR RNAs to edit or cleave target RNAs directly, enabling transient and reversible gene modulation without altering the DNA genome [60].
Therapeutic Splicing Intervention Pipeline
The field of high-throughput RNA sequencing for splicing detection continues to evolve rapidly, with several emerging trends shaping its future. Artificial intelligence and deep learning are revolutionizing RNA-targeted small molecule drug discovery, enabling more precise prediction of splicing outcomes and therapeutic effects [59]. Single-cell technologies are advancing to address current limitations in spatial transcriptomics and multi-omics integration, with methods like scASfind providing frameworks for cell type-specific splicing analysis [56]. The integration of personalized RNA therapeutics, precision RNA editing, and AI-driven design heralds a new era of individualized and adaptive therapies [60].
For researchers and drug development professionals, the current landscape offers unprecedented opportunities to connect splicing variations to protein diversity and function. The combination of robust experimental protocols like the targeted RNA-seq approach [57] with advanced computational tools such as MAJIQ v2 [55] and AS-Quant [53] provides a powerful toolkit for comprehensive splicing analysis. As these technologies continue to mature and integrate with therapeutic development pipelines, they promise to unlock new diagnostic and treatment modalities for a wide range of genetic disorders and diseases driven by splicing dysregulation.
In conclusion, high-throughput RNA sequencing strategies for splicing detection have transformed our understanding of transcriptome complexity and protein diversity. By leveraging both computational innovations and experimental advances, researchers can now systematically identify and characterize splicing variations across diverse biological contexts, opening new avenues for basic research and therapeutic development. The continuing evolution of these technologies promises to further illuminate the complex relationship between splicing regulation and proteomic diversity in health and disease.
Computational Tools for Alternative Splicing Identification and Quantification
Alternative splicing (AS) is a fundamental post-transcriptional regulatory mechanism that enables a single gene to generate multiple mRNA isoforms by selectively combining different exons and introns during pre-mRNA processing [61]. This process dramatically expands transcriptomic and proteomic diversity, with more than 95% of multi-exon human genes undergoing alternative splicing to produce an estimated 250,000 protein isoforms from approximately 25,000 genes [62]. The strategic inclusion or exclusion of coding sequences allows splice variants to acquire distinct functions, alter subcellular localization, or modify stability and interaction properties, positioning AS as a critical mechanism in development, cell differentiation, and tissue identity [63] [61].
The pervasive role of alternative splicing in human disease, particularly cancer and neurodegenerative disorders, has intensified the need for robust computational identification and quantification methods [64] [61]. High-throughput RNA sequencing (RNA-seq) has revolutionized our ability to profile splicing events transcriptome-wide, simultaneously driving the development of sophisticated computational tools that can detect both annotated and novel splicing events from complex sequencing data [62] [65]. This technical guide provides researchers with a comprehensive framework for selecting, implementing, and interpreting computational splicing analysis tools within the broader context of protein diversity mechanisms research.
Computational Methodologies for Splicing Analysis
Core Computational Approaches and Tool Categories
Computational methods for alternative splicing analysis employ distinct strategies for detecting and quantifying splicing events, each with particular strengths and limitations. These tools can be broadly categorized based on their underlying methodologies and the types of splicing events they detect.
Table 1: Computational Tool Categories and Methodologies
| Category | Representative Tools | Methodological Approach | Splicing Events Detected | Key Advantages |
|---|---|---|---|---|
| Exon-based / Transcript-based | rMATS [66], MISO [66], SplAdder [65] [66], ballgown [65] | Uses annotated transcriptomes to identify predefined splicing events; often employs generalized linear models | Exon skipping, alternative 5'/3' splice sites, mutually exclusive exons | High interpretability; simplified statistical testing; leverages existing annotations |
| De novo / Junction-based | LeafCutter [65], MAJIQ [66], SplAdder [65], ASPLI [65], SGSeq [65] | Identifies novel splicing events directly from RNA-seq reads without relying solely on annotations; uses junction reads and intron excision signals | Novel exons, novel splice junctions, intron retention, complex events | Discovers unannotated events; ideal for non-model organisms or disease states with extensive splicing dysregulation |
| PSI Quantification Frameworks | Bisbee [65], MAJIQ [66], rMATS [66] | Calculates Percent Spliced In (PSI or Ψ) values to quantify isoform ratios; employs beta-binomial models for differential testing | All detectable event types | Direct biological interpretation; robust to expression-level confounding; enables cross-study comparisons |
| Single-Cell Resolution | Seurat [67], scVelo [67] | Extends splicing analysis to single-cell RNA-seq data; often uses unspliced/spliced mRNA ratios | Cell-type-specific splicing, RNA velocity, developmental trajectories | Resolves cellular heterogeneity; links splicing dynamics to cell states |
Statistical Frameworks for Differential Splicing Analysis
Robust statistical methods are essential for distinguishing biologically meaningful splicing changes from technical variability. The beta-binomial model has emerged as a powerful framework implemented in tools like Bisbee and LeafCutter [65]. This approach models the proportion of reads supporting each isoform, where the binomial component captures technical noise from limited sequencing depth, while the beta distribution accounts for biological variability between replicates. Tools implementing this framework test for significant differences in PSI values between experimental conditions, with likelihood ratio tests often providing superior sensitivity and specificity compared to generalized linear models [65].
An alternative approach, percent spliced in (PSI) difference testing, directly quantifies the percentage of reads supporting a particular splice variant. For example, rMATS uses a hierarchical model to estimate the significance of PSI differences between groups, while accounting for uncertainty in isoform abundance estimates [66]. The interpretability of PSI values (ranging from 0% to 100%) makes this approach particularly valuable for translational research, as the magnitude of splicing change often correlates with functional impact.
Performance Benchmarking and Tool Selection
Experimental Performance Comparisons
Independent benchmarking studies provide critical guidance for tool selection in specific research contexts. A 2025 comparative analysis evaluated four major splicing tools (MAJIQ, rMATS, MISO, and SplAdder) using targeted RNA long-amplicon sequencing (rLAS) data with known splicing events [66]. The results demonstrated significant performance variations across tools and event types.
Table 2: Tool Performance Across Splicing Event Types [66]
| Splicing Tool | Exon Skipping Detection | Multiple Exon Skipping Detection | Alternative 5' Splice Site Detection | Alternative 3' Splice Site Detection | Overall Performance |
|---|---|---|---|---|---|
| MAJIQ | Detected 2/3 known events | Successfully detected | Successfully detected | Successfully detected | Best for diverse event types |
| rMATS | Detected 3/3 known events | Failed to detect | Failed to detect | Failed to detect | Optimal for exon skipping studies |
| MISO | Failed to detect | Failed to detect | Detected but with false positives | Detected but with false positives | Limited reliability |
| SplAdder | Failed to detect | Failed to detect | Failed to detect | Failed to detect | Poor performance in rLAS |
This benchmarking revealed that MAJIQ demonstrated the most consistent performance across diverse splicing event types, successfully detecting exon skipping, multiple exon skipping, and alternative 5'/3' splice sites [66]. In contrast, rMATS showed superior sensitivity for exon skipping events but failed to detect other event types, making it ideal for focused exon-centric studies. Both MISO and SplAdder showed limited detection capability in this targeted sequencing context, highlighting how experimental design influences tool performance [66].
Validation with Multi-Omics Data
Proteogenomic validation provides the most rigorous assessment of splicing tool predictions. The Bisbee package incorporates protein-level effect prediction and has been validated using matched RNA-seq and mass spectrometry data from normal human tissues [65]. In this validation framework, SplAdder identified 268,791 total splice events, of which 125,683 were predicted to be protein-coding by Bisbee. Mass spectrometry confirmation detected protein evidence for 1,587 events, with 1,082 generating novel protein sequences [65]. This integration of transcriptional and proteomic evidence establishes a "truth set" for benchmarking and underscores the importance of translational relevance in splicing analysis.
Experimental Design and Workflow Integration
Sequencing Technologies and Their Impact on Splicing Analysis
The choice of sequencing technology profoundly influences splicing detection capabilities. Short-read and long-read platforms offer complementary advantages for different research objectives.
Table 3: Sequencing Platform Comparison for Splicing Analysis [68]
| Feature | Short-Read (Illumina) | Long-Read (PacBio SMRT) | Long-Read (Oxford Nanopore) |
|---|---|---|---|
| Template | cDNA | cDNA | Native RNA or cDNA |
| Read Length | Short (50-300 bp) | Long (1-10 kb+) | Long (1-100 kb) |
| Base Accuracy | Very high (>99.9%) | Very high (HiFi reads 99.95%) | Moderate (~96%) |
| Isoform Resolution | Low to medium (reconstructed computationally) | High (full-length cDNA isoforms) | High (direct isoform-level resolution) |
| Quantitative Power | High | Moderate | Moderate |
| Best Applications | Differential splicing quantification, large cohort studies | Full-length transcript discovery, complex locus resolution | Direct RNA sequencing, epitranscriptomic integration |
Short-read Illumina sequencing remains the standard for large-scale differential splicing studies due to its high accuracy, depth, and cost-effectiveness [68]. However, long-read technologies enable complete isoform resolution without assembly, making them invaluable for characterizing complex splicing patterns and discovering novel isoforms, particularly in non-model organisms or poorly annotated genomic regions [68].
Complete Splicing Analysis Workflow
Diagram 1: Splicing analysis workflow. This end-to-end pipeline spans from sample preparation to functional validation, with color coding indicating process categories: yellow (wet lab), green (preprocessing), blue (core analysis), and red (validation).
Research Reagent Solutions for Splicing Analysis
Table 4: Essential Research Reagents and Tools
| Reagent/Tool | Function | Application Notes |
|---|---|---|
| SMARTer Technology | Full-length cDNA synthesis for long-amplicon sequencing | Essential for rLAS method; enables stable amplification of long transcripts [66] |
| Cell Ranger | Single-cell 3' and 5' gene counting | Processes 10X Genomics single-cell data; performs barcode processing and UMI counting [67] |
| Seurat | Single-cell RNA-seq analysis | Processes Cell Ranger outputs; enables clustering, visualization, and differential splicing in single cells [67] |
| PEAKS Software | Proteomics data analysis | Validates splicing events via mass spectrometry; identifies novel peptides from alternative isoforms [69] |
| HISAT2/STAR | RNA-seq read alignment | Maps sequencing reads to reference genome; STAR slightly better for junction reads, HISAT2 for overall mapping rate [66] |
| Integrative Genomics Viewer | Visual validation of splicing events | Manually inspect splicing events; essential for confirming computational predictions [66] |
Advanced Applications and Single-Cell Resolution
Single-Cell Alternative Splicing Analysis
The emergence of single-cell RNA sequencing (scRNA-seq) has enabled the investigation of splicing heterogeneity at cellular resolution. Specialized computational approaches have been developed to address the unique challenges of sparse single-cell data, including RNA velocity analysis that leverages the ratio of unspliced to spliced transcripts to infer developmental trajectories [67]. The scVelo Python package implements this approach using dynamical modeling to estimate future transcriptional states, revealing how splicing regulation contributes to cell fate decisions [67].
For differential splicing analysis across cell types, Seurat provides a framework for identifying cell-type-specific splicing events by comparing PSI values across clusters [67]. However, the technical limitations of scRNA-seq, particularly limited coverage per cell, necessitate careful experimental design and specialized statistical methods to distinguish true splicing variation from technical noise.
Integration with Multi-Omics Data
Integrative analysis of splicing with complementary data types provides unprecedented insights into regulatory mechanisms and functional consequences. Multi-omics integration approaches include:
Proteogenomics: Tools like PEAKS enable the identification of novel protein isoforms resulting from alternative splicing by integrating RNA-seq with mass spectrometry data [69]. This approach has confirmed that approximately 30% of tissue-specific splicing events produce detectable protein products, validating their functional relevance [65].
Regulatory Network Inference: Single-cell gene regulatory network analysis tools can link splicing factor expression with specific splicing outcomes, revealing how transcriptional and post-transcriptional regulation coordinates cell identity [67].
Epigenetic Integration: Methods like MultiVelo examine the temporal relationship between chromatin accessibility (scATAC-seq) and splicing dynamics, providing mechanistic insights into how epigenetic changes influence splice site selection [67].
Future Directions and Clinical Applications
Therapeutic Targeting of Splicing Mechanisms
The recognition of alternative splicing dysregulation in human disease has stimulated drug development efforts targeting splicing mechanisms. Several therapeutic strategies have emerged:
Small molecule splicing modulators that target core spliceosome components or regulatory splicing factors have shown efficacy in preclinical cancer models [61].
Antisense oligonucleotides designed to modulate specific splicing events have advanced to clinical trials for neurological disorders and are now being explored in oncology [61].
CRISPR-based approaches enable precise manipulation of splicing outcomes, with Cas13d-mediated isoform-specific knockdown providing a powerful tool for functional validation of splicing variants [64].
The development of these therapeutic modalities relies heavily on computational tools to identify disease-relevant splicing events, predict their functional consequences, and select optimal targets for intervention.
Emerging Computational Technologies
The field of computational splicing analysis continues to evolve rapidly, with several promising directions:
Deep learning approaches are being applied to predict splicing outcomes from sequence data, with models like APARENT and DeeReCT-PolyA demonstrating improved accuracy in identifying regulatory elements that influence splice site selection [62].
Multi-modal data integration frameworks that combine genomic, transcriptomic, and proteomic data will provide more comprehensive insights into the functional consequences of splicing variation.
Single-cell multi-omics technologies that simultaneously profile gene expression and splicing in the same cells will enable the construction of detailed regulatory maps linking splicing variation to cell identity and function.
As these technologies mature, computational tools for alternative splicing analysis will become increasingly integral to both basic research and translational applications, ultimately enabling precision medicine approaches that account for transcriptomic diversity in diagnosis and treatment.
AlphaFold2 and Structural Prediction of Splice Variants
The prediction of three-dimensional protein structures from amino acid sequences has long been a grand challenge in computational biology, intimately connected with understanding protein function and dynamics [70]. Until recently, experimentally determining protein structures through techniques like X-ray crystallography and cryo-electron microscopy remained time-consuming and resource-intensive, creating a significant gap between known protein sequences and solved structures [71]. The emergence of AlphaFold2 in 2020 represented a paradigm shift in this field, demonstrating unprecedented accuracy in protein structure prediction through an end-to-end deep learning approach that combines attention mechanisms, symmetry principles, and evolutionary information from multiple sequence alignments (MSAs) [70].
Parallel to these developments in structure prediction, the biological community has increasingly recognized the fundamental role of alternative splicing (AS) in generating proteomic diversity. In humans, approximately 95% of multi-exon genes undergo alternative splicing, potentially expanding the ~20,000 protein-coding genes to over 100,000 distinct protein products [3] [72]. This mechanism enables a single gene to produce multiple transcript isoforms through differential inclusion or exclusion of exons, significantly contributing to functional complexity in higher eukaryotes [73] [30]. Alternative splicing is not merely a stochastic process but is tightly regulated during development, tissue differentiation, and in response to cellular signals, with dysregulation implicated in numerous diseases including cancer, neurological disorders, and genetic conditions [3] [2].
Despite the biological significance of alternative splicing, structural biology has historically focused on single "reference" isoforms, leaving a critical gap in our understanding of how splicing-induced sequence variations affect protein structure and function. This technical guide explores the intersection of these two fields, examining how AlphaFold2 enables large-scale structural prediction of splice variants and the insights these predictions provide into protein diversity mechanisms.
AlphaFold2: Technical Foundations and Methodological Advances
Core Architectural Innovations
AlphaFold2 represents a fundamental departure from previous protein structure prediction methods through its integrated, end-to-end differentiable architecture. Several key innovations underpin its remarkable performance:
Attention Mechanisms and Transformers: Unlike earlier approaches that relied on statistical potentials or fragment assembly, AlphaFold2 utilizes attention mechanisms to capture long-range dependencies in protein sequences and structures. This enables the model to reason about residues distant in sequence but proximate in folded structure [70].
Equivariance Principles: The system incorporates rotational and translational symmetry constraints, facilitating reasoning over protein structures in three dimensions. This equivariance ensures that fundamental physical properties of proteins are respected throughout the prediction process [70].
End-to-End Differentiability: The entire architecture is designed as a unified, differentiable framework for learning from protein data, enabling efficient training and refinement through gradient-based optimization techniques [70].
Evolutionary Scale Information: AlphaFold2 leverages co-evolutionary patterns captured through multiple sequence alignments (MSAs), allowing the model to infer structural constraints from homologous sequences [70] [71].
Input Representation and Information Processing
The input to AlphaFold2 consists of two primary components: the target amino acid sequence and evolutionary information derived from multiple sequence alignments. The system processes this information through several specialized modules:
Embedded Representations: Sequence and MSA information are transformed into embedded representations that capture both positional and relational information.
Evoformer Module: This core component processes the MSA representations, extracting co-evolutionary signals and refining pair-wise relationships between residues.
Structure Module: The processed representations are converted into atomic coordinates, specifically predicting the positions of backbone atoms and side chain rotamers.
The entire process is guided by confidence estimates through predicted Local Distance Difference Test (pLDDT) scores, which provide per-residue estimates of prediction reliability [74] [72].
Table 1: Key Components of the AlphaFold2 Architecture
| Component | Function | Innovation |
|---|---|---|
| Evoformer | Processes MSA and pair representations | Extracts co-evolutionary signals through attention |
| Structure Module | Generates 3D atomic coordinates | Implements equivariant transformations |
| Template Module | Incorporates known structural templates (optional) | Enhances predictions for homologous proteins |
| Recycling | Iterative refinement of predictions | Improves accuracy through multiple passes |
Methodological Framework for Predicting Splice Variant Structures
Computational Pipeline for Isoform Structure Prediction
The prediction of splice variant structures using AlphaFold2 requires specialized methodological considerations to address the unique challenges posed by alternative splicing. The following workflow has been established in recent large-scale studies [74] [72]:
Figure 1: Computational workflow for predicting splice variant structures using AlphaFold2
Specialized Considerations for Splice Variants
Predicting structures for alternatively spliced isoforms presents unique challenges that require methodological adaptations:
Sequence Filtering: Practical considerations often necessitate filtering isoforms to a maximum length of 600 amino acids to maintain computational feasibility in large-scale studies [72].
MSA Depth Variation: Alternatively spliced regions, particularly "replaced" exons unique to specific isoforms, typically exhibit lower MSA depth compared to constitutively spliced regions, potentially affecting prediction quality [74] [72].
Confidence Calibration: pLDDT scores for alternative splicing regions are generally lower than for constitutive regions, reflecting the reduced evolutionary information available for isoform-specific sequences [72].
Reference Comparison: Predictions for alternate isoforms are typically compared against reference isoform structures to identify splicing-induced structural alterations [72].
Table 2: Structural Metrics for Analyzing Splice Variant Predictions
| Metric | Description | Structural Property Assessed |
|---|---|---|
| Template Modeling Score (TM-score) | Global structural similarity | Overall fold conservation |
| Root Mean Square Deviation (RMSD) | Average distance between equivalent atoms | Local structural deviations |
| Radius of Gyration | Measure of protein compactness | Global structural compactness |
| Secondary Structure Composition | Proportion of α-helices, β-sheets | Local structural features |
| Surface Charge Distribution | Electrostatic potential on protein surface | Functional surface properties |
| PTM Site Accessibility | Solvent accessibility of modification sites | Potential regulatory consequences |
Validation and Benchmarking Approaches
Establishing confidence in predicted splice variant structures requires specialized validation strategies:
Experimental Benchmarking: When available, comparison with experimentally determined isoform structures from the Protein Data Bank provides the most direct validation. Studies have demonstrated that AlphaFold2 predictions match experimentally determined structures equally well for both reference and alternate isoforms, with no significant difference in TM-score and RMSD between them [72].
MSA Depth Correlation: Monitoring the relationship between MSA depth and pLDDT scores helps identify regions where predictions may be less reliable due to limited evolutionary information [72].
Differential Analysis: Focusing on structural differences between isoforms that exceed the expected error rate of predictions provides confidence that observed variations are biologically meaningful rather than artifacts of prediction uncertainty [74].
Key Findings: Structural Consequences of Alternative Splicing
Quantitative Assessment of Splicing-Induced Structural Changes
Large-scale structural predictions of splice variants have revealed several fundamental principles governing the relationship between alternative splicing and protein structure:
Sequence-Structure Relationship: Structural similarity between isoforms largely correlates with sequence identity, but a significant subset of isoforms (approximately 10-15%) exhibit low structural similarity despite high sequence similarity, suggesting that small sequence changes can sometimes produce dramatic structural consequences [72].
Splicing Type and Structural Impact: Exon skipping and alternative last exons tend to produce more substantial structural alterations compared to alternative splice site usage, with characteristic increases in surface charge and radius of gyration [72].
Domain Architecture Alterations: Alternative splicing frequently affects structured domains, with consequences including complete domain loss, partial domain truncation, or alterations to inter-domain linkers that affect relative domain orientations [74].
Table 3: Structural Impact by Alternative Splicing Type
| Splicing Type | Frequency in Humans | Common Structural Consequences |
|---|---|---|
| Exon Skipping | ~30% (most common in vertebrates) | Domain truncation, surface charge alteration |
| Alternative 5'/3' Splice Sites | ~25% | Subtle backbone rearrangements, loop alterations |
| Intron Retention | ~10% (more common in plants) | Structural disorder, elongated regions |
| Mutually Exclusive Exons | Variable | Domain substitution, functional site alteration |
Functional Implications of Structural Alterations
The structural changes induced by alternative splicing have diverse functional consequences:
Post-Translational Modification (PTM) Sites: Splicing can bury or expose numerous PTM sites, potentially altering regulatory networks. For example, among isoforms of BAX, alternative splicing significantly changes the accessibility of phosphorylation sites with implications for apoptosis regulation [72].
Ligand Binding and Enzyme Activity: Structural alterations frequently affect active sites, binding pockets, and protein-protein interaction interfaces, leading to functional diversification. Structure-based function prediction suggests numerous functional differences among isoforms of the same gene, with loss of function compared to the reference being predominant [72].
Subcellular Localization: Changes in surface properties or the introduction/removal of localization signals can redirect isoforms to different cellular compartments, as observed in various signaling proteins [74].
Cell-Type Specific Expression of Structural Variants
Integrating structural predictions with single-cell RNA-sequencing data from resources like the Tabula Sapiens reveals that structurally distinct isoforms are frequently expressed in cell-type-specific patterns, suggesting specialized functional adaptations across tissues [72]. This intersection of structural bioinformatics with cellular biology provides unprecedented resolution for understanding how splicing-generated structural diversity contributes to cellular specialization.
Table 4: Key Research Resources for Splice Variant Structure Analysis
| Resource/Reagent | Type | Function/Application |
|---|---|---|
| AlphaFold Protein Structure Database | Database | Repository of pre-computed AlphaFold2 predictions for reference proteomes |
| SpliceVarDB | Database | Comprehensive database of experimentally validated splice-altering variants [75] |
| UniProt/SwissProt | Database | Curated protein sequence and annotation resource for isoform information |
| rMATS | Software Tool | Detection of differential alternative splicing from RNA-seq data [76] |
| Tabula Sapiens | Data Resource | Single-cell transcriptome atlas for cell-type-specific isoform expression |
| ColabFold | Software Tool | Accessible implementation of AlphaFold2 for custom predictions |
| PDBe-KB | Database | Structural annotations and functional predictions for PDB and AlphaFold-DB models |
Experimental Design and Protocol Guidance
Protocol for Comparative Structural Analysis of Isoforms
For researchers investigating specific genes of interest, the following protocol provides a framework for comparative structural analysis of splice variants:
Isoform Sequence Retrieval:
- Source all annotated protein isoforms for the target gene from UniProt/SwissProt
- Record canonical sequence identifiers and variant annotations
- Extract sequences in FASTA format for structure prediction
Structure Prediction:
- Submit sequences to AlphaFold2 via ColabFold or local installation
- Ensure consistent settings across all predictions
- Download resulting PDB files and confidence metrics
Structural Alignment and Comparison:
- Perform global structural alignment using TM-align or similar tools
- Calculate RMSD for equivalent regions
- Identify structurally variable regions (SVRs)
Functional Annotation:
- Map known functional sites (active sites, binding interfaces, PTM sites)
- Assess the structural environment of these sites in each isoform
- Predict functional consequences of observed structural differences
Validation and Experimental Design:
- Design constructs for biochemical validation based on predicted structural differences
- Prioritize isoforms with largest predicted structural variations for functional characterization
Interpretation Guidelines and Caveats
When interpreting predicted structures of splice variants, several important considerations should guide analysis:
Confidence Thresholding: Exercise caution when interpreting regions with pLDDT scores below 70, particularly in isoform-specific segments with low MSA depth [72].
Dynamics Considerations: Remember that static structures may not capture conformational flexibility or induced fit mechanisms that could differ between isoforms.
Context Limitations: Be aware that single-chain predictions may not reflect behavior in complexes or with post-translational modifications that could modulate structural differences.
Future Directions and Clinical Applications
Therapeutic Opportunities from Splice Variant Structures
The structural characterization of splice variants opens several promising therapeutic avenues:
Cancer Immunotherapy: Aberrant splicing in tumors generates novel immunogenic peptides with substantially broader patient applicability than mutation-derived neoantigens (50.94% vs 4.40% population coverage in hepatocellular carcinoma) [76]. Structure-based design of vaccines targeting these neoantigens has demonstrated significant tumor regression in proof-of-concept studies [76].
Splice-Switching Therapies: High-resolution structural information can guide the development of antisense oligonucleotides or small molecules that modulate splicing decisions, particularly for diseases caused by splicing defects [2].
Isoform-Specific Drug Design: Structural differences between isoforms can be exploited to develop isoform-selective inhibitors with improved therapeutic indices, potentially reducing off-target effects [2].
Technological Frontiers
Emerging methodologies promise to further advance the integration of structural prediction with alternative splicing research:
AlphaFold-Multimer: Applications to characterize differences in protein-protein interaction networks between isoforms [72].
Single-Cell Proteomics: Integration with emerging technologies to validate isoform expression at the protein level in specific cell types.
Dynamics Prediction: Combination with molecular dynamics simulations to understand how splicing affects protein flexibility and conformational landscapes.
The integration of AlphaFold2 with alternative splicing research has created a powerful paradigm for exploring protein structural diversity at unprecedented scale. Methodological frameworks for predicting and analyzing splice variant structures are now established, providing researchers with robust approaches for investigating isoform-specific structural and functional properties. The findings from initial large-scale studies demonstrate that alternative splicing induces diverse structural consequences with significant functional implications, from altered enzymatic activity to redirected cellular localization. As these methodologies continue to mature and integrate with emerging experimental techniques, they promise to deepen our understanding of protein diversity mechanisms and open new avenues for therapeutic intervention in splicing-related diseases.
Single-Cell RNA Sequencing for Cell-Type-Specific Splicing Patterns
Alternative splicing (AS) is a fundamental regulatory mechanism in messenger RNA (mRNA) processing that enables a single gene to produce multiple transcript isoforms, greatly expanding the functional diversity of the proteome [56]. In humans, more than 95% of multi-exon genes undergo alternative splicing, yielding over 300,000 isoforms from approximately 24,000 protein-coding genes [77]. While bulk RNA sequencing has revealed tissue-regulated AS patterns, it masks cell-to-cell heterogeneity. Single-cell RNA sequencing (scRNA-seq) now enables researchers to dissect this heterogeneity at unprecedented resolution, revealing that splicing patterns can define cell identities and states with precision sometimes surpassing conventional gene expression analysis [56]. This technical guide explores computational frameworks, experimental methodologies, and analytical approaches for investigating cell-type-specific splicing patterns, positioning this emerging field within the broader thesis of alternative splicing and protein diversity mechanisms research.
Computational Frameworks for Splicing Analysis at Single-Cell Resolution
Methodological Landscape and Key Algorithms
The high sparsity, technical noise, and limited coverage of scRNA-seq data present unique computational challenges for splicing analysis. Several specialized algorithms have been developed to address these limitations through different statistical approaches and imputation strategies.
Table 1: Computational Methods for Single-Cell Splicing Analysis
| Method | Core Approach | Splicing Events Supported | Key Features | Limitations |
|---|---|---|---|---|
| SCASL [78] | Spectral clustering based on AS probability matrix with iterative KNN imputation | Alternative 3'/5' splice sites | Cluster cells based on splicing landscapes without pre-defined labels; Identifies novel cell identities | Limited to alternative 3'/5' splice sites |
| SCSES [77] | Data diffusion using cell and event similarity networks | SE, A3SS, A5SS, RI, MXE | Comprehensive event coverage; Multiple imputation strategies for different dropout scenarios | Complex parameter optimization |
| Psix [79] | Probabilistic model with autocorrelation approach | Exon skipping | Identifies splicing changes across continuous cell states without clustering; Robust to low mRNA capture | Primarily focused on exon skipping events |
| scASfind [56] | Data compression and exhaustive pattern search | All node-based types through Whippet | No imputation; Fast pattern matching; Identifies complex multi-exon events | Requires cell pooling; Dependent on initial cell typing |
| ELLIPSIS [80] | Splice graph construction with local read coverage utilization | Novel and annotated events | Detects novel splicing events; Conserves splicing flow; Handles uneven coverage | Computationally intensive for large datasets |
Technical Considerations for Method Selection
The choice of computational method depends on experimental design, biological questions, and data quality. SCASL demonstrates particular strength in identifying novel cell clusters based solely on splicing landscapes, successfully revealing potentially precancerous states in triple-negative breast cancer and developmental transitions in embryonic liver that were not apparent from gene expression analysis [78]. SCSES employs a sophisticated diffusion-based imputation that outperforms other methods in recovering accurate Percent Spliced-In (Ψ) values, achieving higher Spearman correlation coefficients with bulk RNA-seq benchmarks compared to BRIE, Expedition, Psix, and SCASL [77]. For continuous biological processes such as development or differentiation, Psix offers advantage through its cluster-free approach that identifies splicing changes correlated with transcriptional similarity without requiring discrete cell groupings [79].
Experimental Design and Protocol Specifications
Technology Selection: Full-Length vs. 3'-End Protocols
Investigation of splicing patterns requires specific scRNA-seq technologies that provide sufficient coverage across transcript bodies:
- Full-length transcript protocols: SMART-seq2 [56], Smart-seq3 [56], RamDA-seq [81], and VASA-seq [56] provide complete transcript coverage essential for splicing analysis. These methods enable quantification of splicing events across entire transcripts but typically profile fewer cells at higher cost.
- 3'-end droplet-based protocols: 10X Genomics Chromium and inDrop-seq are generally unsuitable for comprehensive splicing analysis as they capture only the 3' ends of transcripts, providing limited information about splice junctions [77] [56].
- Emerging multimodal approaches: ScISOr-ATAC simultaneously profiles splicing and chromatin accessibility in the same single cells, enabling investigation of regulatory relationships between chromatin state and splicing decisions [82].
Library Preparation and Sequencing Considerations
- Sequencing depth: Aim for minimum of 50,000-100,000 reads per cell with balanced exonic coverage
- Read length: Paired-end reads of sufficient length (75bp+) to confidently map across splice junctions
- Molecular identifiers: Incorporate Unique Molecular Identifiers (UMIs) to distinguish technical duplicates from biological isoforms
- Enrichment strategies: For targeted investigations, enrichment panels can increase coverage of specific splice events (e.g., 79-83% on-target rate achieved in neuronal studies [82])
Quality Control Metrics for Splicing Analysis
- Junction reads per cell: Minimum threshold of 1,000-5,000 junction-spanning reads per cell
- Gene detection: Correlation between genes detected and junction abundance
- Coverage uniformity: Assess evenness of coverage across transcript bodies
- Spike-in controls: Consider using spike-in transcripts with known splice variants to quantify technical variability [79]
Visualization and Interpretation of Splicing Heterogeneity
Specialized Tools for Splicing Data Visualization
Millefy addresses the unique challenges of visualizing splicing heterogeneity by displaying read coverage of all individual cells simultaneously as a heat map aligned with genomic annotations [81]. This approach enables researchers to identify local region-specific heterogeneity that might be masked in global analyses. The tool dynamically reorders cells based on diffusion maps applied to read coverage matrices, revealing patterns of heterogeneity in transcribed regions including antisense RNAs, 3' UTR lengths, and enhancer RNA transcription [81].
Integration with Multi-Omics Data
Advanced multimodal approaches now enable simultaneous profiling of splicing with other molecular layers. The ScISOr-ATAC method simultaneously measures gene expression, splicing, and chromatin accessibility in the same individual cells [82]. This has revealed that splicing patterns can differ between chromatin-transcriptome coupled and decoupled states within the same cell type, suggesting that these epigenetic states represent a hidden variable that should be considered in splicing analyses [82].
Diagram 1: Multi-omics integration workflow for splicing analysis.
Applications and Biological Insights
Cell Type Identification and Marker Discovery
Splicing events can serve as more precise markers of cell identity than gene expression alone. In neuronal tissues with complex cell type taxonomy, splicing markers demonstrated higher F1 scores for cell type identification compared to expression-based markers [56]. For example, in mouse cortex and embryonic development datasets, splicing nodes consistently outperformed gene expression markers in precision and recall for classifying cell types [56].
Developmental Biology and Lineage Tracing
SCASL has successfully recovered transitional stages during hepatocyte and cholangiocyte lineage development in embryonic liver, revealing splicing heterogeneity that corresponds to developmental progression [78]. Similarly, in mouse brain development, Psix identified exons whose alternative splicing patterns clustered into modules of coregulation, enriched for binding by distinct neuronal splicing factors [79].
Disease Mechanisms and Biomarker Discovery
In cancer biology, splicing heterogeneity provides insights into tumor progression and therapeutic resistance. SCASL application to triple-negative breast cancer defined clear cell subtypes indicating precancerous transformation of epithelial cells and early-stage tumor cells not discernible from gene expression alone [78]. In glioblastoma, ELLIPSIS revealed differential splicing patterns between tumor core cells and infiltrating cancer cells, with affected genes linked to cell movement, shape, and microenvironment interaction [80].
Population-scale single-cell studies have identified cell-type-specific genetic regulation of splicing relevant to autoimmune diseases. The Asian Immune Diversity Atlas revealed 11,577 independent cis-splicing Quantitative Trait Loci (sQTLs) and 607 trans-sQTLs across 19 peripheral blood mononuclear cell subtypes, many specific to particular cell types and associated with autoimmune disease risk [83].
Research Reagent Solutions and Experimental Materials
Table 2: Essential Research Reagents for Single-Cell Splicing Studies
| Reagent/Resource | Function | Example Applications | Technical Considerations |
|---|---|---|---|
| Full-length scRNA-seq kits (SMART-seq2/3) | Comprehensive transcript coverage | Splicing analysis across entire transcripts | Higher cost per cell; Lower throughput |
| Multimodal kits (ScISOr-ATAC, 10X Multiome) | Simultaneous profiling of splicing + chromatin | Regulatory mechanism studies | Computational complexity for integration |
| Enrichment panels (Agilent) | Targeted capture of specific splice junctions | Focused studies on disease-relevant genes | 79-83% on-target efficiency achieved [82] |
| Spike-in RNA controls | Technical variance quantification | Normalization and quality assessment | Essential for distinguishing technical artifacts |
| Reference annotations (GTF/BED files) | Splice junction identification | All splicing quantification methods | Should include novel junctions discovered in data |
| Single-cell clustering reagents | Cell type identification | Pre-requisite for some methods (scASfind) | Antibody panels for surface protein expression |
Implementation Workflow and Best Practices
Diagram 2: End-to-end workflow for single-cell splicing analysis.
Step-by-Step Implementation Guide
Experimental Design Phase
- Select appropriate scRNA-seq platform based on coverage needs and budget
- Include biological replicates and control samples
- Plan for sufficient sequencing depth (minimum 50,000 reads/cell with junction coverage)
Wet Laboratory Procedures
- Utilize full-length transcript protocols (SMART-seq2/3, RamDA-seq)
- Incorporate UMIs to address PCR amplification biases
- Consider spike-in controls for technical variance quantification
Computational Analysis
- Align reads with splice-aware aligners (STAR, HISAT2)
- Quantify splicing events using specialized tools (SCSES, SCASL, Psix)
- Apply appropriate imputation strategies for sparse data
- Perform cell clustering based on splicing landscapes
Biological Validation
- Confirm key findings with orthogonal methods (RT-PCR, nanoreporter assays)
- Utilize minigene assays for sQTL validation [83]
- Correlate with protein-level data when possible
Troubleshooting Common Challenges
- Low junction coverage: Increase sequencing depth; use targeted enrichment approaches
- Technical artifacts: Implement rigorous quality control; use spike-in controls
- Sparse data matrices: Select appropriate imputation method (SCSES for comprehensive events, SCASL for alternative 3'/5' sites)
- Cell type identification: Consider splicing-based clustering when expression-based clustering provides ambiguous results
Single-cell RNA sequencing for cell-type-specific splicing patterns represents a maturing field that adds a critical dimension to transcriptomic analysis. The integration of computational innovation with experimental advances now enables researchers to move beyond gene expression to investigate the regulatory programs underlying splicing heterogeneity. As methods continue to evolve—particularly through multimodal integration and population-scale studies—our understanding of how splicing diversity contributes to cellular identity, developmental processes, and disease mechanisms will deepen. This expanding knowledge base promises to reveal new therapeutic opportunities targeting splicing dysregulation in cancer, neurological disorders, and autoimmune diseases, ultimately advancing the broader thesis of alternative splicing as a fundamental mechanism governing protein diversity and cellular function.
Mass Spectrometry Approaches for Proteomic Validation of Splice Variants
Alternative splicing (AS) is a fundamental mechanism that enables a single gene to produce multiple mRNA transcripts, and subsequently, multiple distinct protein isoforms [84]. In humans, it is estimated that over 95% of multi-exon genes undergo alternative splicing, dramatically expanding the functional complexity of the proteome [84] [85]. These protein isoforms can differ in structure, localization, and function, and their dysregulation has been implicated in numerous diseases, including cancer and neurodegenerative disorders [85] [86]. While RNA sequencing (RNA-seq) can identify splice variants at the transcript level, evidence of translation into stable proteins is essential for understanding their biological significance [84] [85]. Mass spectrometry (MS)-based proteomics has emerged as the premier technology for the definitive detection and validation of protein splice variants, bridging the gap between transcriptomic discovery and functional proteomic confirmation [87] [88].
Core Mass Spectrometry Technologies for Splice Variant Detection
The two primary MS-based strategies for identifying protein isoforms are Bottom-Up Proteomics (BUP), which analyzes protein digests, and Top-Down Proteomics (TDP), which analyzes intact proteins. The choice of strategy profoundly influences the depth and confidence of splice variant detection.
Table 1: Comparison of Bottom-Up and Top-Down Proteomics for Splice Variant Analysis
| Feature | Bottom-Up Proteomics (BUP) | Top-Down Proteomics (TDP) |
|---|---|---|
| Analytical Unit | Peptides from digested proteins | Intact proteins and proteoforms |
| Sequence Coverage | Variable; can be increased with multi-protease strategies [88] | Inherently 100% for the detected proteoform |
| Isoform Resolution | Indirect; requires inference from peptides [87] | Direct; provides full protein sequence [87] |
| Key Strength | High sensitivity and proteome depth; well-established workflows | Unambiguous identification of combined splice variants and PTMs [87] |
| Primary Limitation | Inference challenges for complex splicing; may miss connections between distant peptide variations [87] | Limited throughput and sensitivity for high-mass proteins [87] [88] |
| Throughput | High | Moderate to Low |
Advancing Bottom-Up Proteomics through Deep Sequencing
Standard BUP experiments typically identify proteins using a small subset of their peptides, resulting in low sequence coverage that is insufficient to distinguish between alternative isoforms [88]. However, recent advances using multi-protease digestion and extensive fractionation have demonstrated that dramatically higher coverage is achievable. A landmark 2023 study utilized six different proteases (LysC, LysN, AspN, chymotrypsin, GluC, and trypsin) on six human cell lines, followed by extensive fractionation and multiple fragmentation methods [88]. This "deep proteome sequencing" approach identified 17,717 protein groups with a median sequence coverage of ~80%, enabling a global assessment of splice variants and genetic variants at the protein level [88]. This resource provides direct evidence for the translation of a substantial fraction of frame-preserving alternative splicing events, with detection rates for exon-exon junction peptides representing alternative splicing being comparable to those of constitutive junctions for highly covered proteins [88].
Proteogenomic Workflows for Splice Variant Validation
Proteogenomics, the integration of genomic and proteomic data, provides a powerful framework for the discovery and validation of novel splice variants. The typical workflow involves using RNA-seq data to predict protein sequences, which are then used to create custom databases for searching MS data.
The Splicify Pipeline: A Differential Analysis Tool
The Splicify pipeline is a specialized proteogenomic method designed to identify differentially expressed protein isoforms between two conditions (e.g., disease vs. control, or gene knock-down vs. control) [85]. Its methodological novelty lies in its comparative design, which moves beyond simple identification to functional association. The protocol involves:
- Experimental Perturbation: Transfert cells (e.g., SW480 colorectal cancer cells) with siRNA targeting a splicing factor of interest (e.g., SF3B1 or SRSF1) and a non-targeting (siNT) control pool [85].
- Parallel Multi-Omic Data Generation:
- Bioinformatic Analysis:
- Isoform Quantification: Use RNA-seq data to perform quantitative isoform analysis and identify differentially expressed splice variants between conditions.
- Custom Database Construction: Translate the identified splice variants into in-silico predicted protein sequences.
- Peptide Confirmation: Search the LC-MS/MS data against the custom database to confirm the translation of the predicted variants into proteins [85].
This pipeline successfully identified hundreds of differentially expressed isoforms upon knockdown of SF3B1 and SRSF1, including known variants like RAC1b, demonstrating its utility for uncovering clinically relevant biomarkers [85].
The following diagram illustrates the logical workflow and data integration points of the Splicify pipeline:
SpliceVista: A Tool for Visualization and Detection
SpliceVista is a tool designed to address the visualization gap in proteogenomics [89]. It maps MS-identified peptides to gene structures and splice variants, providing a visual representation of the exon composition of each variant and the precise alignment of identified peptides. If quantitative MS data is available, it can plot and cluster the quantitative patterns of peptides, enabling the identification of splice-variant-specific peptides and revealing instances where different isoforms from the same gene are differentially regulated—a finding often obscured in standard protein-centric or gene-centric analyses [89].
Critical Experimental and Analytical Considerations
Proteogenomic Database Construction
A critical step in any proteogenomic workflow is the construction of a customized protein sequence database from RNA-seq data [87]. This database should include sequences of novel splice variants, which can be derived from tools that analyze RNA-seq data to predict alternative splicing events. Searching MS/MS spectra against this customized database allows for the identification of variant-specific peptides that are not present in standard reference protein databases [87] [86]. This approach has been successfully used to identify hundreds of novel peptides in disease contexts like Alzheimer's disease, pointing to new potential biomarkers [86].
The Multi-Enzyme Strategy for Comprehensive Coverage
As demonstrated by the deep proteome sequencing study, using multiple proteases is key to achieving high sequence coverage [88]. While trypsin is the workhorse of proteomics, it leaves gaps in sequence coverage. Supplementing it with other proteases like LysC, LysN, AspN, chymotrypsin, and GluC generates overlapping peptide sequences that cover nearly the entire proteome, dramatically increasing the likelihood of detecting peptides unique to specific splice variants [88].
Table 2: Proteases for Enhanced Coverage in Bottom-Up Proteomics
| Protease | Cleavage Specificity | Role in Splice Variant Detection |
|---|---|---|
| Trypsin | C-terminal to Lys and Arg | Standard protease; provides the foundational dataset. |
| LysC | C-terminal to Lys | Complementary to trypsin; improves coverage of lysine-rich regions. |
| LysN | N-terminal to Lys | Generates peptides with different fragmentation patterns; improves sequence coverage. |
| AspN | N-terminal to Asp and Cys | Cleaves at less frequent residues, producing longer peptides for extended coverage. |
| Chymotrypsin | C-terminal to Phe, Trp, Tyr, Leu | Broad specificity; generates overlapping peptides for regions with few tryptic sites. |
| GluC | C-terminal to Glu and Asp (under specific conditions) | Further expands coverage, particularly in acidic residue-rich regions. |
Addressing the Missing Value Problem in Quantitative Proteomics
Label-free quantification (LFQ) proteomics data often contain a high fraction of missing values, which can complicate the statistical analysis of splice variant expression across samples [90]. Single imputation (SI) methods that borrow information from correlated proteins, such as Generalized Ridge Regression (GRR), Random Forest (RF), local least squares (LLS), and Bayesian Principal Component Analysis (BPCA), have been shown to estimate missing protein abundance values with good accuracy and are often used in practice [90]. While multiple imputation (MI) methods are statistically preferred to account for uncertainty, they remain computationally challenging for high-dimensional proteomics data [90].
The Scientist's Toolkit: Essential Research Reagents and Materials
Successful proteomic validation of splice variants relies on a suite of specialized reagents and computational tools.
Table 3: Key Research Reagent Solutions for Splice Variant Proteomics
| Reagent / Tool | Function | Application Note |
|---|---|---|
| siRNA Pools (e.g., siGENOME SMARTpool) | Targeted knockdown of splicing factors (e.g., SF3B1, SRSF1) to perturb splicing and identify regulated events [85]. | Enables creation of a controlled system for differential analysis of splicing. |
| TruSeq Stranded mRNA LT Kit | Preparation of cDNA libraries for RNA-seq from total RNA [85]. | Provides the transcriptomic data required for custom database construction. |
| Multiple Proteases (LysC, LysN, AspN, etc.) | Digest proteins at different amino acid residues to maximize protein sequence coverage [88]. | Critical for detecting splice-variant-specific peptides that may be missed by trypsin alone. |
| High-Resolution Mass Spectrometer (Orbitrap Tribrid) | Provides high-mass-accuracy MS1 and MS/MS data for peptide identification and quantification. | Essential for deep, confident identification of variant peptides. |
| Splicify Pipeline | A bioinformatic pipeline for differential analysis of alternative splicing from RNA-seq and MS data [85]. | Publicly available on GitHub for automated, user-friendly analysis. |
| SpliceVista | A tool for visualization and detection of splice variants in shotgun proteomics data [89]. | Enables visual confirmation of peptide mapping to specific exon structures. |
| PTM-POSE | A Python-based tool to project post-translational modification (PTM) sites onto splice variants [18]. | For investigating the interplay between splicing and PTMs, which can alter isoform function. |
Mass spectrometry-based proteomics, particularly when integrated with genomic data in a proteogenomic framework, provides an indispensable and powerful approach for validating the existence of splice variants at the protein level. While bottom-up proteomics remains the most widely deployed method, emerging strategies—including multi-protease deep sequencing and top-down proteomics—are steadily overcoming historical limitations in sequence coverage and isoform resolution. The continued development of specialized computational tools and pipelines for differential analysis, visualization, and functional annotation will further empower researchers to move beyond mere cataloging and toward a deeper understanding of the functional impact of alternative splicing on proteome diversity in health and disease.
Genome-Wide Annotation of Splice-Disruptive Variants
The accurate annotation of splice-disruptive variants (SDVs) represents a critical frontier in genomics, bridging the gap between genetic variation and its functional consequences on protein diversity. Splice-disruptive variants are defined as genetic alterations that interfere with the normal process of pre-mRNA splicing, leading to aberrant transcript isoforms [16]. Current research indicates that 15-30% of all disease-causing mutations may affect splicing through various mechanisms, including disruption of canonical splice sites, activation of cryptic sites, or alteration of regulatory elements [16]. The clinical significance of these variants is profound, with demonstrated roles in monogenic disorders, complex diseases, and cancer pathogenesis [16] [2] [91].
As genomic medicine shifts from phenotype-first to genome-first paradigms, the systematic identification and interpretation of SDVs has become increasingly important for diagnostic yield improvement and therapeutic development [16]. This technical guide provides a comprehensive framework for genome-wide SDV annotation, integrating current computational prediction tools, experimental validation methodologies, and clinical interpretation guidelines within the broader context of alternative splicing research and protein diversity mechanisms.
Molecular Mechanisms of Splicing and Disruption
Fundamentals of RNA Splicing
Pre-mRNA splicing is an essential eukaryotic process that removes introns and ligates exons to generate mature transcripts, dramatically expanding proteomic diversity from a limited set of genes. This process is orchestrated by the spliceosome, a massive ribonucleoprotein complex composed of five small nuclear ribonucleoproteins (U1, U2, U4, U5, and U6) and numerous associated proteins [16]. Accurate splice site recognition depends on conserved cis-acting elements: the 5' splice site (donor site), the branch point sequence (BPS), the polypyrimidine tract (PPT), and the 3' splice site (acceptor site) [16].
The exon definition model posits that splice sites flanking an exon are cooperatively recognized as a functional unit, with U1 and U2 snRNPs functioning cooperatively and context-dependently to regulate exon usage [16]. This coordination is influenced by genomic features (exon size, intron length) and transcriptional kinetics, with RNA polymerase II elongation rates affecting co-transcriptional splicing by altering temporal availability of splice sites and splicing factor recruitment [16].
Mechanisms of Splicing Disruption
Genetic variants can disrupt normal splicing through multiple mechanisms, which can be categorized as follows:
- Canonical Splice Site Disruption: Variants affecting the highly conserved GU (donor) or AG (acceptor) dinucleotides, typically resulting in complete abolition of authentic splicing and leading to exon skipping or intron retention [16] [91].
- Cryptic Splice Site Activation: Creation or strengthening of non-canonical splice sites that compete with authentic sites, leading to exon elongation, truncation, or inclusion of intronic sequences as pseudoexons [16].
- Regulatory Element Disruption: Variants affecting splicing regulatory elements (SREs), including exonic and intronic splicing enhancers (ESEs, ISEs) or silencers (ESSs, ISSs), which alter binding of trans-acting factors like serine/arginine-rich (SRSF) proteins or heterogeneous nuclear ribonucleoproteins (hnRNPs) [16] [2].
- Deep-Intronic Variants: Mutations located deep within introns that can create novel splice sites or disrupt regulatory elements, often escaping detection by conventional exome sequencing [16].
Table 1: Categories of Splice-Disruptive Variants and Their Mechanisms
| Variant Category | Genomic Location | Primary Mechanism | Common Consequences |
|---|---|---|---|
| Canonical splice site | First/last 2-3 nucleotides of introns | Disruption of essential GU/AG dinucleotides | Exon skipping, intron retention |
| Extended splice site | Nucleotides +3 to +6 (donor) or -3 to -20 (acceptor) | Altered splice site strength | Alternative splice site usage |
| Exonic regulatory | Within exonic sequences | Disruption of ESEs/ESSs | Altered exon inclusion levels |
| Intronic regulatory | Within intronic sequences | Disruption of ISEs/ISSs | Altered exon inclusion levels |
| Deep-intronic | >50bp from exon-intron boundary | Creation of novel splice sites | Pseudoexon inclusion |
The functional consequences of these disruptions include frameshifts, premature termination codons (often triggering nonsense-mediated decay), in-frame deletions/insertions, and alterations to protein domains, all of which can profoundly affect protein function and contribute to disease pathogenesis [16] [91].
Computational Prediction Frameworks
Genome-Wide Annotation Strategies
The annotation of SDVs requires specialized computational approaches that move beyond traditional variant effect predictors. Current frameworks integrate multiple data types and prediction algorithms to identify variants with potential splicing effects. Whole genome sequencing (WGS) has revealed that many functionally significant intronic or regulatory variants remain undiagnosed due to limitations in conventional annotation pipelines [16].
Effective SDV annotation involves a multi-step process: (1) variant calling and quality control; (2) functional annotation using specialized splicing prediction tools; (3) integration with transcriptomic data (when available); and (4) prioritization based on predicted effect severity and clinical relevance [16] [92]. Special consideration must be given to non-coding variants, which constitute the majority of genetic variation but have historically been challenging to interpret [92].
Splicing-Specific Prediction Tools
Several advanced computational tools have been developed specifically for predicting splice-disruptive effects:
- SpliceAI: A deep learning-based tool that predicts splice-altering variants without relying on predetermined motif definitions, using a pre-trained neural network to score variants based on their potential to disrupt splicing [16] [93]. It provides delta scores representing the probability of acceptor loss, acceptor gain, donor loss, and donor gain.
- Pangolin: Another deep learning approach that leverages attention mechanisms to model splicing regulatory codes, demonstrating high accuracy in predicting splice-disruptive variants [94].
- SpliceVista: A visualization tool that facilitates the interpretation of splicing variants using mass spectrometry proteomics data, enabling mapping of peptides to splice variants and visualization of exon structures [95].
Table 2: Comparison of Major Computational Tools for Splice-Disruptive Variant Prediction
| Tool | Algorithm Type | Input Data | Key Outputs | Strengths | Limitations |
|---|---|---|---|---|---|
| SpliceAI | Deep neural network | DNA sequence | Δ scores for acceptor/donor loss/gain | High accuracy, no prior motif knowledge | Limited tissue specificity |
| Pangolin | Deep learning with attention | DNA sequence | Splicing disruption scores | Outperforms predecessor tools | Computational intensity |
| MAJIQ v2 | Bayesian framework | RNA-seq data | Local Splicing Variations (LSVs), PSI, dPSI | Handles heterogeneous datasets, identifies unannotated junctions | Requires RNA-seq data |
| VEP + Plugins | Rule-based + machine learning | VCF files | Variant consequences, splice predictions | Integrates with standard annotation pipelines | Dependent on annotation quality |
Recent evaluations indicate that deep learning-based models generally outperform traditional motif-oriented tools, particularly for variants outside canonical splice sites [16] [94]. However, performance varies across genomic contexts, and ensemble approaches often provide the most robust predictions.
Diagram 1: Genome-wide SDV annotation workflow. This pipeline integrates functional annotation, splicing-specific prediction, and RNA-seq data to prioritize variants for experimental validation.
Experimental Validation Methodologies
High-Throughput Functional Assays
Experimental validation is essential for confirming the functional impact of predicted SDVs, particularly for variant classification in clinical settings. Several high-throughput approaches have been developed to address this need:
- Massively Parallel Reporter Assays (MPRAs): These enable functional assessment of hundreds to thousands of variants simultaneously. Methods like Vex-seq and MFASS specifically allow analysis of intronic variants, overcoming limitations of earlier approaches [94].
- RNA-seq Analysis: Large-scale transcriptome sequencing provides direct evidence of splicing alterations. The MAJIQ v2 package addresses challenges in detecting, quantifying, and visualizing splicing variations from heterogeneous datasets, defining Local Splicing Variations (LSVs) to capture complex and unannotated splicing events [55].
- SpliceVista for Proteomic Validation: This tool enables identification and visualization of splice variants based on mass spectrometry proteomics data, mapping identified peptides to known splice variants and facilitating detection of variant-specific peptides that confirm translation of aberrant transcripts [95].
Targeted Experimental Protocols
For clinical validation or confirmation of individual high-priority variants, targeted approaches remain valuable:
Minigene Splicing Assay Protocol
- Fragment Amplification: Amplify genomic regions containing the variant of interest, including flanking exons and intronic sequences (typically 300-500bp of flanking intronic sequence).
- Vector Cloning: Clone the amplified fragment into an exon-trapping vector (e.g., pSPL3, pcDNA3.1) between constitutive exons.
- Site-Directed Mutagenesis: Introduce the candidate variant into the wild-type construct using PCR-based methods.
- Cell Transfection: Transfert both wild-type and mutant constructs into appropriate cell lines (HEK293, HeLa, or cell types relevant to the disease context).
- RNA Isolation and RT-PCR: Extract total RNA 24-48 hours post-transfection, perform reverse transcription, and amplify the processed transcript with vector-specific primers.
- Product Analysis: Resolve PCR products by capillary electrophoresis or gel electrophoresis, with Sanger sequencing of aberrant bands to confirm splicing patterns.
Endogenous Validation Using Patient RNA
When patient tissues or cells are available, analyzing endogenous splicing provides the most direct evidence:
- RNA Extraction: Isolate high-quality RNA from fresh blood, cultured fibroblasts, or tissue specimens, with PAXgene blood RNA tubes enabling stabilization from fresh blood [91].
- Reverse Transcription: Use random hexamers or oligo-dT primers for cDNA synthesis.
- Target Amplification: Design PCR primers spanning the exons of interest, ideally amplifying the entire transcriptional region to detect multiple aberrant events.
- Product Resolution and Quantification: Separate products by capillary electrophoresis (e.g., Agilent Bioanalyzer) for precise quantification of isoform ratios, calculated as Percent Spliced In (Ψ) values [55] [91].
- Sequencing Confirmation: Purify and sequence aberrant bands to determine exact splicing outcomes.
Diagram 2: Experimental validation workflow for predicted SDVs. Multiple approaches provide complementary evidence for splicing disruption.
Clinical and Translational Applications
Diagnostic Implementation
The clinical importance of SDV annotation is underscored by burden testing in disease cohorts, which reveals that approximately 10% of inherited heart disease cases carry rare splice-disruptive variants in definitively disease-associated genes [91]. Similar burdens have been observed across diverse genetic disorders, highlighting the importance of comprehensive splicing analysis in diagnostic settings.
Successful diagnostic implementation requires:
- Specialized Bioinformatics Pipelines: Integration of splicing-specific prediction tools (SpliceAI, Pangolin) into variant interpretation workflows, with careful attention to variant locations beyond canonical splice sites [16] [91].
- Functional Validation Protocols: Establishment of RNA-based studies using accessible tissues, with evidence that 68% of definitively disease-associated cardiac genes can be amplified from blood RNA, facilitating functional confirmation [91].
- Variant Classification Integration: Incorporation of functional splicing evidence into ACMG/AMP guidelines, where experimental confirmation of aberrant splicing can provide strong evidence for pathogenicity (PS3 criterion) [91].
Therapeutic Opportunities
Splice-disruptive variants represent promising targets for therapeutic intervention, particularly through RNA-targeted approaches:
- Antisense Oligonucleotides (ASOs): Splice-switching oligonucleotides can redirect splicing toward therapeutic outcomes, as demonstrated by nusinersen for spinal muscular atrophy and eteplirsen for Duchenne muscular dystrophy [16].
- Small Molecule Splicing Modulators: Compounds that influence spliceosome assembly or splicing factor activity, such as branaplam and risdiplam for SMN2 splicing modulation in SMA [16] [2].
- Emerging RNA-Editing Platforms: CRISPR-based and other editing technologies that enable precise correction of splicing defects at the genomic or RNA level [16].
Table 3: Research Reagent Solutions for Splicing Analysis
| Reagent/Category | Specific Examples | Primary Function | Application Context |
|---|---|---|---|
| Splicing Prediction Tools | SpliceAI, Pangolin, MAJIQ v2 | In silico prediction of splice-disruptive variants | Initial variant prioritization and annotation |
| Reporter Assay Systems | pSPL3 vectors, minigene constructs | Functional assessment of variant effects in cellular models | Medium-throughput experimental validation |
| RNA Stabilization Reagents | PAXgene Blood RNA Tubes, Tempus Tubes | Preservation of RNA integrity in clinical samples | Patient RNA analysis for endogenous validation |
| Transcript Quantification Kits | Quantigene Plex, RT-qPCR assays | Precise measurement of isoform ratios | Expression-level confirmation of splicing alterations |
| Splicing-Targeted Therapeutics | Nusinersen, Eteplirsen | Modulation of splicing patterns for therapeutic benefit | Clinical applications and proof-of-concept studies |
Emerging Frontiers and Challenges
Technological Advances
The field of SDV annotation continues to evolve rapidly, driven by several technological developments:
- Single-Cell Multi-Omics: Approaches that combine transcriptomics with genomic analysis at single-cell resolution, enabling the linking of variants to splicing outcomes in specific cell types relevant to disease pathogenesis [2].
- Deep Learning Enhancements: Next-generation algorithms that incorporate additional contextual information, including chromatin structure, epigenetic marks, and tissue-specific splicing factor expression [16] [96].
- Long-Read Sequencing Technologies: Platforms that provide full-length transcript information, overcoming limitations of short-read RNA-seq for characterizing complex splicing patterns and isoform diversity [55].
Current Limitations and Future Directions
Despite significant progress, several challenges remain in comprehensive genome-wide SDV annotation:
- Tissue-Specific Effects: Current prediction tools largely lack tissue-specific models, despite extensive evidence that splicing regulation varies across tissues and developmental stages [16] [2].
- Non-Coding Variant Interpretation: The functional annotation of deep-intronic and regulatory variants remains particularly challenging, requiring integration of epigenomic data and chromosome conformation information [92] [96].
- Standardization of Evidence: Guidelines for incorporating splicing evidence into variant classification frameworks need further refinement, particularly for variants with moderate predicted effects or those located in non-canonical contexts [91].
Future directions will likely focus on integrative frameworks that combine computational predictions, experimental data, and clinical evidence to provide comprehensive SDV annotation, ultimately enhancing diagnostic yields and expanding therapeutic opportunities across the spectrum of genetic disorders.
Integrative Analysis of Splicing with Other Post-Transcriptional Regulations
The regulation of gene expression extends beyond transcription to include intricate post-transcriptional processes. Among these, alternative splicing stands as a pivotal mechanism, dramatically expanding proteomic diversity from a limited set of genes. Contemporary research reveals that splicing does not operate in isolation but is integrated within a complex network of post-transcriptional controls, including RNA editing, localization, stability, and translation. This whitepaper synthesizes current findings to elaborate on the frameworks and methodologies for analyzing these interconnected regulatory layers. We present quantitative data, detailed experimental protocols, and standardized visualization tools to aid researchers in deconvoluting the combinatorial logic of post-transcriptional regulation. Understanding this integrated network is crucial for elucidating the molecular etiology of diseases ranging from rare genetic disorders to complex diseases like inflammatory bowel disease and cancer, thereby opening new avenues for therapeutic intervention [51] [97].
The central dogma of molecular biology outlines the flow of genetic information from DNA to RNA to protein. However, this pathway is enriched by a sophisticated suite of regulatory steps that occur after an RNA molecule is transcribed. While historically studied as discrete events, it is now evident that processes such as splicing, polyadenylation, RNA editing, transport, stability, and translation are functionally coupled. This coupling is orchestrated by a limited repertoire of RNA-binding proteins (RBPs) that assemble into combinatorial regulatory units, or modules, to govern specific groups of transcripts known as regulons [97]. For instance, the same RBP can influence splicing in the nucleus and then later modulate the translation or decay of its target mRNAs in the cytoplasm.
The integrative analysis of these processes is therefore not merely additive but essential for a systems-level understanding of gene expression control. This whitepaper provides a technical guide for conducting such an integrative analysis, focusing on the nexus between splicing and other post-transcriptional regulations. It is framed within the broader thesis that protein diversity, crucial for cellular complexity and adaptability, is largely governed by these coordinated regulatory mechanisms [98].
Quantitative Landscape of Splicing and Its Integration
Global Splicing Changes in Response to Regulatory Perturbations
Manipulating key regulators of RNA processing can induce widespread transcriptomic changes. The following table summarizes quantitative findings from a study on Hub1 overexpression in Saccharomyces cerevisiae, illustrating the extensive transcriptional and splicing reprogramming that can occur [99].
Table 1: Genome-wide Transcriptional and Splicing Changes Induced by Hub1 Overexpression
| Analysis Type | Tool/Method | Key Finding / Metric | Value / Quantity |
|---|---|---|---|
| Differential Expression | DESeq2 | Differentially Expressed Genes (DEGs) | 3,915 (1,964 up, 1,951 down) |
| Adjusted P-value (padj) | < 0.05 | ||
| Transcriptional Variance | Principal Component Analysis (PCA) | Variance Explained by Hub1 Overexpression | 98% |
| Alternative Splicing | rMATS | Significant Exon Skipping Events | 7 |
| DYN2 Exon Skipping (FDR, ΔPSI) | FDR = 0.0481, ΔPSI = -0.036 | ||
| Splice Site Strength | MaxEntScan | DYN2 5' Splice Site Score | -18.32 (p=0.03) |
| Functional Enrichment | Gene Set Enrichment Analysis (GSEA) | p53 Signaling (NES) | NES = 1.255 |
| Cell Cycle Suppression (NES) | NES = -0.692 | ||
| Network Analysis | WGCNA | Brown Module Correlation (r, p) | r = 0.99, p < 0.001 |
Splicing Variant Quantification in Human Tissues
The quantitative patterns of alternative splicing variants (ASVs) can be tissue-specific and altered in disease states. The table below details the expression of specific ASVs of the HNF1B gene across different tissues, highlighting their potential role in tumorigenesis [58].
Table 2: Expression of HNF1B Alternative Splicing Variants in Tumour vs. Non-Tumour Tissues
| Tissue | Sample Type | Overall HNF1B mRNA | ASV 3p (%) | ASV Δ7 (%) | ASV Δ7-8 (%) | ASV Δ8 (%) |
|---|---|---|---|---|---|---|
| Large Intestine | Non-Tumour | Normal | 33.5% | 1.5% | 0.8% | 6.9% |
| Tumour | Decreased (p=0.019) | Decreased (31.6%, p=0.018) | No Sig. Change | Increased (1.9%, p=0.028) | No Sig. Change | |
| Prostate | Non-Tumour | Normal | 29.1% | 1.5% | 0.8% | 6.9% |
| Tumour | Decreased (p=0.047) | Decreased (26.5%, p<0.001) | No Sig. Change | Increased (1.0%, p=0.028) | No Sig. Change | |
| Kidney | Non-Tumour | Normal | 28.2% | 1.7% | 1.7% | 2.3% |
| Tumour | No Sig. Change | No Sig. Change | Increased (2.2%, p=0.037) | No Sig. Change | No Sig. Change |
Experimental Protocols for Integrative Analysis
A Multimodal Framework for Mapping RBP Regulatory Modules
To systematically map the functional interactions between RBPs and their collective impact on splicing and other regulatory processes, a multimodal integration approach is required. The following protocol, adapted from Giroth et al. (2024), outlines this process [97].
Protocol 1: Constructing an Integrated Regulatory Interaction Map (IRIM)
Data Acquisition via Multiple Modalities:
- Physical Proximity (BioID): Fuse the proximity-dependent biotinylation system (e.g., BioID2) to a panel of RBPs (e.g., 50 RBPs) in a relevant cell line (e.g., K562). Express the fusion proteins, perform biotin pulldown, and identify associated proteins using mass spectrometry. Include matched no-biotin controls for each RBP line.
- Functional Genetic Interaction (Perturb-seq): Perform parallelized knockdown or knockout of a panel of RBPs (e.g., 68 RBPs) using CRISPR-based systems (e.g., CRISPRi) with single-cell RNA sequencing readout (Perturb-seq). This captures the transcriptomic consequences of each RBP loss.
- RNA Binding (eCLIP): Utilize existing or newly generated enhanced Cross-Linking and Immunoprecipitation (eCLIP) data from sources like ENCODE to define the comprehensive RNA targets for each RBP.
Data Standardization and Similarity Calculation:
- For each data modality (BioID, Perturb-seq, eCLIP), generate an RBP-target interaction matrix.
- Standardize measurements across target features to make them comparable.
- Calculate pairwise cosine distances between all RBPs within each modality to estimate their physical and functional proximity.
- Transform these distances into empirical p-values to achieve a uniform scale for pairwise similarity.
Data Integration and Module Identification:
- Combine the three p-value matrices (from BioID, Perturb-seq, and eCLIP) into a single unified probability score for each RBP pair, creating the Integrated Regulatory Interaction Map (IRIM).
- Perform unsupervised clustering on the IRIM to identify functional RBP modules—groups of RBPs that closely interact to regulate specific biological processes.
- Define the target regulon for each module as the set of RNAs bound by at least two RBPs within that module, based on eCLIP data.
Validation and Functional Annotation:
- Validate the identified interactions by comparing them against gold-standard protein-protein interaction databases (e.g., STRING, OpenCell).
- Biochemically validate the predicted functions for selected RBPs and their roles in specific regulatory programs (e.g., alternative splicing, translation, stability).
Experimental Validation of Splicing Variants
For the clinical interpretation of splice site variants, experimental validation is critical, especially when patient RNA is inaccessible. The expression minigene (EMG) assay is a robust method for this purpose [100].
Protocol 2: Expression Minigene (EMG) Assay for Splicing Variant Analysis
Vector Construction:
- Clone the full-length open reading frame (cDNA) of the gene of interest (e.g., CFTR) into a mammalian expression plasmid (e.g., pcDNA5/FRT).
- For the intron of interest, PCR amplify genomic DNA fragments containing the exon with the variant, along with significant portions of the flanking intronic sequences (at least 200-300 bp from both the 5' and 3' introns) to capture essential splicing regulatory elements.
- Use fusion PCR to combine the exon and abridged intron sequences.
- Insert this "abridged intron" construct back into the corresponding location in the cDNA within the plasmid.
Variant Introduction:
- Introduce the patient-derived or engineered splice site variant (e.g., c.1585-1G>A) into the EMG construct using site-directed mutagenesis.
Cell Transfection and RNA Harvesting:
- Transfect the wild-type and variant EMG constructs into relevant cell lines (e.g., HEK293 for general use or CFBE41o- for CFTR-specific studies).
- After 24-48 hours, harvest total RNA from the transfected cells and treat with DNase to remove genomic DNA contamination.
Splicing Analysis:
- Reverse transcribe the RNA to cDNA.
- Analyze the splicing patterns using PCR with primers flanking the cloned exon, followed by gel electrophoresis to visualize isoform sizes.
- Quantify the proportion of correct versus aberrantly spliced transcripts using techniques like fragment analysis or pyrosequencing.
- The effect of the variant on the protein product can be assessed by western blot or immunocytochemistry.
Visualization of Regulatory Networks and Workflows
Multimodal Integration for RBP Module Discovery
This diagram illustrates the experimental and computational workflow for building an Integrated Regulatory Interaction Map (IRIM) to reveal functional RBP modules [97].
Expression Minigene Assay Workflow
This diagram outlines the key steps in the expression minigene (EMG) assay, a fundamental method for experimentally assessing the functional impact of splicing variants [100].
The Scientist's Toolkit: Essential Research Reagents
Table 3: Key Reagent Solutions for Integrative Splicing and Post-Transcriptional Analysis
| Category | Reagent / Tool | Function / Application |
|---|---|---|
| Splicing & Expression Quantification | rMATS-turbo [99] | Statistical detection of differential alternative splicing events from RNA-seq data with replicates. |
| DESeq2 [99] | Differential gene expression analysis of RNA-seq count data, including normalization and dispersion estimation. | |
| Droplet Digital PCR (ddPCR) [58] | Absolute quantification of specific RNA splicing variants with high precision and sensitivity, without the need for standard curves. | |
| Functional Genomics | CRISPRi/CRISPRa with single-cell RNA-seq (Perturb-seq) [97] | High-throughput functional screening to link RBP (or any gene) perturbation to genome-wide transcriptomic consequences at single-cell resolution. |
| Interaction Mapping | Proximity-Dependent Biotinylation (e.g., BioID2) [97] | In vivo identification of protein neighborhoods and physical interactions for a protein of interest (e.g., an RBP). |
| enhanced Cross-Linking and Immunoprecipitation (eCLIP) [97] | Genome-wide mapping of the exact RNA sequences bound by a specific RBP. | |
| Splicing Validation | Expression Minigene (EMG) Vectors [100] | Experimental system to study the splicing effects of genetic variants in a controlled cellular context when patient RNA is unavailable. |
| Sequencing Technologies | Long-Read Sequencing (PacBio, Nanopore) [51] | Sequencing of full-length RNA transcripts, enabling unambiguous identification of splicing variants and complex haplotypes without assembly. |
Challenges in Splicing Interpretation and Therapeutic Targeting
Identifying and Validating Pathogenic Splice-Disruptive Variants
Splice-disruptive variants represent a significant category of pathogenic mutations, accounting for an estimated 15-30% of all disease-causing genetic alterations [16]. These variants pose substantial challenges in genomic diagnostics and therapeutic development due to their diverse mechanisms and locations throughout the genome. This technical guide provides a comprehensive framework for the identification, validation, and interpretation of splice-disruptive variants, contextualized within the broader study of alternative splicing and protein diversity mechanisms. We synthesize current computational prediction methodologies, experimental validation protocols, and clinical interpretation guidelines to support researchers and drug development professionals in advancing both diagnostic capabilities and RNA-targeted therapeutic strategies.
Fundamental Splicing Mechanisms
Pre-mRNA splicing is an essential eukaryotic process orchestrated by the spliceosome, a complex ribonucleoprotein machine composed of five small nuclear ribonucleoproteins (snRNPs)—U1, U2, U4, U5, and U6—along with numerous associated proteins [16]. This machinery recognizes conserved cis-acting elements: the 5' splice site (donor site), branch point sequence (BPS), polypyrimidine tract (PPT), and 3' splice site (acceptor site) [16]. The recognition of these elements is governed by the exon definition model, wherein 5' and 3' splice sites flanking an exon are cooperatively recognized as a functional unit, particularly critical in higher eukaryotes with long introns [16].
Alternative splicing enables the production of multiple transcript and protein isoforms from a single gene, with over 90% of human multi-exon genes exhibiting tissue-specific alternative splicing [16]. This process represents a crucial mechanism for expanding proteomic diversity and enables fine-tuned regulation of gene expression in different tissues and developmental stages. Common alternative splicing modes include cassette exon inclusion, alternative 5' or 3' splice site usage, mutually exclusive exons, and intron retention [101].
Impact on Protein Function and Diversity
The functional consequences of alternative splicing extend profoundly to the protein level, where isoform-specific changes can alter post-translational modification (PTM) landscapes critical for protein regulation. Research using PTM-POSE, a tool developed to explore splicing-PTM relationships, has revealed that approximately 30% of PTM sites are excluded from at least one protein isoform, while about 2% exhibit altered flanking sequences that may modify enzymatic recognition and binding interactions [18]. This splicing-mediated PTM diversification affects protein-interaction networks, kinase-substrate relationships, and ultimately cellular signaling pathways [18].
The relationship between splicing and protein diversity is particularly relevant in voltage-gated calcium channels (VGCCs), where alternative splicing of all ten α1-encoding genes generates extensive proteomic variety with distinct biophysical and pharmacological properties [20]. This diversity enables specialized cellular functions but also creates multiple potential targets for splicing-related channelopathies when disrupted [20].
Mechanisms of Splice Disruption
Splice-disruptive variants can act through multiple molecular mechanisms, which can be broadly categorized as follows:
Canonical Splice Site Disruptions
Mutations affecting the highly conserved GU (donor) or AG (acceptor) dinucleotides at canonical splice sites typically cause complete abolition of authentic RNA splicing [16]. These variants most commonly result in exon skipping or intron retention, often producing frameshifts and premature termination codons that trigger nonsense-mediated decay (NMD) [101].
Cryptic Splice Site Activation
Single nucleotide variants can create new splice sites or strengthen weak pre-existing cryptic sites, leading to aberrant splicing patterns. This mechanism can cause exon elongation, exon shortening, or pseudoexon inclusion from deep intronic regions [16]. These cryptic sites are particularly challenging to predict bioinformatically as they may not be evident from reference genome annotations.
Splicing Regulatory Element Disruption
Variants can disrupt exonic or intronic splicing enhancers (ESEs, ISEs) or silencers (ESSs, ISSs), which are short motifs bound by trans-acting regulators such as serine/arginine-rich (SR) proteins and heterogeneous nuclear ribonucleoproteins (hnRNPs) [16] [101]. These elements fine-tune splice site selection, and their disruption can alter splicing patterns without affecting the core splice site sequences themselves.
Impact on Splicing Coupled to Transcription
Growing evidence indicates that splicing is coupled to transcription through the C-terminal domain (CTD) of RNA polymerase II [101]. Variants affecting transcriptional kinetics or chromatin structure can indirectly influence splicing outcomes, adding another layer of complexity to variant interpretation.
Computational Prediction of Splice-Disruptive Variants
Algorithm Categories and Methodologies
Computational prediction represents the first critical step in identifying potential splice-disruptive variants. Current algorithms can be broadly categorized into several classes based on their underlying methodologies:
Table 1: Major Categories of Splice Prediction Algorithms
| Algorithm Category | Representative Tools | Underlying Methodology | Key Applications |
|---|---|---|---|
| Deep Learning-based | SpliceAI, Pangolin | Uses deep neural networks trained on gene model annotations to predict splice effects directly from primary sequence | Genome-wide variant screening, non-canonical variant detection |
| Feature-based Classifiers | S-Cap, SQUIRLS | Implements classifiers using features like motif models, kmer scores, and evolutionary conservation | Clinical variant interpretation, prioritized variant assessment |
| Experiment-informed | HAL, MMSplice | Combines training data from randomized sequence libraries with primary sequence features | Saturation mutagenesis studies, regulatory element mapping |
| Meta-predictors | ConSpliceML | Integrates multiple algorithm scores with population constraint metrics | Clinical diagnostics, variant prioritization |
Performance Benchmarking
Recent benchmarking studies using massively parallel splicing assays (MPSAs) have provided critical insights into algorithm performance across different variant types. These studies evaluated 3,616 variants across five genes, offering high-resolution ground-truth data [102]. Key findings include:
- Overall Performance: Deep learning-based predictors (SpliceAI and Pangolin) achieved the best overall performance at distinguishing disruptive and neutral variants [102].
- Regional Variation: Algorithm concordance with experimental measurements was significantly lower for exonic than intronic variants, highlighting the particular challenge of identifying missense or synonymous splice-disruptive variants [102].
- Sensitivity-Specificity Tradeoffs: When controlling for overall call rate genome-wide, SpliceAI and Pangolin demonstrated superior sensitivity, though optimal score cutoffs vary by gene context and application requirements [102].
Table 2: Algorithm Performance Across Genomic Regions Based on MPSA Benchmarking
| Algorithm | Overall AUC | Intronic Variant Performance | Exonic Variant Performance | Key Strengths |
|---|---|---|---|---|
| SpliceAI | 0.89 | High concordance | Moderate concordance | Sensitivity, canonical site prediction |
| Pangolin | 0.87 | High concordance | Moderate concordance | Sequence context integration |
| MMSplice | 0.82 | Moderate concordance | Lower concordance | Experimental data integration |
| SQUIRLS | 0.80 | Moderate concordance | Lower concordance | Clinical variant experience |
Practical Implementation Considerations
Effective implementation of computational prediction requires attention to several practical considerations:
- Gene Model Annotation Dependence: Predictions can vary substantially based on the transcript annotations used, necessitating careful selection of biologically relevant isoforms [102].
- Threshold Selection: Optimal score cutoffs depend on application context—diagnostic settings may prioritize specificity, while research screens may emphasize sensitivity [102].
- Multi-Tool Approaches: Combining complementary algorithms can improve overall performance, particularly for challenging variant categories like exonic regulatory element disruptions [102].
Experimental Validation of Splicing Effects
Minigene Splicing Assays
Minigene assays provide a versatile system for evaluating the functional impact of putative splice-disruptive variants under controlled conditions.
Diagram 1: Minigene Splicing Assay Workflow
Protocol Details:
- Construct Design: A genomic region containing the exon of interest with flanking intronic sequences (typically 300-500 bp) is cloned into an exon-trapping vector such as pET01 [103].
- Variant Introduction: The candidate variant is introduced using site-directed mutagenesis with primers specifically designed for the mutation [103].
- Cell Transfection: Wild-type and mutant constructs are transfected into appropriate cell lines (e.g., HEK293T) using standard methods.
- RNA Analysis: After 48 hours, RNA is extracted, reverse transcribed, and amplified using PCR primers flanking the splice junction [103].
- Product Resolution: PCR products are separated by gel electrophoresis and sequenced to identify aberrant splicing patterns including exon skipping, intron retention, or cryptic splice site usage [103].
Interpretation: The minigene assay described in the OTOF c.898-18G>A variant study demonstrated complete exon 10 skipping, confirming its pathogenicity through disrupted splicing patterns [103].
Massively Parallel Splicing Assays (MPSAs)
MPSAs represent a high-throughput approach capable of simultaneously evaluating thousands of variants in a single experiment:
Experimental Framework:
- Library Construction: Complex variant libraries are cloned into minigene constructs covering multiple exonic regions [102].
- Pooled Transfection: Libraries are transfected as pools into recipient cells.
- Deep Sequencing: Splicing outcomes are quantitatively assessed by deep RNA sequencing, with percent spliced-in (PSI) values calculated for each variant [102].
- Data Analysis: Variants are classified as splice-disruptive based on statistically significant changes in PSI compared to wild-type controls.
Applications: MPSAs have been instrumental in benchmarking computational predictors and generating comprehensive training datasets, particularly for non-canonical variant types [102].
Endogenous Analysis
Analysis of splicing in endogenous contexts provides the most physiologically relevant validation:
Patient-Derived Materials:
- RNA Extraction: Isolate RNA from patient-derived cells or tissues expressing the gene of interest.
- RT-PCR Analysis: Design primers spanning the variant region to amplify and quantify naturally occurring transcripts.
- Transcript Quantification: Use capillary electrophoresis, quantitative PCR, or RNA sequencing to detect and measure aberrant splicing patterns.
Advantages: Endogenous analysis captures native chromatin environment, transcriptional kinetics, and cell-type specific splicing factors that may influence splicing outcomes.
Clinical Interpretation and Classification
Evidence Integration Frameworks
The clinical interpretation of splice-disruptive variants requires systematic integration of multiple evidence types:
Table 3: Evidence Categories for Splice Variant Interpretation
| Evidence Category | Key Elements | Strength Weighting |
|---|---|---|
| Computational and Predictive Data | SpliceAI, Pangolin scores, evolutionary conservation | Supporting to Moderate |
| Functional Data | Minigene assays, MPSA results, endogenous RNA analysis | Strong (if well-controlled) |
| Allelic Data | Population frequency, segregation with disease | Supporting to Strong |
| Phenotypic Data | Match between patient phenotype and known gene-disease association | Moderate |
The ABC System for Variant Classification
The ABC system provides a structured approach to variant classification that separates functional and clinical assessments:
Step A: Functional Grading
- Grade 1: Normal function
- Grade 2: Likely normal function
- Grade 3: Hypothetical functional effect (based on predictions or de novo occurrence)
- Grade 4: Likely functional effect
- Grade 5: Proven functional effect (experimental validation) [104]
Step B: Clinical Grading
- Grade 1: "Right type of gene" for the phenotype
- Grade 2: Risk factor (low-penetrance variant)
- Grade 3-5: Pathogenic with increasing penetrance levels [104]
This system specifically addresses the challenge of Variants of Uncertain Significance (VUS) by splitting them into true unknowns (class 0) and variants with hypothetical functional effects (class 3), providing a rationale for variant-of-interest reporting when clinically relevant [104].
Comprehensive databases play a crucial role in variant interpretation:
SpliceVarDB: A specialized database consolidating over 50,000 experimentally validated splicing variants across more than 8,000 human genes [23]. Notably, 55% of splice-altering variants in SpliceVarDB reside outside canonical splice sites, with 5.6% located in deep intronic regions [23]. This resource helps prevent duplication of validation efforts and supports clinical variant curation.
Research Reagents and Tools
Table 4: Essential Research Reagents for Splicing Studies
| Reagent/Tool | Function/Application | Examples/Specifications |
|---|---|---|
| Exon-Trapping Vectors | Minigene splicing assays | pET01 (Mobitec), psiCHECK2 |
| Splicing Prediction Algorithms | In silico variant prioritization | SpliceAI, Pangolin, MMSplice |
| RNA Extraction Kits | Isolation of high-quality RNA | Column-based methods, TRIzol |
| Reverse Transcriptase | cDNA synthesis for splicing analysis | M-MLV, AMV-RT |
| Splicing-Focused Databases | Variant interpretation and evidence | SpliceVarDB, ClinVar, LOVD |
| Massively Parallel Assay Platforms | High-throughput variant screening | Vex-seq, MaPSy, SGE |
| Cell Line Models | Splicing validation | HEK293T, patient-derived iPSCs |
The systematic identification and validation of pathogenic splice-disruptive variants represents a critical capability in both genetic diagnostics and therapeutic development. The integration of sophisticated computational predictors, high-throughput experimental assays, and structured clinical interpretation frameworks has substantially improved our ability to recognize these variants, yet significant challenges remain—particularly for exonic regulatory element disruptions and deep intronic mutations.
Future advancements will likely emerge from several promising directions: improved deep learning models trained on expanded experimental datasets, single-cell splicing analyses that capture tissue-specific contexts, and enhanced integration of multi-omics data. Furthermore, the growing success of RNA-targeted therapies, including antisense oligonucleotides and small molecule splicing modulators, highlights the therapeutic relevance of accurately identifying and characterizing splice-disruptive variants [16]. These developments will continue to bridge the gap between variant discovery and clinical application, ultimately enhancing both diagnostic yields and targeted therapeutic opportunities for genetic disorders driven by splicing defects.
Overcoming Limitations in Computational Splicing Prediction
Accurate computational prediction of RNA splicing is a cornerstone of modern genomics, with profound implications for understanding genetic diseases and developing targeted therapies. It is now estimated that 15–30% of all disease-causing mutations may affect splicing, either by disrupting canonical splice sites, activating cryptic sites, or altering regulatory elements [16]. The clinical significance of these mutations is underscored by the success of RNA-targeted therapeutics like nusinersen for spinal muscular atrophy and eteplirsen for Duchenne muscular dystrophy, which function by correcting aberrant splicing [16]. As genomic diagnostics evolve from phenotype-first to genome-first paradigms, there is an urgent need for systematic strategies to identify and interpret splice-disruptive variants—including those in noncoding regions that escape detection by traditional annotation pipelines [16]. This technical guide examines the current limitations in computational splicing prediction and outlines innovative approaches to overcome these challenges, ultimately enabling more accurate diagnosis and targeted therapeutic development for splicing-driven disorders.
Current Limitations in Splicing Prediction
Technical and Computational Barriers
The accurate prediction of splicing variants faces significant technical hurdles across multiple domains. Current clinical whole-genome sequencing (WGS) pipelines remain limited in detecting noncoding variants that affect RNA splicing, largely due to insufficient annotation tools [16]. In single-cell and spatial sequencing contexts, high Nanopore error rates compromise cell barcode and unique molecular identifier (UMI) recovery, while read truncation and misalignment undermine isoform quantification [105]. Furthermore, there is a notable lack of statistical frameworks to assess splicing variation within and between cells or spatial spots [105]. Legacy splice prediction systems also face implementation challenges, with leading tools like SpliceAI relying on outdated software frameworks that limit broader application and adoption [106].
Algorithmic and Data Limitations
Beyond technical sequencing barriers, algorithmic limitations present substantial obstacles. Traditional probabilistic methods for assigning RNA-Seq reads to matching isoforms struggle with genes exhibiting complex splicing patterns, particularly when multiple alternative splice events are separated by more than the read length [107]. Approximately 54% of human genes contain such complex patterns [107]. Additionally, the human-centric training data used by most deep learning models limits their performance on nonhuman species, restricting utility in model organism research [106]. There is also a significant interpretability gap—while modern deep learning models achieve high accuracy, understanding the precise biological mechanisms behind their predictions remains challenging for researchers and clinicians.
Emerging Solutions and Methodological Advances
Enhanced Computational Frameworks and Algorithms
Deep Learning Implementations
Recent advances in deep learning have produced sophisticated models that significantly improve splicing prediction accuracy. Independent benchmarking across diverse datasets reveals that deep learning methods consistently outperform traditional algorithmic ensembles [108]. The original SpliceAI algorithm utilizes a deep residual convolutional neural network (CNN) architecture to identify splicing patterns directly from primary DNA sequences without relying on human-engineered features [106]. To address SpliceAI's limitations, OpenSpliceAI provides an open-source PyTorch implementation that offers faster processing speeds, reduced memory usage, and efficient GPU utilization [106]. Another alternative, CI-SpliceAI, demonstrates comparable performance to the original SpliceAI, with balanced concordance across different splice event types [108].
Table 1: Performance Comparison of Deep Learning Splice Prediction Algorithms
| Algorithm | Architecture | Balanced Accuracy (Curated Dataset) | Balanced Accuracy (ClinVar) | Key Advantages |
|---|---|---|---|---|
| SpliceAI | Deep Residual CNN | 90.7% | 89.5% | Original benchmark model |
| OpenSpliceAI | PyTorch CNN | 89.5% | 89.5% | Open-source, trainable, species adaptation |
| CI-SpliceAI | Deep Residual CNN | 89.7% | 89.2% | Balanced performance across event types |
| Traditional Ensemble (MaxEntScan, NNSplice, etc.) | Various | <88.9% | <88.9% | Interpretability, established methods |
Specialized Tools for Complex Data Types
For single-cell and spatial sequencing data, the Longcell pipeline addresses the unique challenges of Nanopore sequencing by implementing precise UMI recovery and UMI-based denoising [105]. This approach corrects for the "UMI scattering" phenomenon where sequencing errors inflate UMI counts, leading to more accurate isoform quantification at single-cell resolution [105]. For visualizing complex splicing patterns from RNA-Seq data, SpliceSeq utilizes splice graphs rather than probabilistically assigning reads across isoforms, providing an intuitive composite view of alternative splicing that handles genes with densely distributed alternative splice paths [107].
Experimental Validation Frameworks
Computational predictions require rigorous experimental validation to establish biological relevance. Mini-gene splice assays represent a gold-standard approach for functionally validating predicted splice-disruptive variants [108]. These assays involve cloning genomic fragments containing the variant of interest into exon-trapping vectors, transfecting them into cultured cells, and analyzing resulting RNA via RT-PCR to detect aberrant splicing [16]. For high-throughput validation, targeted long-read sequencing approaches can confirm predicted splicing events across multiple samples simultaneously. The growing availability of biobanks with paired genomic and transcriptomic data enables systematic validation of splicing predictions across diverse genetic backgrounds [16].
Table 2: Key Experimental Methods for Validating Splicing Predictions
| Method | Throughput | Key Applications | Technical Considerations |
|---|---|---|---|
| Mini-gene Splicing Assays | Low to medium | Functional validation of individual variants | Requires precise construct design; quantitative but labor-intensive |
| Single-Molecule Long-Read Sequencing (Nanopore/PacBio) | High | Full-length transcript identification; novel isoform discovery | Higher error rates (Nanopore); lower throughput (PacBio) |
| Targeted RNA Sequencing | Medium to high | Validation of specific splicing events across multiple samples | Enables focused analysis; cost-effective for validation studies |
| Massively Parallel Splicing Reporters | Very high | Systematic testing of variant libraries | Synthetic approach; may lack native genomic context |
Visualization of Computational Splicing Analysis Workflows
Comprehensive Splicing Variant Analysis Pipeline
The following diagram illustrates the integrated computational and experimental workflow for comprehensive splicing variant analysis:
Single-Cell and Spatial Splicing Analysis with Longcell
For single-cell and spatial splicing analysis, the Longcell pipeline addresses specific challenges of long-read data:
Essential Research Reagents and Computational Tools
Table 3: Research Reagent Solutions for Splicing Prediction and Validation
| Resource/Tool | Type | Primary Function | Application Context |
|---|---|---|---|
| SpliceAI | Computational Algorithm | Predicts splice-altering variants from DNA sequence | Primary variant annotation; clinical prioritization |
| OpenSpliceAI | Computational Framework | Open-source, trainable splice site prediction | Species-specific model development; flexible implementation |
| Longcell | Computational Pipeline | Single-cell/spatial isoform quantification | Cellular heterogeneity studies; developmental biology |
| SpliceSeq | Visualization Resource | RNA-Seq data analysis and visualization | Alternative splicing event identification; functional impact assessment |
| Nanopore R10.4 | Sequencing Chemistry | Improved accuracy long-read sequencing | Full-length isoform characterization; direct RNA sequencing |
| MAS-ISO-seq | Experimental Protocol | High-throughput PacBio isoform sequencing | Comprehensive transcriptome annotation; novel isoform discovery |
| Mini-gene Splicing Vectors | Molecular Biology Reagent | Functional validation of splice variants | Mechanistic studies; variant pathogenicity determination |
| Antisense Oligonucleotides | Therapeutic Modality | Splice-switching for correction | Therapeutic development; functional validation |
Future Directions and Clinical Applications
Integration with Therapeutic Development
The ultimate goal of advanced splicing prediction is to enable development of targeted therapies for genetic disorders. Antisense oligonucleotides (ASOs) that modulate splicing patterns represent a promising therapeutic avenue, as demonstrated by FDA-approved drugs like nusinersen and eteplirsen [16]. Accurate prediction of splice-disruptive variants enables identification of patient populations likely to benefit from such interventions. Furthermore, computational predictions can guide the design of patient-specific ASOs that target pathological splicing events while preserving normal isoform balance. The growing understanding of splicing regulatory mechanisms also opens possibilities for small-molecule splicing modulators that can target the core spliceosome or specific splicing factors [16] [61].
Advancing Precision Medicine through Splicing-Aware Genomics
As genomic medicine evolves, incorporating splicing-aware interpretation into diagnostic pipelines will significantly enhance diagnostic yield. Current estimates suggest that ~10% of variants of uncertain significance (VUS) may affect splicing [16]. Advanced prediction tools can facilitate reclassification of these VUS, providing conclusive diagnoses for previously undiagnosed genetic conditions. Future developments should focus on integrating multi-omics data to model tissue-specific splicing effects, incorporating noncoding variants beyond canonical splice sites, and developing standardized frameworks for clinical interpretation of predicted splicing effects. These advances will cement splicing analysis as an indispensable component of precision medicine, enabling more accurate diagnosis and personalized therapeutic interventions for patients with splicing-driven disorders.
Computational splicing prediction has evolved from focusing primarily on canonical splice sites to encompassing the complex landscape of splicing regulation, including deep-intronic and synonymous variants that can dramatically alter splicing patterns. While significant challenges remain in prediction accuracy, technical implementation, and clinical interpretation, emerging approaches like OpenSpliceAI, Longcell, and integrated experimental-computational frameworks are rapidly addressing these limitations. As these tools mature and become integrated into diagnostic and therapeutic development pipelines, they will play an increasingly vital role in realizing the promise of precision medicine for rare and common genetic disorders alike. The continued refinement of splicing prediction methodologies will not only enhance our understanding of basic biology but also unlock new avenues for therapeutic intervention across a broad spectrum of human diseases.
Addressing Technical Biases in Transcriptome Annotation
Transcriptome annotations serve as the fundamental reference for nearly all RNA sequencing analyses, from gene expression quantification and differential splicing detection to the functional interpretation of genetic variants. However, these annotations are not perfect ground truths but are themselves data products subject to numerous technical biases that can systematically distort biological interpretation. Within the context of alternative splicing and protein diversity research, these biases are particularly consequential, as they can lead to incomplete or misleading conclusions about transcriptomic diversity across species, tissues, and cellular populations [109] [110]. The growing recognition that historical biases in annotation databases affect downstream research has spurred the development of both experimental and computational correction strategies.
The core of the problem lies in the fact that major reference annotations, such as RefSeq and GENCODE/Ensembl, are built through automated annotation pipelines that rely heavily on available transcriptomic evidence. The distribution and quality of this underlying evidence are inherently uneven. For instance, annotations for model organisms and human populations of European ancestry are substantially more complete than those for non-model species or underrepresented human populations [111]. Furthermore, systematic differences in how pipelines handle computational predictions versus experimental data, or how they prioritize certain transcript biotypes, introduce additional layers of bias that can directly impact the assessment of splicing complexity and protein diversity [109] [112].
Understanding the specific sources of bias is the first step toward mitigating their effects. Research has identified several dominant categories of technical bias that confound cross-species and cross-population comparisons.
Evidence-Driven and Ancestry-Related Bias
Large-scale comparative analyses reveal that the very metrics used to quantify alternative splicing are strongly influenced by annotation quality. An analysis of 670 multicellular eukaryotes found that the percentage of coding sequences (CDSs) supported by experimental evidence was the dominant predictor of variation in genome-wide alternative splicing estimates, overshadowing the effects of genome assembly quality or raw transcriptomic input [109]. This creates a systematic inflation of apparent splicing complexity in well-studied model organisms compared to non-model species, independent of their actual biology.
A critical parallel bias exists in human genomics. Current reference annotations are overwhelmingly built from transcriptomic data of individuals with European ancestry. Long-read transcriptomics of a diverse human cohort demonstrated that this leads to a systematic underrepresentation of transcripts from non-European populations. The study built a population-diverse annotation (PODER) and discovered over 41,000 novel transcripts, a significant portion of which were population-specific and enriched in non-European samples [111]. This ancestry bias directly impairs the ability to accurately link genetic variants to alternative transcript usage in global populations.
Pipeline and Bioinformatics-Associated Bias
The choice of annotation database itself is a significant source of bias. RefSeq and Ensembl/GENCODE employ different methodologies; RefSeq tends to prioritize experimental evidence, while Ensembl incorporates more computational predictions [112]. This fundamental difference leads to substantial discrepancies in transcript sets. It has been shown that these differences are pronounced at the intron-chain level, with transcripts containing intron retentions being a major point of divergence between databases [112]. Consequently, evaluating the same transcript assembler with RefSeq versus Ensembl annotations can yield contradictory conclusions about its performance, highlighting how the reference itself can dictate analytical outcomes.
Furthermore, the mathematical framework of expression quantification is sensitive to annotation depth. The number of transcripts in an annotation directly influences the Transcripts Per Million (TPM) denominator, creating an inverse relationship between annotation completeness and the calculated TPM value for individual transcripts. Simulations show that subsampling a transcriptome leads to inflation of TPM values for the remaining transcripts, a critical consideration when comparing expression across species with differently annotated genomes [113].
Table 1: Key Sources of Technical Bias in Transcriptome Annotation
| Bias Category | Specific Source | Impact on Splicing & Diversity Research |
|---|---|---|
| Evidence-Driven | Proportion of CDSs with experimental support [109] | Systematically higher inferred splicing complexity in well-studied species |
| Ancestry-Related | Under-representation of non-European transcripts in human references [111] | Impaired discovery of population-specific splicing variants and allele-specific transcript usage |
| Pipeline/Algorithmic | Differences between RefSeq (evidence-focused) and Ensembl (prediction-inclusive) [112] | Contradictory evaluation of assemblers and incomplete view of transcript diversity |
| Mathematical | TPM inflation in sparsely annotated genomes [113] | Skewed cross-species gene expression comparisons |
Methodologies for Bias Detection and Quantification
Cross-Annotation Comparative Analysis
A robust approach to quantify pipeline-induced bias involves a systematic comparison of annotations from different sources. The protocol below outlines the key steps.
Protocol: Comparative Analysis of RefSeq and Ensembl Annotations
- Data Retrieval: Download the latest RefSeq and Ensembl/GENCODE annotation files (GTF format) for the organism of interest from their respective official portals.
- Structural Parsing: Parse the annotations to extract fundamental transcript features, including:
- Intron-exon boundaries and splice junction coordinates.
- Complete intron chains for each transcript isoform.
- Transcript biotypes (e.g., protein-coding, retained intron, nonsense-mediated decay).
- Similarity Assessment: Use tools like GffCompare to quantify the overlap of transcripts between the two annotations based on exon-intron structure [112].
- Biotype-Specific Enrichment: Calculate the relative abundance of specific biotypes (especially intron retention transcripts) in each annotation set. A significant over-representation in one database indicates a specific annotational focus that could bias downstream assembly or quantification [112].
Experimental Support Metric Extraction from NCBI EGAP Reports
For bias detection across species, the metadata from annotation pipelines are invaluable. The NCBI Eukaryotic Genome Annotation Pipeline (EGAP) provides detailed reports for each assembled genome.
Protocol: Quantifying Evidence-Based Annotation Support
- Report Collection: Retrieve the annotation report for the species of interest from the NCBI FTP service [109].
- Metric Extraction: Parse the report to extract key quantitative metrics, which typically include:
- Total number of annotated CDSs.
- Number and percentage of CDSs supported by RNA-seq and other experimental evidence (ESTs, proteins).
- Number of CDSs based purely on ab initio prediction.
- Metrics on the input evidence (e.g., number of RNA-seq runs, tissue diversity) [109].
- Correlation with Splicing Metrics: Calculate a genome-wide alternative splicing metric, such as the Alternative Splicing Ratio (ASR). Perform a regression analysis (e.g., polynomial regression) to model the relationship between the percentage of evidence-supported CDSs and the ASR. The residuals from this model can be used as a bias-adjusted metric for cross-species comparison [109].
Strategies for Bias Mitigation and Correction
Computational Normalization and Annotation-Free Approaches
To circumvent the limitations of reference annotations, several computational strategies have been developed.
- Annotation-Normalized Splicing Metrics: For cross-species comparisons, a normalization procedure based on polynomial regression can be applied. This model uses the percentage of experimentally supported CDSs as the independent variable to predict the expected ASR. The adjusted ASR is then derived from the model's residuals, effectively preserving relative splicing complexity while mitigating the artifact of uneven experimental support [109].
- Annotation-Free Splicing Quantification: Methods like
LeafCutterand its single-cell adaptationscQuintavoid annotations altogether by quantifying splicing variation directly from intron-exon junctions.scQuintwas specifically designed to be robust to the pervasive coverage biases found in single-cell RNA-seq data (e.g., 3' coverage drop-off), which confound traditional isoform-level quantification. By focusing on alternative intron excision, it enables the discovery of both annotated and novel splicing events in a robust manner [114].
Enhanced Experimental and Library Construction Methods
Improving the underlying data that feeds into annotations is crucial for long-term bias reduction.
- Population-Diverse Transcriptome Sequencing: Actively generating long-read RNA-seq data from genetically diverse cohorts is essential to correct ancestry bias. The protocol involves sequencing full-length transcripts from multiple populations using platforms like Oxford Nanopore Technologies (ONT) or PacBio, followed by rigorous computational integration to build a unified, diverse annotation, as demonstrated by the creation of the PODER annotation [111].
- Optimized Library Preparation: Technical biases originating during library prep can be minimized by:
- Using rRNA depletion instead of poly-A selection for total RNA analysis to avoid 3'-end bias [115].
- Fragmenting RNA via chemical treatment (e.g., zinc) rather than enzymatic methods (RNase III) for more random fragmentation [115].
- Reducing the number of PCR amplification cycles and using high-fidelity polymerases to minimize duplication and chimeric artifacts [115].
The following workflow diagram illustrates the integrated process of generating a bias-corrected annotation, combining both enhanced experimental design and computational normalization.
Table 2: Research Reagent Solutions for Mitigating Annotation Bias
| Reagent / Resource | Type | Function in Bias Mitigation |
|---|---|---|
| Long-read Sequencing (ONT/PacBio) | Platform | Provides full-length transcript sequences, enabling discovery of novel isoforms and precise determination of splice junctions, reducing assembly ambiguity [111] [116]. |
| CapTrap Assay | Reagent | Enriches for full-length, capped mRNA molecules during library preparation, improving the completeness of transcript models [111]. |
| rRNA Depletion Kits | Reagent | Preserves non-polyadenylated RNA species and reduces 3'-end bias in coverage, allowing for a more complete representation of the transcriptome [115]. |
| Population-Diverse Cell Lines | Biological | Enables the construction of inclusive annotations that better represent global transcriptomic diversity, directly addressing ancestry bias [111]. |
| High-Quality Genome Assemblies | Resource | More contiguous assemblies (high N50, low contig count) provide a better scaffold for accurate gene model prediction and reduce fragmentation-related artifacts [109]. |
| SQANTI Quality Control Tool | Software | Classifies transcript models based on supporting evidence, identifying potential artifacts and ensuring high-quality novel transcript discovery [111]. |
Addressing technical biases in transcriptome annotation is not a mere technicality but a fundamental requirement for producing accurate and generalizable knowledge in alternative splicing and protein diversity research. The biases stemming from uneven experimental evidence, population underrepresentation, and algorithmic differences are quantifiable and, therefore, correctable. A multi-pronged approach is recommended: adopting normalization procedures for cross-species comparisons, integrating population-diverse data to create inclusive references, utilizing annotation-free or robust quantification methods for splicing analysis, and adhering to best practices in library construction.
The future of unbiased transcript annotation lies in the continued generation of diverse long-read transcriptomic data and the development of computational methods that are explicitly designed to account for, and correct, the systematic biases that have historically shaped our view of the transcriptome. As these efforts converge, we will move closer to a truly representative understanding of splicing diversity and its role in biology and disease.
Strategies for Functional Characterization of Novel Splice Variants
The functional characterization of novel splice variants represents a critical frontier in molecular genetics, bridging the gap between genomic data and mechanistic understanding of disease. Splice-disruptive variants are now recognized as a major contributor to genetic disorders, accounting for an estimated 15–30% of all disease-causing mutations [16]. These variants can disrupt normal gene expression through multiple mechanisms: canonical splice site disruptions, activation of cryptic splice sites, inclusion of pseudoexons, or alterations in splicing regulatory elements [16]. As genomic diagnostics increasingly adopt genome-first approaches, robust strategies for experimentally validating these variants have become indispensable for improving diagnostic yields and uncovering new therapeutic targets [16]. This technical guide provides comprehensive experimental frameworks for characterizing splice variants, with emphasis on practical methodologies, interpretation guidelines, and integration with emerging computational approaches.
Computational Prediction and Prioritization
In Silico Analysis Tools and Methods
Computational prediction serves as the essential first step in prioritizing splice variants for functional validation. Table 1 summarizes the major categories of bioinformatics tools and their specific applications for splice variant analysis.
Table 1: Computational Tools for Splice Variant Analysis
| Tool Category | Representative Tools | Primary Function | Key Applications |
|---|---|---|---|
| Deep Learning-Based Predictors | SpliceAI [117] | Genome-wide splicing effect prediction | Prioritizes variants based on predicted impact on splicing |
| Motif-Based Tools | MaxEntScan [117], BDGP [117] | Analyze splice site strength | Evaluates canonical and cryptic splice sites |
| Variant Interpretation | Alamut Visual, VarSome | Integrates multiple prediction algorithms | Provides consolidated pathogenicity assessment |
| Reference Databases | gnomAD, ClinVar, HGMD [118] | Population frequency and clinical annotations | Filters common polymorphisms and identifies known pathogenic variants |
Effective computational analysis requires a multi-tool approach, as each algorithm has distinct strengths and limitations. SpliceAI utilizes deep learning to predict splicing defects directly from nucleotide sequences, enabling genome-wide assessment without pre-defined sequence features [16]. Complementary tools like MaxEntScan and BDGP provide quantitative scores for splice site strength, which is particularly valuable for evaluating variants at canonical splice sites or predicting cryptic site activation [117]. The initial filtering should prioritize variants with low population frequency (typically <0.1% in gnomAD) and those located in evolutionarily conserved regions [118].
Workflow for Variant Prioritization
The prioritization process should systematically integrate computational evidence with inheritance patterns and clinical context. Figure 1 illustrates the recommended workflow for selecting candidate splice variants for experimental validation.
Figure 1: Workflow for prioritization of splice variants for experimental validation. WGS: whole-genome sequencing; WES: whole-exome sequencing; MAF: minor allele frequency.
The computational phase should prioritize variants predicted to significantly alter splicing, particularly those creating or strengthening cryptic splice sites, disrupting canonical splice sites, or affecting splicing regulatory elements. For recessive disorders, establishing that the candidate variant is in trans with a known pathogenic variant is critical, as demonstrated in albinism research where this approach yielded a 75% diagnostic success rate for confirmed splice variants [118].
Experimental Validation Methodologies
RNA Splicing Analysis
Direct analysis of RNA splicing effects provides the most compelling evidence for variant pathogenicity. Table 2 compares the primary experimental approaches for splice variant validation.
Table 2: Experimental Methods for Splice Variant Characterization
| Method | Key Applications | Advantages | Limitations |
|---|---|---|---|
| RT-PCR | Detect aberrant splicing in patient RNA | Direct analysis of endogenous transcripts; qualitative and semi-quantitative | Requires accessible tissue source; RNA quality critical |
| Minigene Assay | Characterize splicing when patient RNA unavailable | Controlled experimental system; versatile for intronic and exonic variants | May lack native chromatin context; potential missing regulatory elements |
| Nanopore Sequencing | Full-length transcript characterization; identify complex splicing patterns | Captures complete isoform structure; detects multiple co-existing variants | Higher error rate than short-read sequencing; specialized expertise needed |
| qRT-PCR | Quantify expression levels of specific isoforms | High sensitivity; precise quantification | Requires prior knowledge of aberrant transcripts |
Reverse Transcription PCR (RT-PCR)
RT-PCR remains the gold standard for direct detection of aberrant splicing when patient tissue is available. The protocol involves:
- RNA Extraction: Isolate high-quality RNA from appropriate tissue sources. For genes expressed in blood, peripheral blood samples are suitable [118]. For tissue-specific genes, alternative sources like hair bulbs may be utilized [119].
- cDNA Synthesis: Convert RNA to cDNA using reverse transcriptase with random hexamers or oligo-dT primers.
- PCR Amplification: Design primers flanking the region of interest with a product size that distinguishes wild-type from aberrant transcripts. In albinism research, this approach successfully identified pseudoexon inclusions in the OCA2 gene, such as a 159 bp insertion between exons 23 and 24 [118].
- Product Analysis: Resolve PCR products by gel electrophoresis and confirm aberrant splicing by Sanger sequencing.
Critical considerations include designing primers across multiple exons to avoid genomic DNA amplification and including both patient and control samples in the same experiment. When quantifying alternative splicing, capillary electrophoresis methods provide more precise quantification than traditional gel electrophoresis.
Minigene Splicing Assays
Minigene assays provide a powerful alternative when patient RNA is inaccessible. This method involves cloning genomic fragments containing the variant of interest into splicing reporter vectors. The standard protocol includes:
- Vector Selection: Choose appropriate splicing reporter vectors (e.g., pSPL3, pTB) containing heterologous exons with strong splice sites [120].
- Fragment Amplification: Amplify genomic regions (typically 500-1000 bp) encompassing the variant and flanking sequences, including complete exons and partial intronic regions.
- Cloning: Insert wild-type and mutant fragments into the vector between the heterologous exons.
- Transfection: Introduce constructs into suitable cell lines (e.g., HeLa, HEK293).
- RT-PCR Analysis: Amplify transcripts using vector-specific primers and analyze splicing patterns.
In ABO gene research, minigene assays precisely quantified how splice site variants (c.374+5G>A, c.374+4A>G, c.374+4A>T) reduced functional transcript levels to 2.8-10.2% of normal, directly correlating with weak blood group phenotypes [120]. Figure 2 illustrates the typical minigene assay workflow and expected outcomes.
Figure 2: Minigene assay workflow for splice variant analysis.
Research Reagent Solutions
Successful experimental characterization requires specific reagents tailored to splicing analysis. Table 3 catalogues essential materials and their applications.
Table 3: Essential Research Reagents for Splice Variant Characterization
| Reagent Category | Specific Examples | Applications | Technical Notes |
|---|---|---|---|
| Splicing Reporters | pSPL3 [118], pTB [120] | Minigene assays | Contain heterologous exons for detecting splicing of inserted genomic fragments |
| Cell Lines | HeLa [118], HEK293 | Minigene transfection | Well-characterized splicing machinery; high transfection efficiency |
| Reverse Transcriptases | SuperScript IV, PrimeScript | cDNA synthesis | High efficiency and processivity for full-length cDNA |
| PCR Enzymes | Q5 High-Fidelity, PrimeSTAR | Amplification of genomic fragments and cDNA | High fidelity critical for cloning; special mixes for long fragments |
| Cloning Systems | In-Fusion, Gibson Assembly, Restriction/ligation | Vector construction | Efficient directional cloning of large genomic fragments |
Interpretation and Clinical Translation
Pathogenicity Assessment
Functional data must be integrated within established variant interpretation frameworks. The American College of Medical Genetics and Genomics (ACMG) guidelines provide criteria for incorporating experimental evidence into variant classification [117]. Key considerations include:
- Functional Consequences: Determine if the variant causes exon skipping, intron retention, pseudoexon inclusion, or alternative splice site usage. For example, in the L1CAM gene, the c.1380-1G>A variant was correctly classified as pathogenic through combined minigene assays and clinical correlation [117].
- Transcript Impact: Assess whether the aberrant transcript introduces premature termination codons (nonsense-mediated decay targets), frameshifts, or in-frame alterations. The 159 bp pseudoexon insertion in OCA2 introduced a premature termination codon, confirming pathogenicity [118].
- Dosage Effects: Quantify the proportion of aberrant splicing, as even minor retention of normal splicing (e.g., 4.7-10.2% in ABO subtypes) can modify disease severity [120].
Therapeutic Implications
Functionally characterized splice variants represent promising targets for RNA-targeted therapies. Several therapeutic modalities have emerged:
- Antisense Oligonucleotides (ASOs): Splice-switching ASOs can block aberrant splice sites or prevent pseudoexon inclusion. Approved therapies for spinal muscular atrophy (nusinersen) and Duchenne muscular dystrophy (eteplirsen, golodirsen) demonstrate the clinical potential of this approach [16].
- Small Molecule Splicing Modulators: Compounds that interact with spliceosomal components or regulatory factors can alter splicing patterns.
- RNA Editing: Emerging technologies like RNA base editing offer potential for precise correction of splicing defects without permanent genomic changes [16].
The functional characterization data directly informs therapeutic development by identifying critical splice-disrupting sequences and providing quantitative assays for testing candidate therapeutics.
The strategic functional characterization of novel splice variants integrates computational prediction with rigorous experimental validation to resolve variants of uncertain significance and expand diagnostic capabilities. The methodologies outlined—from initial bioinformatic prioritization through minigene assays and clinical correlation—provide a systematic framework for establishing variant pathogenicity. As genomic medicine increasingly recognizes the prevalence and importance of splice-disruptive variants, these functional characterization strategies will remain essential for diagnosis, therapeutic development, and comprehensive understanding of gene regulation in human disease.
Therapeutic strategies that target the RNA level represent a revolutionary approach in modern drug development, moving beyond traditional protein-focused treatments to address disease at its molecular source. Antisense oligonucleotides (ASOs) and small molecule modulators are two leading classes of therapeutics that manipulate gene expression, with particular significance for modulating alternative splicing—a fundamental process that enables a single gene to produce multiple protein isoforms [51]. This capacity to influence the transcriptome is especially relevant within the broader context of protein diversity research, as alternative splicing is a key genomic mechanism for expanding the functional repertoire of cellular proteomes [98]. The ability to correct pathological splicing errors or alter splicing patterns for therapeutic benefit holds immense promise, particularly for genetic disorders and cancers where splicing defects are a primary cause of pathology [51] [121] [122]. This whitepaper provides an in-depth technical guide to the mechanisms, applications, and experimental methodologies of these targeted therapeutic platforms.
Mechanistic Foundations of Splicing Modulation
Antisense Oligonucleotides (ASOs): Precision Targeting through Base Pairing
ASOs are short, synthetic, single-stranded or double-stranded nucleic acid polymers (typically 15–21 nucleotides in length) designed to bind complementary RNA sequences through Watson-Crick base pairing, enabling precise targeting of disease-related transcripts [123] [124]. Their mechanisms of action fall into two primary categories: those that degrade target RNA and those that modulate RNA function without degradation.
Table 1: Core Mechanisms of Action of Antisense Oligonucleotides
| Mechanism | ASO Type | Molecular Process | Primary Outcome | Therapeutic Example |
|---|---|---|---|---|
| Target Degradation | Gapmer ASOs [121] | RNase H1 recruitment & cleavage of RNA-DNA heteroduplex | mRNA reduction | Treatment of toxic gain-of-function variants |
| Target Degradation | siRNA [121] [124] | RISC loading & Ago2-mediated cleavage of complementary mRNA | mRNA reduction | Treatment of toxic gain-of-function variants |
| Splicing Modulation | Splice-switching ASOs (ssASOs) [121] | Steric blockade of splice regulatory elements (ESE, ISE, ESS, ISS) | Altered exon inclusion/skipping | Nusinersen for SMA [51] [121] |
| Translation Blockade | Steric Blockers [124] | Physical obstruction of ribosomal progression or mRNA maturation | Reduced protein synthesis | Targeting of upstream open reading frames [121] |
A critical application of ASOs is splice modulation. Splice-switching ASOs (ssASOs) are designed to bind pre-mRNA and mask specific splice regulatory elements—such as splice sites, exonic splicing enhancers (ESEs), or intronic splicing silencers (ISSs)—without inducing RNA decay [121]. By preventing the spliceosome machinery from recognizing these elements, ssASOs can force the inclusion of an exon that would otherwise be skipped, or the skipping of an exon that would otherwise be included, thereby altering the resulting protein product [51] [124]. This approach can restore a disrupted reading frame, eliminate a toxic protein domain, or promote the production of a functional protein isoform. A landmark example is nusinersen, which targets the SMN2 gene to promote inclusion of exon 7, producing a stable, functional SMN protein to treat spinal muscular atrophy [51] [121].
The following diagram illustrates the primary mechanisms of action of ASOs and small molecules in modulating RNA splicing and expression.
Small Molecule Splicing Modulators: Targeting the Spliceosome Machinery
In contrast to the sequence-specific design of ASOs, small molecule splicing modulators are typically designed to target core components of the spliceosome itself or associated regulatory proteins [125]. These low-molecular-weight compounds are often orally bioavailable, offering a significant pharmacokinetic advantage over ASOs, which generally require injection [125].
A major class of these molecules, including pladienolides, herboxidienes, and spliceostatins, targets the SF3B complex, a critical component of the U2 snRNP that is essential for branch point recognition and intron anchoring during the splicing reaction's early stages [125] [122]. These inhibitors bind to a specific pocket within the SF3B1 protein and its partner PHF5A, locking the complex in an open, inactive conformation. This prevents stable interaction with the branch point adenosine, leading to widespread but often selective disruption of splicing and causing preferential lethality in cancer cells [125]. The anti-tumor effects are attributed to the mis-splicing of key genes involved in cell cycle progression and survival, to which rapidly dividing cancer cells are particularly vulnerable [122].
Chemistry and Delivery of Oligonucleotide Therapeutics
The inherent instability of unmodified oligonucleotides in biological fluids and their poor cellular uptake have driven the development of extensive chemical modifications to optimize their drug properties.
Table 2: Key Chemical Modifications for Antisense Oligonucleotides
| Modification Class | Example(s) | Key Structural Change | Primary Property Enhanced | Common Mechanism(s) |
|---|---|---|---|---|
| Backbone | Phosphorothioate (PS) [123] | Sulfur replaces non-bridging oxygen | Nuclease resistance, protein binding | RNase H recruitment |
| Sugar-Phosphate | Phosphorodiamidate Morpholino (PMO) [123] | Morpholine ring; phosphorodiamidate linkage | Nuclease resistance, solubility | Steric hindrance (Splice modulation) |
| Sugar | 2'-O-Methoxyethyl (2'-MOE) [123] | Methoxyethyl group at 2' position | Binding affinity, nuclease resistance | Steric hindrance, RNase H (in gapmer) |
| Sugar | Locked Nucleic Acid (LNA) [123] | Methyl bridge between 2'O and 4'C | Binding affinity (Tm ↑ 2-8°C/mod), stability | Steric hindrance, RNase H (in gapmer) |
| Nucleobase | 5-Methylcytosine [123] | Methyl group at cytosine 5 position | Binding affinity, reduced immune stimulation | Varies by design |
These modifications are strategically deployed in architectures like gapmers (which enable RNase H1 recruitment) or uniformly modified designs (used for steric blocking), allowing fine-tuning of ASO activity, stability, and pharmacokinetics [123]. Delivery to specific tissues remains a central challenge. Strategies include direct local administration (e.g., intrathecal for central nervous system targets), conjugation to targeting ligands (e.g., N-acetylgalactosamine for hepatocyte targeting), and formulation in lipid nanoparticles [121] [124].
Therapeutic Applications and Clinical Translation
The therapeutic application of these modulators is dictated by the underlying disease genetics. For disorders caused by toxic gain-of-function variants, where a mutant protein has a harmful activity, knockdown approaches using gapmer ASOs or siRNAs are appropriate to reduce the levels of the aberrant transcript [121]. Conversely, for many loss-of-function disorders, splice-switching ASOs can be used to restore functional protein by forcing the exclusion of a mutant exon or including a skipped exon to restore the reading frame [121].
Table 3: Approved and Investigational Splicing-Targeting Therapeutics
| Therapeutic | Target / Condition | Modulator Type | Mechanistic Action | Clinical Status / Key Outcome |
|---|---|---|---|---|
| Nusinersen (Spinraza) [51] [121] | SMN2 / Spinal Muscular Atrophy | Splice-switching ASO | Promotes inclusion of SMN2 exon 7 | FDA-approved; improves motor function, survival |
| Eteplirsen (Exondys 51) [125] | DMD / Duchenne Muscular Dystrophy | Splice-switching ASO (PMO) | Skips DMD exon 51 to restore reading frame | FDA-approved (accelerated) |
| H3B-8800 [125] [122] | SF3B1 / Myelodysplastic Syndromes, Leukemia | Small Molecule (Oral) | Modulates SF3B complex; preferential lethality to mutant cells | Clinical trial (showed favorable safety) |
| Tofersen [126] | SOD1 / Amyotrophic Lateral Sclerosis (ALS) | ASO (siRNA-like) | Knocks down mutant SOD1 mRNA | Phase 3 (Reduced SOD1 protein, limited clinical benefit) |
| (Investigational) [51] | Various / Inflammatory Bowel Disease (IBD) | Splice-switching ASO | Corrects disease-associated splicing quantitative trait loci (sQTLs) | Preclinical (IsoIBD Project) |
The following workflow outlines the key stages from target identification to clinical validation for developing splicing-targeted therapies.
Experimental Protocols and Research Toolkit
Key Methodologies for Splicing Modulation Research
Target Identification and Validation: Population-scale sequencing projects (e.g., IsoIBD, Project JAGUAR) use long-read sequencing technologies (PacBio) to definitively link genetic variants to specific splicing changes (splicing quantitative trait loci - sQTLs) in disease-relevant tissues [51]. This provides a robust foundation for selecting therapeutic targets.
In Vitro Splicing Assays: A standard tool is the minigene splicing assay. A genomic fragment containing the target exon and its flanking introns is cloned into an expression vector. This construct is transfected into cells, which are then treated with the experimental ASO or small molecule. RNA is extracted after 24-48 hours, and splicing patterns are analyzed via RT-PCR and gel electrophoresis or capillary electrophoresis to quantify exon inclusion/skipping [121].
High-Content Screening: For small molecules, libraries of chemical compounds are screened using cell lines reporter constructs where correct splicing produces a fluorescent or luminescent signal. This allows for the identification of novel modulators from thousands of candidates [125] [122].
In Vivo Testing: Animal models, including transgenic mice carrying human minigenes or patient-derived xenografts, are used to assess the efficacy, pharmacokinetics, and biodistribution of lead compounds. Administration routes (systemic, intracerebroventricular) are chosen based on the target tissue [121].
The Scientist's Toolkit: Essential Research Reagents
Table 4: Essential Reagents for Splicing Modulation Research
| Reagent / Tool | Critical Function | Application Example |
|---|---|---|
| Phosphorodiamidate Morpholino (PMO) [123] | Steric blockade of splice sites; nuclease-resistant, charge-neutral backbone. | In vitro and in vivo exon-skipping studies (e.g., DMD models). |
| Locked Nucleic Acid (LNA) [123] | Dramatically increases binding affinity (Tm) to target RNA; used in gapmers or mixmers. | Enhancing potency and durability of ASOs for transcript knockdown. |
| 2'-O-Methoxyethyl (2'-MOE) Gapmer [123] | Flanking 2'-MOE modifications protect a central DNA core that recruits RNase H1. | Development of therapeutics for targeted mRNA reduction (e.g., Tofersen). |
| SF3B1 Inhibitors (e.g., Pladienolide B, E7107) [125] [122] | Small molecules that bind the SF3B1/PHF5A complex, blocking branch point recognition. | Tool compounds for studying spliceosome mechanics and as anticancer agents. |
| Patient-Derived Organoids [126] | 3D cell cultures that model patient-specific tissue biology and disease pathology. | Personalized screening platform for ASO efficacy and toxicity (e.g., rare diseases). |
Challenges and Future Directions
Despite the promising progress, several challenges remain. For ASOs, efficient delivery to non-hepatic tissues, potential off-target effects, and immunostimulation are active areas of investigation [123] [124]. For small molecule splicing modulators, achieving splicing selectivity is a major hurdle, as global spliceosome inhibition can lead to on-target toxicity, as observed with the visual adverse effects of E7107 [125]. The future of the field lies in overcoming these limitations through advanced chemistry and delivery systems, more predictive disease models, and a deeper understanding of spliceosome biology. The convergence of these technologies with the growing understanding of protein diversity will undoubtedly unlock new avenues for treating a broader range of diseases, moving from rare genetic disorders to more common conditions like cancer and inflammatory diseases [51] [122].
Navigating Variants of Uncertain Significance in Clinical Interpretation
Variants of Uncertain Significance (VUS) represent one of the most significant challenges in modern clinical genetics, particularly as genomic testing becomes more widespread. Within the broader context of alternative splicing and protein diversity mechanisms research, the accurate interpretation of VUS is paramount. It is now recognized that a substantial fraction of disease-causing mutations disrupt RNA splicing, a fundamental process that enables the production of multiple transcript and protein isoforms from a single gene, thereby greatly expanding the functional complexity of the genome [16]. Recent estimates suggest that 15-30% of all disease-causing mutations may affect splicing, either by disrupting canonical splice sites, activating cryptic sites, or altering regulatory elements such as enhancers or silencers [16]. This statistic underscores the critical importance of understanding splicing disruptions when navigating VUS interpretation.
The clinical significance of solving the VUS puzzle is further highlighted by the emergence of RNA-targeted therapeutics. For instance, splice-switching antisense oligonucleotides (SSOs) such as nusinersen have dramatically improved outcomes in patients with spinal muscular atrophy by correcting aberrant splicing [16]. Similar approaches have shown success for Duchenne muscular dystrophy [16]. These therapeutic advances demonstrate not only the pathogenic potential of splicing variants but also their tractability as therapeutic targets, making accurate VUS interpretation increasingly essential for treatment decisions.
Splicing Biology and VUS Pathogenicity Mechanisms
Fundamentals of Pre-mRNA Splicing
Pre-mRNA splicing is an intricate process orchestrated by the spliceosome, a large ribonucleoprotein complex composed of five small nuclear ribonucleoproteins (snRNPs)—U1, U2, U4, U5, and U6—along with numerous associated proteins [16]. Accurate splicing depends on conserved cis-acting elements: the 5' splice site (donor site), the branch point sequence (BPS), the polypyrimidine tract (PPT), and the 3' splice site (acceptor site) [16]. These elements are recognized and regulated by trans-acting splicing regulators, most notably serine/arginine-rich splicing factors (SRSFs) and heterogeneous nuclear ribonucleoproteins (hnRNPs) [16].
The recognition of splice sites is not strictly local. The exon definition model posits that the 5' and 3' splice sites flanking an exon are cooperatively recognized as a functional unit [16]. This coordination between U1 and U2 snRNPs is particularly critical in higher eukaryotes, where long introns demand cross-exon communication for accurate exon boundary recognition. This complexity renders the splicing process vulnerable to disruption by genetic variants that may otherwise appear benign through conventional annotation pipelines.
Mechanisms of Splicing Disruption by Genetic Variants
Genetic variants can disrupt normal splicing through multiple mechanisms, leading to diverse aberrant outcomes:
- Canonical splice site disruptions: Variants affecting the highly conserved GU or AG dinucleotides at canonical splice sites can abolish authentic RNA splicing, often resulting in exon skipping or intron retention [16].
- Cryptic splice site activation: Creation or strengthening of cryptic splice sites can lead to exon elongation, exon shortening, or pseudoexon inclusion [16].
- Regulatory element alterations: Mutations affecting splicing regulatory elements—such as branch points, polypyrimidine tracts, or exonic/intronic splicing enhancers/silencers (ESEs, ESSs, ISEs, ISSs)—can alter trans-acting factor binding, impacting splicing fidelity [16].
- Deep-intronic variants: Variants located deep within introns can create novel splice sites or alter regulatory elements, leading to pseudoexon inclusion [16].
The diversity of these mechanisms explains why many splice-disruptive variants have been historically overlooked in conventional variant interpretation pipelines, particularly those occurring outside canonical splice sites.
Table 1: Types of Aberrant Splicing Outcomes and Their Potential Consequences
| Splicing Outcome | Molecular Mechanism | Potential Impact on Protein |
|---|---|---|
| Exon skipping | Complete exclusion of an exon from mature transcript | In-frame deletion, frameshift, or loss of critical domain |
| Intron retention | Failure to remove an intron | Frameshift, introduction of premature termination codon |
| Cryptic site usage | Usage of non-canonical splice sites | Exon elongation/truncation, frameshift |
| Alternative 5'/3' site usage | Shift in exon boundaries | In-frame insertion/deletion, minor protein changes |
| Pseudoexon inclusion | Activation of intronic sequence as exon | Frameshift, insertion of non-native amino acids |
Computational Approaches for Splicing Impact Prediction
Splicing Prediction Algorithms and Tools
Computational prediction tools have become indispensable for initial assessment of splice-disruptive potential in VUS. These tools employ diverse algorithms, from position-specific weight matrices to deep learning approaches:
- SpliceAI: A deep learning-based tool that has demonstrated high accuracy in predicting splicing anomalies, outperforming many traditional tools [127]. It uses a deep residual neural network to predict splice effects from sequence data.
- Pangolin: Another deep learning-based algorithm designed to predict splice-disrupting variants [94].
- varSEAK and Splicing Prediction Pipeline: Additional tools commonly used in splicing prediction workflows [127].
While these tools provide valuable initial insights, their performance varies, and they generally show decreased accuracy for specific splicing patterns [127]. This limitation underscores the importance of not relying solely on computational predictions for clinical interpretation.
Standardized Framework for Evidence Integration
The ClinGen Sequence Variant Interpretation (SVI) Splicing Subgroup has developed standardized recommendations for applying ACMG/AMP codes related to splicing predictions and functional data [128] [129] [130]. These guidelines aim to address the variation in how different clinical laboratories and expert panels apply evidence codes to splicing variants.
Key recommendations include:
- PVS1 application: Outlines a process for integrating splicing-related considerations when developing a gene-specific PVS1 decision tree for predicted loss-of-function variants [128] [129].
- PP3/BP4 utilization: Provides methodology to calibrate splice prediction tools and establish thresholds for supporting or opposing pathogenicity based on computational evidence [128] [129].
- PS1 application: Recommends using PS1 based on similarity of predicted RNA splicing effects for a variant under assessment compared to a known pathogenic variant [128] [129].
- Functional evidence codes: Proposes that PS3/BS3 codes should be applied only for well-established assays that measure functional impact not directly captured by RNA splicing assays [128] [129].
Table 2: ACMG/AMP Evidence Codes for Splicing Variant Interpretation
| Evidence Code | Application to Splicing Variants | Strength |
|---|---|---|
| PVS1 | Null variant in a gene where loss-of-function is a known mechanism of disease | Very Strong |
| PS3 | Functional assays show damaging effect on splicing | Strong |
| PP3 | Computational evidence supports a splicing effect | Supporting |
| BS3 | Functional assays show no damaging effect on splicing | Strong |
| BP4 | Computational evidence suggests no splicing impact | Supporting |
| BP7 | Silent change with no predicted impact on splicing (with evidence) | Supporting |
Experimental Validation of Splicing Impacts
Functional Assays for Splicing Analysis
Experimental validation is crucial for confirming the splicing impact of VUS and providing evidence for pathogenicity classification. Multiple established methods exist for this purpose:
- RT-PCR Analysis: Direct analysis of patient RNA to detect aberrant splicing patterns. This method can identify various splicing abnormalities including exon skipping, intron retention, and cryptic splice site usage [127]. The main limitation is the requirement for accessible patient tissue expressing the gene of interest.
- Minigene Splicing Assays: In vitro systems where genomic fragments containing the variant are cloned into splicing reporter vectors and transfected into cultured cells [127]. This approach allows for controlled analysis of splicing patterns without requiring patient RNA.
- Massively Parallel Reporter Assays (MPRA): High-throughput methods like Vex-seq and MFASS that enable functional analysis of hundreds to thousands of variants simultaneously [94]. These approaches are particularly valuable for systematic analysis of variants in non-coding regions.
Studies have demonstrated the critical value of these experimental approaches. One comprehensive analysis of 18 splice-region VUS found that 88.9% (16/18) altered pre-mRNA splicing, enabling definitive genetic diagnoses in 83.3% (15/18) of families [127]. The most prevalent abnormal splicing event was exon skipping (33.3%, 6/18) [127].
Integrated Workflow for Splicing VUS Assessment
An effective approach to splicing VUS assessment integrates multiple lines of evidence through a systematic workflow:
Splicing VUS Assessment Workflow
Research Reagents and Methodologies
Essential Research Reagent Solutions
The experimental assessment of splicing variants requires specialized reagents and tools designed to elucidate splicing impacts:
Table 3: Essential Research Reagents for Splicing Analysis
| Research Reagent | Function/Application | Technical Considerations |
|---|---|---|
| SpliceAI | Deep learning-based prediction of splice-altering variants | Requires appropriate threshold setting; performance varies by genomic context |
| Pangolin | Deep learning algorithm for splice-disrupting variant prediction | Originally developed for human variants; performance in other species requires validation [94] |
| Minigene Splicing Vectors | In vitro analysis of splicing patterns for genomic variants | Allows controlled assessment without patient RNA; may lack native genomic context |
| RT-PCR Primers | Amplification of specific transcript regions from patient RNA | Must be designed to flank potential aberrant splicing events; require optimization |
| Vex-seq Platform | High-throughput functional analysis of splice-disrupting variants | Enables parallel testing of hundreds of variants; requires specialized expertise [94] |
RNA-seq-Based Variant Detection Pipelines
RNA sequencing provides a powerful approach for detecting splicing variants in expressed regions of the genome. Specialized computational pipelines have been developed for this purpose:
- Variant Analysis Pipeline (VAP): A workflow that employs multiple RNA-seq splice-aware aligners (TopHat2, HiSAT2, STAR) to call variants from RNA-seq data [131]. This approach achieved over 65% concordance with whole genome sequencing coding variants in validation studies [131].
- GATK RNA-seq Short Variant Discovery: Implements best practices for RNA-seq variant calling, including splice-aware alignment with STAR, read processing with SplitNCigarReads, and variant calling with HaplotypeCaller [132].
- DeepVariant RNA-seq: A deep-learning-based variant caller that has been adapted for RNA-seq data, showing superior performance in some comparisons [133].
A critical consideration in RNA-seq variant calling is proper processing of splicing junctions. The GATK SplitNCigarReads tool is essential for reformatting alignments that span introns, splitting reads with N in the CIGAR string into multiple supplementary alignments to ensure only exonic segments are used for variant calling [132] [133].
Clinical Applications and Therapeutic Implications
Diagnostic Implementation and Challenges
The integration of splicing analysis into clinical diagnostics has demonstrated significant impact on diagnostic yields. Studies implementing systematic splicing assessment have reported substantial improvements in diagnostic resolution:
- One study found that routine use of functional assays enabled reclassification of 83.3% of splicing VUS to pathogenic/likely pathogenic, facilitating definitive diagnoses [127].
- The application of RNA assays in clinical practice has been shown to increase clinical diagnostic rates and resolve VUS, particularly for variants with limited phenotypic information [127].
- Rapid exome sequencing in consanguineous populations identified pathogenic or likely pathogenic variants in 42% of cases, impacting treatment decisions, prognosis, and reproductive counseling [130].
Despite these advances, challenges remain in clinical implementation. There is decreased accuracy of prediction tools for specific splicing patterns, highlighting the continued necessity of functional validation [127]. Additionally, the interpretation of splicing functional assays requires specialized expertise not universally available in clinical settings.
Therapeutic Opportunities and Precision Medicine
Accurate classification of splicing VUS opens avenues for therapeutic intervention, particularly through RNA-targeted approaches:
- Antisense oligonucleotides (ASOs): Splice-switching oligonucleotides can redirect splicing to produce therapeutic outcomes, as demonstrated by nusinersen for spinal muscular atrophy [16].
- Small-molecule splicing modulators: Chemical compounds that can influence spliceosome activity or splicing factor function [16].
- Emerging RNA-editing platforms: Technologies that enable precise correction of splicing defects at the RNA level [16].
The therapeutic potential of splicing correction underscores the importance of accurate VUS interpretation. As one study noted, RNA assay results provided critical information for reproductive decisions, directly influencing prenatal management in families with splicing-related disorders [127].
The field of splicing variant interpretation continues to evolve with several promising developments on the horizon. Data-driven approaches that establish quantitative heuristics for splice-altering variant assessment are bridging the gap between computational predictions and biological reality [134]. These approaches define measures of "spliceogenicity" - the proportion of variants at a specific location that affect splicing in a given context - offering more nuanced interpretation beyond traditional binary predictions [134].
As genomic diagnostics shift from phenotype-first to genome-first paradigms, systematic strategies for identifying and interpreting splice-disruptive variants become increasingly essential [16]. The integration of high-throughput functional data, refined computational predictions, and standardized clinical frameworks will continue to enhance our ability to resolve VUS, ultimately improving diagnostic accuracy and expanding therapeutic opportunities for patients with genetic disorders.
In conclusion, navigating Variants of Uncertain Significance requires a multidisciplinary approach that incorporates understanding of splicing biology, computational predictions, functional validation, and standardized clinical interpretation frameworks. Through these integrated strategies, a significant proportion of VUS can be resolved, enabling precise diagnosis and informing therapeutic development in the era of precision medicine.
Optimizing Splicing-Correction Therapies for Neuromuscular Disorders
Alternative splicing is a fundamental biological process that enables a single gene to generate multiple protein isoforms, significantly expanding the functional diversity of the proteome. This mechanism is particularly critical in neuromuscular systems, where precise regulation of gene expression ensures proper development, differentiation, and physiological function of muscles and neurons. Neuromuscular disorders frequently arise from splicing errors that disrupt the production of essential proteins, leading to progressive muscle weakness, neuronal dysfunction, and often premature death. The emergence of splice-correction therapies represents a transformative approach for treating these conditions by targeting the root genetic cause rather than merely alleviating symptoms.
Research over the past decade has established that approximately 10-30% of disease-causing genetic variants affect RNA splicing [51]. In the context of neuromuscular diseases such as myotonic dystrophy type 1 (DM1), Duchenne muscular dystrophy (DMD), and spinal muscular atrophy (SMA), defective splicing leads to the production of abnormal proteins that compromise cellular integrity and function. The pioneering work in antisense oligonucleotide (ASO) technology has enabled researchers to develop targeted therapies that can modulate splicing patterns, restore functional protein expression, and potentially alter disease progression. This whitepaper examines the current state of splicing-correction therapies, detailing the mechanistic principles, experimental methodologies, and clinical applications that are advancing the treatment of neuromuscular disorders.
Molecular Mechanisms of Splicing Dysregulation
Fundamental Splicing Machinery
The splicing process is executed by a sophisticated macromolecular complex known as the spliceosome, which comprises five small nuclear RNAs (U1, U2, U4, U5, and U6) and hundreds of associated proteins that form small nuclear ribonucleoproteins (snRNPs) [2]. This complex recognizes specific sequences at exon-intron boundaries and catalyzes the removal of introns and joining of exons to generate mature mRNA. The regulation of alternative splicing depends on cis-acting elements within the pre-mRNA sequence, including exon splicing enhancers (ESEs), exon splicing silencers (ESSs), intron splicing enhancers (ISEs), and intron splicing silencers (ISSs). These elements serve as binding sites for trans-acting factors, primarily RNA-binding proteins (RBPs) that either promote or suppress the inclusion of specific exons [2].
Two major classes of RBPs govern splicing outcomes: the SR protein family (SRSFs) that generally activate exon inclusion, and heterogeneous nuclear ribonucleoproteins (HNRNPs) that typically promote exon exclusion [2]. The balance between these competing factors determines the final splicing pattern, and disruptions to this equilibrium can have profound pathological consequences. In neuromuscular disorders, mutations can create aberrant splice sites, strengthen existing weak splice sites, or disrupt regulatory elements that control splicing factor binding, ultimately leading to the production of defective proteins that impair neuromuscular function.
Disease-Specific Splicing Pathologies
Different neuromuscular disorders exhibit distinct patterns of splicing dysregulation. In myotonic dystrophy type 1 (DM1), the pathogenic mechanism involves an expanded CTG trinucleotide repeat in the DMPK gene. This expansion leads to the production of toxic RNA that sequesters muscleblind-like (MBNL) splicing factors, resulting in widespread spliceopathy affecting multiple transcripts [135] [136]. The mis-splicing of genes critical for muscle function, such as those involved in chloride and insulin signaling, contributes to the myotonia, muscle weakness, and systemic manifestations characteristic of DM1.
In spinal muscular atrophy (SMA), the primary defect involves the survival motor neuron 1 (SMN1) gene, where mutations cause aberrant skipping of exon 7, leading to reduced levels of functional SMN protein [51]. This results in the progressive loss of motor neurons and muscle atrophy. For amyotrophic lateral sclerosis (ALS), recent research has identified mis-splicing of the UNC13A gene due to TDP-43 protein pathology as a critical factor in disease progression [137]. UNC13A is essential for synaptic communication between nerve cells, and its improper splicing compromises neuronal transmission and accelerates disease progression.
The following diagram illustrates the comparative splicing disruption mechanisms in three major neuromuscular disorders:
Therapeutic Approaches for Splicing Correction
Antisense Oligonucleotide (ASO) Platforms
Antisense oligonucleotides (ASOs) are synthetic, single-stranded nucleic acid polymers typically ranging from 15-30 nucleotides in length that are designed to bind complementary RNA sequences through Watson-Crick base pairing. In splicing correction applications, ASOs function by blocking access to specific regulatory elements or splice sites, thereby redirecting the splicing machinery toward the production of desired transcript variants. The therapeutic efficacy of ASOs depends critically on their chemical modifications, which enhance nuclease resistance, improve binding affinity, and reduce off-target effects [138].
Recent advances in ASO technology have focused on enhancing delivery efficiency to target tissues, particularly skeletal muscle, cardiac muscle, and the central nervous system. Two prominent platforms exemplify this progress: PepGen's Enhanced Delivery Oligonucleotide (EDO) platform and Dyne Therapeutics' FORCE platform. The EDO platform utilizes cell-penetrating peptides to improve cellular uptake and nuclear delivery of conjugated oligonucleotides [135] [139]. Meanwhile, the FORCE platform employs antibody fragments that bind to the transferrin receptor 1 (TfR1) to facilitate receptor-mediated endocytosis into muscle cells [136] [140]. These advanced delivery systems have demonstrated remarkable improvements in tissue biodistribution and therapeutic efficacy in clinical trials.
Clinical Trial Results for Splicing Correction Therapies
Recent clinical trials have yielded promising results for splicing correction therapies in various neuromuscular disorders. The following table summarizes key efficacy data from ongoing clinical studies:
Table 1: Clinical Efficacy of Splicing Correction Therapies in Neuromuscular Disorders
| Therapeutic Agent | Target Disease | Dose | Splicing Correction | Functional Improvement | Citation |
|---|---|---|---|---|---|
| PGN-EDODM1 (PepGen) | DM1 | 15 mg/kg (single dose) | 53.7% mean correction (22-gene panel) | Not yet reported | [135] [139] |
| PGN-EDODM1 (PepGen) | DM1 | 10 mg/kg (single dose) | 29.1% mean correction (22-gene panel) | Not yet reported | [135] [139] |
| PGN-EDODM1 (PepGen) | DM1 | 5 mg/kg (single dose) | 12.3% mean correction (22-gene panel) | Not yet reported | [135] [139] |
| DYNE-101 (Dyne) | DM1 | 5.4 mg/kg Q8W | 27% mean splicing correction | 4.5-second improvement in vHOT | [140] |
| DYNE-101 (Dyne) | DM1 | 1.8 mg/kg Q4W | Data not specified | 3.1-second vHOT improvement at 3 months, increasing to 4.4 seconds at 12 months | [140] |
| UNC13A-ASO (Preclinical) | ALS | Low doses in mice | Splicing correction achieved | Improved synaptic communication, restored neuronal synchrony | [137] |
The safety profiles of these investigational therapies have generally been favorable. For PGN-EDODM1, treatment-related adverse events at the 15 mg/kg dose were mild or moderate, transient, and generally did not require intervention [135]. Similarly, DYNE-101 demonstrated a favorable safety profile with the majority of treatment-emergent adverse events being mild or moderate and no related serious adverse events identified across 56 patients [140]. This promising safety profile supports continued development and dose escalation of these therapeutic candidates.
Experimental Protocols for Splicing Analysis
Splicing Assessment Methodologies
Accurate quantification of splicing correction is essential for evaluating therapeutic efficacy. The following experimental protocols represent state-of-the-art methodologies for assessing splicing patterns in both preclinical and clinical settings:
RNA Sequencing and Splicing Analysis
- Sample Collection: Obtain muscle tissue biopsies (e.g., from biceps or tibialis anterior) at baseline and post-treatment timepoints (e.g., 28 days and 16 weeks following ASO administration) [135].
- RNA Extraction: Homogenize tissue samples in TRIzol reagent followed by RNA purification using silica membrane columns. Assess RNA integrity using an Agilent Bioanalyzer (RIN > 8.0 required).
- Library Preparation and Sequencing: Deplete ribosomal RNA using targeted probes. Convert RNA to cDNA using reverse transcriptase with random hexamer primers. Prepare sequencing libraries using Illumina TruSeq kits and perform paired-end sequencing (2 × 150 bp) on Illumina NovaSeq platform to a depth of 50-100 million reads per sample.
- Bioinformatic Analysis: Align sequencing reads to the reference genome (GRCh38) using STAR aligner. Quantify exon inclusion levels using rMATS or MAJIQ algorithms. Compute percent spliced in (PSI) values for each alternative splicing event. Compare PSI values between pre- and post-treatment samples to quantify splicing correction.
Multiplex PCR Panels for Targeted Splicing Assessment
- Panel Design: Select a panel of genes with known splicing defects in the target disease (e.g., 22-gene panel for DM1) [135] [140].
- Reverse Transcription PCR: Convert RNA to cDNA using gene-specific primers or random hexamers. Perform PCR amplification with fluorescently labeled primers.
- Capillary Electrophoresis: Separate PCR products by size using capillary electrophoresis on an ABI 3730xl DNA Analyzer.
- Data Analysis: Quantify peak areas corresponding to different splice variants. Calculate the ratio of correctly spliced to incorrectly spliced isoforms. Express splicing correction as the percentage change from baseline.
Functional Outcome Measures
While splicing correction serves as a key biomarker, functional outcomes provide critical evidence of clinical benefit. Standardized functional assessments for neuromuscular disorders include:
- Video Hand Opening Time (vHOT): Quantifies myotonia by measuring the time required to fully open the hand from a clenched fist position [136] [140].
- Quantitative Muscle Testing (QMT): Assesses muscle strength using computerized dynamometry for specific muscle groups.
- 10-Meter Walk/Run Test (10MWR): Evaluates mobility and gait velocity.
- 5 Times Sit to Stand Test (5xSTS): Measures lower extremity strength and functional mobility.
- Myotonic Dystrophy Health Index (MDHI): Patient-reported outcome measure that assesses disease burden across multiple domains [140].
The integration of splicing biomarkers with functional outcomes strengthens the validation of splicing correction as a surrogate endpoint for accelerated drug approval, as demonstrated by the U.S. FDA's granting of Breakthrough Therapy Designation to DYNE-101 for DM1 [136].
Research Reagent Solutions
The following table provides essential research reagents and their applications in splicing correction studies:
Table 2: Essential Research Reagents for Splicing Correction Studies
| Reagent/Category | Specific Examples | Function/Application | Experimental Context |
|---|---|---|---|
| Long-read Sequencing Platforms | Pacific Biosciences Sequel II, Oxford Nanopore PromethION | Comprehensive characterization of full-length transcript isoforms, identification of novel splicing variants | Population-scale splicing maps (IsoIBD Project, Project JAGUAR) [51] |
| Splicing-focused Gene Panels | 22-gene panel for DM1 (CASI-22) | Targeted assessment of disease-relevant splicing events, clinical trial biomarker | Phase 1/2 ACHIEVE trial (DYNE-101), FREEDOM-DM1 trial (PGN-EDODM1) [135] [140] |
| Cell-Penetrating Peptides | PepGen EDO peptides | Enhance oligonucleotide delivery to muscle and central nervous system | PGN-EDODM1 clinical development [135] [139] |
| Transferrin Receptor-Binding Antibodies | Dyne FORCE platform Fab fragments | Facilitate receptor-mediated endocytosis into muscle cells | DYNE-101 and DYNE-251 clinical programs [136] [140] |
| Splicing Reporters | Mini-gene constructs with alternative exons | High-throughput screening of ASO candidates, mechanistic studies | Preclinical target validation (e.g., UNC13A splicing reporters) [137] |
The field of splicing correction therapies for neuromuscular disorders has progressed remarkably from conceptual framework to clinical validation in a relatively short timeframe. Current ASO platforms have demonstrated unprecedented levels of splicing correction in clinical trials, with PGN-EDODM1 achieving >50% mean splicing correction following a single administration [135] [139]. The concurrent development of sophisticated delivery technologies has addressed the historic challenge of achieving therapeutic oligonucleotide concentrations in target tissues, particularly skeletal and cardiac muscle.
Future directions in the field include optimizing dosing regimens to maximize durability of response, developing combinatorial approaches that target multiple disease mechanisms simultaneously, and expanding the application of splicing correction to a broader spectrum of neuromuscular conditions. The ongoing refinement of biomarkers, including both molecular splicing endpoints and functional outcomes, will facilitate more efficient clinical development and regulatory approval pathways. As research continues to elucidate the complexity of splicing regulation in neuromuscular systems, the potential for transformative therapies that address the root cause of these devastating disorders becomes increasingly attainable.
Clinical Validation and Cross-Species Comparative Analysis
Experimental Validation of Predicted Splicing Events
The accurate validation of predicted splicing events is a critical pillar in the broader study of alternative splicing and protein diversity mechanisms. It is estimated that 15–30% of all disease-causing mutations may affect RNA splicing, underscoring the vital role of robust validation protocols in both diagnostic and therapeutic development [16]. These variants can disrupt canonical splice sites, activate cryptic sites, or alter regulatory elements within splicing enhancers or silencers, leading to a spectrum of aberrant splicing outcomes [16]. The clinical significance is profound, as demonstrated by RNA-targeted therapeutics like nusinersen for spinal muscular atrophy, which functions by correcting aberrant splicing [51] [16]. This guide provides an in-depth technical framework for researchers and drug development professionals to design and interpret experiments that move from in silico prediction to functional validation, thereby bridging computational genomics and clinical application.
The Validation Workflow: From Prediction to Functional Confirmation
The process of validating a predicted splicing event is a multi-stage endeavor, progressing from computational assessment to functional confirmation. The diagram below outlines the core logical workflow.
Computational Prediction and Database Interrogation
Before initiating wet-lab experiments, the putative splice-altering variant must be prioritized using in silico tools and existing knowledgebases. Frameworks like KATMAP (Knockdown Activity and Target Models from Additive regression Predictions) can predict a splicing factor's likely targets by integrating RNA-seq data from perturbation experiments with known binding motif information [141]. A crucial first step is to interrogate resources like SpliceVarDB, a comprehensive database that consolidates experimental evidence for over 50,000 variants across more than 8,000 human genes [75]. This can prevent duplication of effort and provide a curated set of positive and negative controls for assay development.
Key Experimental Methodologies and Protocols
Several established and emerging experimental methods are available for validating the impact of a genetic variant on splicing. The choice of method depends on the research question, available resources, and biological context.
Main Validation Assays
Patient-Derived RNA Analysis
This method directly assays the endogenous transcript from a biologically relevant tissue or cell source.
- Protocol: RNA is extracted from patient samples and reverse-transcribed into cDNA. This cDNA is then amplified via PCR using primers flanking the exon of interest. The resulting products are separated by gel electrophoresis to visualize shifts in product size (e.g., larger bands indicating intron retention, smaller bands indicating exon skipping). Bands of interest are excised and subjected to Sanger sequencing to determine the exact exon-intron architecture [75].
- Data Interpretation: The relative abundance of wild-type versus aberrantly spliced products is quantified. The presence of a truncated or extended product in the patient sample that is absent in controls confirms the splicing defect.
- Considerations: This method reflects the native genomic and cellular context but requires access to relevant patient tissue. A major limitation is that nonsense-mediated mRNA decay (NMD) can degrade transcripts containing premature termination codons (PTCs), masking the detection of the aberrant splice variant [75] [142]. Treating cells with an NMD inhibitor (e.g., cycloheximide) prior to RNA extraction can stabilize these transcripts for detection.
Minigene (Hybrid) Assay
The minigene assay is a versatile and widely used method to test the splicing effect of a variant in an isolated context, independent of patient tissue.
- Protocol: A genomic fragment spanning the exon of interest and its flanking introns (a few hundred base pairs on each side) is cloned into an exogenous reporter vector between two constitutive exons. The variant is introduced into this minigene construct via site-directed mutagenesis. Both wild-type and mutant minigenes are transfected into an immortalized cell line such as HEK293T. After 24-48 hours, RNA is harvested, and the splicing pattern of the reporter transcript is analyzed by RT-PCR and sequencing [75].
- Data Interpretation: A difference in the splicing pattern (e.g., a shift from a single band to multiple bands) between the wild-type and mutant constructs demonstrates the variant's direct impact on splicing.
- Considerations: This assay is particularly useful for validating variants in inaccessible tissues (e.g., brain) and for high-throughput screening. However, it may not fully recapitulate the native chromatin environment or gene-specific regulatory landscapes. Recent innovations allow these to be performed at scale with massively parallel reporter assays (MPRAs) [75].
RNA-Sequencing for Genome-Wide Discovery
While targeted methods are ideal for validation, RNA-sequencing (RNA-seq) is powerful for both discovery and validation.
- Protocol: High-quality RNA is converted into a sequencing library. Long-read sequencing technologies (e.g., from Pacific Biosciences) are particularly advantageous as they span thousands of base pairs in a single pass, providing a more complete picture of RNA structures and variations with greater certainty about the full-length transcript isoform [51].
- Data Interpretation: Specialized computational tools (e.g., Whippet) are used to align sequencing reads and quantify splicing events. Metrics like Percent Spliced In (PSI or Psi)—the proportion of reads that include a particular exon or splicing event—are calculated. Statistical significance is typically determined by an adjusted P-value < 0.05 and a |DeltaPsi| > 0.1 [142].
- Considerations: RNA-seq can be resource-intensive but provides an unbiased, transcriptome-wide view. It is instrumental in identifying novel splicing events in disease contexts, such as the predominance of non-exon skipping events associated with sepsis mortality states [142].
Quantitative Data from Experimental Studies
The following table summarizes key quantitative findings from recent splicing validation studies, illustrating the scale and outcomes of such efforts.
Table 1: Quantitative Summary of Splicing Validation Data from Recent Research
| Study / Resource | Validation Scale | Key Quantitative Findings | Primary Method(s) |
|---|---|---|---|
| SpliceVarDB [75] | >50,000 variants in >8,000 genes | - 25% classified as "splice-altering"- ~25% classified as "not splice-altering"- ~50% as "low-frequency splice-altering"- 55% of splice-altering variants were outside canonical splice sites | Consolidation from >500 published data sources (Minigene, RT-PCR, RNA-seq) |
| Sepsis NMD Study [142] | 220,779 splicing events analyzed from patient RNA-seq | - 2,158 (1%) were significantly differentially frequent in sepsis- 47% more frequent, 53% less frequent in sepsis vs control | Whole-blood, deep RNA-sequencing (non-polyA selected) |
| IsoIBD Project [51] | Population-scale long-read sequencing of IBD patients | Aims to build the first population-scale maps of alternative splicing in disease-relevant tissues | Pacific Biosciences long-read sequencing |
The Scientist's Toolkit: Essential Research Reagents
A successful splicing validation pipeline relies on a suite of key reagents and tools. The following table details these essential components.
Table 2: Key Research Reagent Solutions for Splicing Validation
| Reagent / Solution | Function and Application in Splicing Validation |
|---|---|
| HEK293T Cell Line | A standard, highly transfertable immortalized cell line used for minigene assays to study variant effects in a controlled environment [75]. |
| Reporter Vectors (e.g., pCAS2, pSpliceExpress) | Specialized plasmids designed for minigene assays, containing multiple cloning sites flanked by constitutive exons to capture the splicing pattern of the cloned genomic fragment [75]. |
| NMD Inhibitors (e.g., Cycloheximide) | Used to treat cells before RNA extraction, blocking the NMD pathway and thereby stabilizing aberrant transcripts with PTCs for more reliable detection [75] [142]. |
| Pacific Biosciences Sequel IIe / Revio Systems | Long-read sequencing platforms that enable full-length transcript isoform sequencing, overcoming the limitations of short-read assemblies for complex splicing analysis [51]. |
| SpliceVec | A benchmarked set of positive and negative control minigene constructs used to calibrate and validate laboratory splicing assays [16]. |
| KATMAP Computational Framework | An interpretable model that predicts splicing factor targets from perturbation data, useful for guiding experimental work on splicing regulation [141]. |
The experimental validation of predicted splicing events is a non-negotiable step in elucidating the mechanisms of protein diversity and diagnosing genetic diseases. As the field progresses, the integration of comprehensive databases like SpliceVarDB, advanced long-read transcriptomics, and scalable functional assays will continue to enhance the accuracy and efficiency of this process. This rigorous approach is foundational to the future of precision medicine, enabling the reclassification of variants of uncertain significance and uncovering novel targets for RNA-targeted therapeutic interventions [51] [75] [16].
RNA splicing is an essential biological process where non-coding introns are removed from precursor messenger RNA (pre-mRNA), and coding exons are joined together to form mature mRNA. This process is orchestrated by a complex macromolecular machine known as the spliceosome, which recognizes specific sequence elements at exon-intron boundaries, including the 5' splice site (5'ss), 3' splice site (3'ss), branch point sequence (BPS), and polypyrimidine tract (PPT) [143] [144]. When this precisely regulated process is disrupted, it can lead to a variety of human diseases. It is now estimated that 15-30% of all disease-causing mutations disrupt normal pre-mRNA splicing, contributing to both rare genetic disorders and common cancers [143] [16]. These splice-altering variants represent a significant but historically underrecognized category of pathogenic mutations that elude conventional diagnostic workflows focused primarily on protein-coding sequences.
The clinical significance of splicing disruptions is further underscored by the emergence of RNA-targeted therapies. Drugs such as nusinersen for spinal muscular atrophy and eteplirsen for Duchenne muscular dystrophy demonstrate how understanding and targeting splicing defects can yield effective treatments [16]. This whitepaper examines key case studies of splicing defects in both genetic diseases and cancer, providing researchers with structured data, experimental methodologies, and visual frameworks to advance research in this critical area of molecular medicine.
Molecular Mechanisms of Splicing Defects
Core Splicing Machinery and Regulatory Elements
The major spliceosome, consisting of five small nuclear ribonucleoproteins (U1, U2, U4, U5, and U6 snRNPs), assembles stepwise on pre-mRNA through complexes E, A, B, B*, and C to execute the splicing reaction [144]. Splicing fidelity depends on both core splice site recognition and auxiliary regulatory elements. Cis-regulatory elements include exonic splicing enhancers/silencers (ESEs/ESSs) and intronic splicing enhancers/silencers (ISEs/ISSs), which are recognized by trans-acting factors such as serine/arginine-rich (SR) proteins and heterogeneous nuclear ribonucleoproteins (hnRNPs) that promote or repress splice site recognition, respectively [3] [2].
Common Types of Aberrant Splicing
Genetic variants can disrupt normal splicing through multiple mechanisms, with the following outcomes representing the most prevalent types of aberrations:
- Exon Skipping: Complete omission of an exon from the mature transcript
- Intron Retention: Failure to remove an intron, often introducing premature termination codons
- Cryptic Splice Site Usage: Activation of non-canonical splice sites within exons or introns
- Alternative 5' or 3' Splice Site Usage: Shift in the boundaries of exon inclusion [143] [16]
Different mutation types can produce these aberrations. While canonical splice site mutations that disrupt the highly conserved GT-AG dinucleotides are most well-characterized, growing evidence indicates that deep intronic, synonymous, and regulatory variants can equally disrupt splicing by altering splicing enhancer/silencer elements or creating new splice sites [16].
Table 1: Types of Aberrant Splicing and Their Consequences
| Splicing Aberration | Molecular Consequence | Potential Impact on Protein |
|---|---|---|
| Exon Skipping | In-frame or frameshift deletion of amino acids | Loss of functional domains, truncated protein |
| Intron Retention | Introduction of PTCs or in-frame insertion | NMD targeting, elongated protein with novel sequences |
| Cryptic Splice Site Usage | Partial exon deletion/intron inclusion | Frameshift, partial domain loss |
| Alternative 5'/3' Splice Site | Extended or shortened exons | In-frame insertion/deletion, modified domain structure |
Case Studies in Genetic Diseases
Duchenne Muscular Dystrophy (DMD)
Duchenne muscular dystrophy represents a paradigm for splicing defects in genetic disorders. A case study documented a 4-year-old boy with classic DMD presentation including progressive muscle weakness, elevated serum creatine kinase (>11,000 U/L), and gait abnormalities. Genetic analysis revealed a novel hemizygous mutation in the DMD gene: c.5912_5922+19delinsATGTATG [145].
Experimental Validation: Researchers employed a minigene splicing assay to validate the pathogenic effect of this variant. The wild-type and mutant genomic fragments encompassing exon 40, intron 40, exon 41, and partial intron 41 were cloned into an expression vector. After transfection into COS7 cells and RT-PCR analysis, the mutant construct demonstrated aberrant splicing with:
- 11 bp deletion in exon 41 (TTGCACAAATT)
- 12 bp retention from intron 41 (ATGTATGCCCAC) [145]
This splicing alteration caused a frameshift predicted to lead to a truncated, non-functional dystrophin protein, confirming the mutation's pathogenicity and enabling precise genetic diagnosis and preimplantation genetic diagnosis for the family.
Global Developmental Delay with Cerebellar Atrophy
In a study of rare neurodevelopmental disorders, a point mutation (c.287-1G>A) affecting the 3' splice site of EMC1 intron 3 was identified in a patient with severe global developmental delay and progressive cerebellar atrophy. RT-PCR analysis of patient skeletal muscle revealed this single mutation induced multiple splicing abnormalities:
- Skipping of exon 4
- Retention of intron 3
- Activation of two different cryptic 3' splice sites (one in intron 3 resulting in 91 bp insertion, one in exon 4 resulting in 24 bp deletion) [143]
This case illustrates how a single splice-site mutation can produce complex, heterogeneous splicing outcomes that collectively contribute to disease pathogenesis.
Table 2: Documented Splicing Mutations in Rare Genetic Diseases
| Disease | Gene | Mutation | Splicing Effect |
|---|---|---|---|
| Proximal Myopathy [143] | MYH2 | c.5673+1G>C | Exon 39 skipping |
| Dilated Cardiomyopathy [143] | LMNA | c.356+1G>A | Cryptic 5'ss usage in exon 1, 32 bp deletion |
| Lynch Syndrome [143] | MSH2 | c.1661+2T>G | Exon 10 skipping; Cryptic 5'ss usage |
| Werner Syndrome [143] | WRN | c.2732+5G>A | Exon 22 skipping |
| Muscular Dystrophy [143] | POPDC3 | c.486-1G>A | Cryptic 3'ss usage in exon 3, 52 bp deletion |
Case Studies in Cancer
Splicing Factor Mutations in Hematological Malignancies
Recurrent somatic mutations in core splicing factors are a hallmark of hematological malignancies, with SF3B1 and SRSF2 representing the most frequently mutated genes [146].
SF3B1 Mutations
SF3B1 is a critical component of U2 snRNP involved in branch point recognition. Mutations in SF3B1 are found in:
- 83% of refractory anemia with ringed sideroblasts (RARS)
- 76% of refractory cytopenia with multilineage dysplasia and ringed sideroblasts (RCMD-RS)
- 15% of chronic lymphocytic leukemia (CLL) [146]
The K700E mutation accounts for approximately half of all SF3B1 mutations and promotes usage of cryptic 3' splice sites, leading to aberrant transcripts with nonsense-mediated decay or altered protein functions. In mouse models, these splicing alterations disrupt hematopoiesis and iron metabolism, specifically blocking erythroid differentiation and providing a mechanistic basis for the ringed sideroblast phenotype [146].
SRSF2 Mutations
SRSF2 belongs to the SR protein family and facilitates recognition of both 5' and 3' splice sites. Mutations occur in:
- 10% of myelodysplastic syndromes (MDS)
- 31-47% of chronic myelomonocytic leukemia (CMML)
- 2% of acute myeloid leukemia (AML) [146]
SRSF2 mutations predominantly affect proline 95 (P95), altering the protein's RNA binding specificity from both CCNG and GGNG sequences to a preferential recognition of CCNG motifs. This altered specificity induces pathogenic splicing changes, including inclusion of a premature termination codon-containing exon in EZH2, a histone methyltransferase with tumor suppressor functions in hematopoietic cells [146].
Splicing Defects in Solid Tumors
Beyond hematological malignancies, splicing factor mutations occur in solid tumors, though at lower frequencies. SF3B1 mutations are detected in approximately 3% of pancreatic cancers and 1.8% of breast cancers, while U2AF1 mutations occur in 3% of lung adenocarcinomas [146]. These mutations promote tumorigenesis by globally altering splicing patterns of cancer-related genes involved in apoptosis, cell cycle regulation, and DNA damage response.
Experimental Approaches for Studying Splicing Defects
RNA Sequencing and Bioinformatics Analysis
RNA sequencing (RNA-seq) provides a comprehensive approach for detecting splicing alterations. Analysis of split reads that map to exon-exon junctions enables identification of both annotated and novel splicing events. Recent studies utilizing RNA-seq data from >14,000 human samples across 40 tissues revealed that:
- Novel donor and acceptor junctions exceed the number of unique annotated introns by an average of 11-fold
- Over 98% of novel junctions are likely generated through inaccurate splicing rather than representing stable novel transcripts
- Splicing inaccuracies are more common at acceptor sites than donor sites [147]
This approach also enables investigation of splicing accuracy changes in disease contexts, such as the observed global decline in splicing fidelity in aging and Alzheimer's disease [147].
Minigene Splicing Assays
Minigene assays provide a controlled system for investigating the functional impact of specific variants on splicing. The experimental workflow includes:
Protocol:
- Fragment Cloning: Amplify and clone genomic fragments containing the exon of interest with flanking intronic sequences into a splicing reporter vector
- Site-Directed Mutagenesis: Introduce the candidate mutation using primers designed with the desired nucleotide change
- Cell Transfection: Transfer wild-type and mutant plasmids into mammalian cells (e.g., HEK293T, COS7)
- RNA Analysis: Extract total RNA after 24-48 hours, perform RT-PCR with vector-specific primers
- Product Resolution: Separate PCR products by agarose gel electrophoresis and quantify isoform ratios
- Sequence Verification: Purify and sequence individual bands to confirm splicing patterns [44] [145]
This approach was successfully used to validate the pathogenic effect of the DMD mutation c.5912_5922+19delinsATGTATG, demonstrating its effect on exon 41 splicing [145].
Quantitative PCR for Splice Isoform Detection
Quantitative PCR (qPCR) enables sensitive quantification of specific splice isoforms. Primer design is critical for accurate detection:
- For exon skipping events, design one primer pair that spans the exon-exon junction created by skipping and another that amplifies across the included exon
- For exon inclusion, place one primer within the variable exon and the other in the downstream constitutive exon
- Always normalize to primers that amplify all isoforms (e.g., spanning two constitutive exons) and reference genes (e.g., TBP) [44]
Table 3: Essential Research Reagents for Splicing Analysis
| Reagent/Assay | Specific Examples | Application & Function |
|---|---|---|
| Splicing Reporter Vectors | CD44 v8 minigene [145] | Context to test variant effect on exon inclusion |
| Splicing Factor Expression Plasmids | hnRNPM plasmid [44] | Overexpression to assess trans-acting factor effects |
| RNA Extraction Kits | E.Z.N.A. Total RNA Kit [44] | High-quality RNA isolation essential for splicing analysis |
| Reverse Transcriptase | GoScript Reverse Transcriptase [44] | cDNA synthesis from RNA templates |
| qPCR Master Mix | GoTaq Green Master Mix [44] | Quantitative amplification of specific splice isoforms |
| Cell Lines | HEK293T, COS7 [44] [145] | Heterologous system for minigene transfection |
Therapeutic Approaches Targeting Splicing Defects
The recognition of splicing defects as a key disease mechanism has spurred development of novel therapeutic strategies:
Splice-Switching Antisense Oligonucleotides (SSOs)
SSOs are short, synthetic oligonucleotides that bind to specific sequences in pre-mRNA and modulate splicing by blocking access to splicing regulatory elements. FDA-approved SSOs include:
- Nusinersen (Spinraza): Targets SMN2 pre-mRNA to promote inclusion of exon 7, compensating for SMN1 loss in spinal muscular atrophy [16]
- Eteplirsen (Exondys 51): Skips DMD exon 51 to restore the reading frame in specific Duchenne muscular dystrophy mutations [16]
Small Molecule Splicing Modulators
Small molecules that target the spliceosome represent another promising approach. Spliceostatin A and FR901464 derivatives inhibit SF3B1 and have shown preclinical efficacy in splicing factor-mutant cancers [146]. These compounds generally work by stabilizing early spliceosomal complexes and impairing the catalytic steps of splicing.
Challenges and Future Directions
Despite these advances, several challenges remain in targeting splicing defects therapeutically. Tissue-specific delivery of SSOs, off-target effects of small molecule modulators, and the complexity of predicting splicing outcomes present significant hurdles. Future research should focus on developing more specific splicing modulators, improving delivery methods, and understanding how combinatorial approaches might maximize therapeutic efficacy while minimizing toxicity.
Splicing defects represent a clinically significant class of mutations underlying both rare genetic diseases and common cancers. Advancements in RNA sequencing technologies, computational prediction tools, and functional validation assays have dramatically improved our ability to identify and characterize these variants. The case studies presented herein illustrate both the diversity of splicing disruption mechanisms and the potential for RNA-targeted therapeutic interventions. As our understanding of splicing regulation continues to deepen, and as technologies for manipulating RNA processing advance, the prospect of developing effective precision medicines targeting splicing defects grows increasingly promising. For research and drug development professionals, integrating splicing analysis into variant interpretation pipelines and therapeutic development strategies will be essential for advancing molecular medicine and addressing this underrecognized category of disease-causing mutations.
Visualizations
Splicing Analysis Workflow
Spliceosomal Assembly and Mutation Sites
Comparative Genomics of Splicing Regulation Across Species
Alternative splicing (AS) is a fundamental post-transcriptional process that enables a single gene to generate multiple mRNA isoforms, dramatically increasing transcriptomic and proteomic diversity. This mechanism is pivotal for functional specialization, cellular differentiation, and adaptation across diverse organisms. Within the broader context of research on alternative splicing and protein diversity mechanisms, comparative genomics provides a powerful lens through which to decipher the evolutionary dynamics and regulatory principles governing splicing across the tree of life. By examining splicing patterns, regulatory elements, and genomic architectures across species, researchers can distinguish conserved core mechanisms from lineage-specific innovations, uncovering how splicing contributes to biological complexity and disease. This technical guide synthesizes current knowledge and methodologies in the comparative genomics of splicing regulation for a specialized audience of researchers, scientists, and drug development professionals.
Evolutionary Landscape of Alternative Splicing
Variation Across the Tree of Life
Large-scale comparative analyses reveal that alternative splicing is not uniformly distributed across taxa but exhibits remarkable variation that correlates with organismal complexity. A groundbreaking study examining 1494 species spanning the entire tree of life introduced a novel genome-scale metric, the Alternative Splicing Ratio (ASR), which quantifies the average number of distinct transcripts generated per coding sequence, enabling robust cross-species comparisons [41].
Table 1: Alternative Splicing Distribution Across Major Lineages
| Taxonomic Group | Alternative Splicing Level | Genomic Architecture Features | Key Observations |
|---|---|---|---|
| Prokaryotes | Minimal | Compact genomes, minimal introns | Limited splicing machinery |
| Unicellular Eukaryotes | Low | Moderate intron content | Basic splicing regulation |
| Plants | Moderate | High variability in coding content | Compensation via gene duplication and transposable elements |
| Invertebrates | Intermediate | Intron-rich genomes | Developing complexity in splicing regulation |
| Birds & Mammals | Highest | ~50% intergenic DNA; conserved intron-rich architecture | Highest transcript diversity; considerable interspecies divergence |
The findings demonstrate that while unicellular eukaryotes and prokaryotes display minimal splicing activity, mammals and birds exhibit the highest levels of alternative splicing. Despite sharing a conserved intron-rich genomic architecture, mammals and birds show considerable interspecies divergence in splicing activity, suggesting relatively rapid evolution of splicing regulation in these lineages [41]. Plants display moderate alternative splicing levels but exhibit high variability in genomic composition, often compensating through gene duplication and genome expansion via transposable elements [41].
Genomic Correlates of Splicing Diversity
A strong negative correlation exists between alternative splicing and the proportion of coding content in genes, with the highest levels of alternative splicing observed in genomes containing approximately 50% intergenic DNA [41]. This relationship highlights the importance of non-coding genomic regions in the evolutionary development of alternative splicing. The expansion of these regions, often through whole-genome duplications and repetitive element accumulation, creates additional opportunities for splice site recognition and regulation [41].
In plants, which have undergone multiple whole-genome duplication events, duplicated genes frequently undergo subfunctionalization, whereby they evolve different splicing isoforms to fulfill distinct functional roles, thereby increasing alternative splicing diversity [41]. Another major factor influencing alternative splicing in plants is the expansion of transposable elements, particularly retrotransposons, which significantly contribute to genome size and structural variation [41].
Mechanisms of Splicing Regulation: Evolutionary Perspectives
Cis-Acting Elements and Trans-Acting Factors
Alternative splicing is regulated through complex interactions between cis-acting elements (specific nucleotide sequences in pre-mRNA) and trans-acting factors (RNA-binding proteins that recognize these sequences). Cis-acting elements include exonic splicing enhancers (ESEs), exonic splicing silencers (ESSs), intronic splicing enhancers (ISEs), and intronic splicing silencers (ISSs) [3] [2]. These elements are recognized by trans-acting factors, primarily RNA-binding proteins (RBPs) such as serine/arginine-rich (SR) proteins and heterogeneous nuclear ribonucleoproteins (hnRNPs), which promote or suppress splice site recognition [3] [2].
Comparative genomics studies have revealed that intronic sequences flanking alternative exons show higher conservation than other intronic regions, suggesting selective pressure maintaining regulatory elements. Research in nematodes identified 147 alternatively spliced cassette exons with short regions of high nucleotide conservation in flanking introns, many containing known mammalian splicing regulatory sequences like (T)GCATG, indicating deep evolutionary conservation of splicing regulatory mechanisms [148].
Chromatin-Mediated Splicing Regulation
In higher eukaryotes, splicing occurs co-transcriptionally, while the nascent RNA is still tethered to the DNA template, enabling functional coupling between transcription and splicing [149]. This coupling allows chromatin structure to influence splicing decisions through several mechanisms:
- Nucleosome Positioning: Exons show higher nucleosome occupancy than introns, with nucleosomes often positioned according to exon-intron boundaries, potentially aiding exon definition by the spliceosome [149].
- Histone Modifications: Specific histone marks are enriched in exonic regions and can influence splice site selection by recruiting splicing factors or modulating RNA polymerase II elongation rates.
- DNA Methylation: Exonic DNA shows elevated methylation levels compared to intronic sequences, providing an additional layer of splicing regulation [149].
The kinetic model of splicing regulation proposes that the rate of RNA polymerase II elongation significantly impacts alternative splicing decisions; slower elongation promotes inclusion of weak exons by extending the time window for splice site recognition [149]. Chromatin structure modulates this elongation rate, thereby influencing splicing outcomes.
Methodological Approaches in Comparative Splicing Analysis
Computational Frameworks and Metrics
The comparative analysis of splicing regulation requires specialized computational approaches that can handle cross-species comparisons while accounting for technical biases. The Alternative Splicing Ratio (ASR) represents one such metric, designed as a genome-scale measure that quantifies the extent to which coding sequences generate multiple mRNA transcripts via alternative splicing [41]. This metric can be computed from high-quality annotation files and normalized (ASR*) to correct for annotation-related biases introduced by differences in sequencing depth, tissue diversity, assembly quality, and computational gene prediction [41].
Advanced computational tools like KATMAP (Knockdown Activity and Target Models from Additive Regression Predictions) provide a framework for inferring splicing factor activity from perturbation experiments [150]. This interpretable regression model analyzes splicing changes throughout the transcriptome by modeling alterations in splicing factor binding and the resulting changes in RNA processing, helping distinguish direct targets from indirect effects [150].
Table 2: Key Computational Tools for Comparative Splicing Analysis
| Tool/Method | Primary Function | Input Requirements | Output/Application |
|---|---|---|---|
| ASR Metric | Cross-species splicing comparison | Genome annotation files | Quantified transcript diversity across species |
| KATMAP | Splicing factor activity inference | SF perturbation RNA-seq data + binding motif | Position-specific regulatory activity; predicted targets |
| WABA Alignment | Cross-species genomic alignment | Two related genomes | Identification of conserved non-coding regions |
| dN/dS Analysis | Evolutionary selection pressure | Orthologous exon sequences | Detection of purifying or positive selection on exons |
Experimental Validation Protocols
Computational predictions require experimental validation to confirm regulatory functions. Several established protocols enable this confirmation:
Mini-Gene Splicing Assays: This approach involves cloning genomic fragments containing the alternative exon and its flanking introns into an expression vector, followed by site-directed mutagenesis of putative regulatory elements and transfection into appropriate cell lines [151]. Splicing patterns are then analyzed via RT-PCR to determine the effect of mutations on alternative splicing decisions [151].
Conserved Element Mutagenesis: Based on comparative genomics findings, this protocol involves identifying conserved intronic elements through genomic alignments of related species (e.g., Caenorhabditis elegans and C. briggsae), followed by systematic mutagenesis of these elements in model systems like nematodes to assess their impact on splicing regulation [148].
Crosslinking and Immunoprecipitation (CLIP): This method identifies direct binding sites of RNA-binding proteins on transcripts, validating predictions of splicing factor targets and providing data for refining computational models [150].
Case Studies in Comparative Splicing Analysis
RNF180 Gene Evolution Across Vertebrates
A comprehensive analysis of the RNF180 tumor suppressor gene across 23 vertebrate species provides a detailed case study in the evolutionary dynamics of alternative splicing. This research integrated multiple comparative genomics approaches, including:
- Amino Acid Sequence Conservation: Analysis revealed that the zinc finger structure, responsible for major ubiquitination functions, was highly conserved across species, while exon 5 was absent in many lineages [152].
- Evolutionary Selection Pressure: The dN/dS ratio (ω) analysis showed that exons 7 and 8 were under positive selection (ω > 1), while exon 6, encoding the zinc finger domain, was under strong purifying selection (ω = 0.16) [152].
- Intronic Sequence Conservation: Comparisons of corresponding intron sequences revealed high similarity around exon 5, suggesting potential regulatory functions [152].
This multifaceted approach demonstrated how comparative genomics can elucidate the relationship between gene structure, function, and evolution while revealing complex alternative splicing patterns maintained across diverse species.
Plant vs. Animal Splicing Strategies
Comparative analyses between plants and animals reveal both conserved and divergent strategies in splicing regulation. While both kingdoms utilize alternative splicing to enhance proteomic diversity, they exhibit distinct characteristic:
Table 3: Key Differences in Plant vs. Animal Splicing
| Feature | Plants | Animals |
|---|---|---|
| Predominant AS Type | Intron Retention (IR) | Exon Skipping (ES) |
| Genomic Architecture | Often large, complex genomes with whole-genome duplications | More consistent genome size with ~50% intergenic DNA |
| Response to Stress | Extensive AS rewiring under abiotic/biotic stress | More developmental and tissue-specific regulation |
| Spliceosome Machinery | Less characterized; unique adaptations suspected | Well-characterized with in vitro systems available |
In plants, intron retention is the predominant form of alternative splicing, affecting approximately 70% of multi-exon genes, whereas exon skipping predominates in humans [30]. Retained introns in plants often introduce premature termination codons, targeting transcripts for nonsense-mediated decay, thus providing a mechanism for post-transcriptional regulation of gene expression [30].
Research Reagents and Experimental Tools
Table 4: Essential Research Reagents for Splicing Regulation Studies
| Reagent/Tool | Function/Application | Examples/Notes |
|---|---|---|
| Mini-Gene Reporter Vectors | Functional analysis of splicing regulatory elements | pEGFP-N1 with cloned genomic fragments [151] |
| Position-Weight Matrices (PWMs) | Representing splicing factor binding specificity | Derived from in vitro binding data or eCLIP [150] |
| Splicing Factor Perturbation Resources | Knockdown/overexpression studies | siRNA, shRNA libraries; CRISPR/Cas9 tools |
| Multiple Sequence Alignment Tools | Identifying conserved regulatory elements | ClustalX, MEGA7 for phylogenetic analysis [152] |
| Crosslinking & Immunoprecipitation Kits | Mapping protein-RNA interactions | eCLIP protocols for splicing factors [150] |
Signaling Pathways and Regulatory Networks
The following diagram illustrates the integrated regulatory network governing alternative splicing across species, incorporating insights from comparative genomics studies:
Splicing Regulation Network
This network illustrates how genomic architecture constrains both cis-regulatory elements and chromatin environment, which together with trans-acting factors determine splicing outcomes. Comparative genomics reveals how each component evolves differently across species, with cis-elements and trans-factors typically co-evolving to maintain functional splicing regulation.
Comparative genomics has fundamentally advanced our understanding of splicing regulation evolution, revealing both deeply conserved mechanisms and lineage-specific innovations. The integration of large-scale genomic analyses with experimental validation provides a powerful framework for deciphering the complex rules governing alternative splicing across the tree of life. Future research directions will likely focus on several key areas:
First, expanding comparative analyses to encompass greater taxonomic diversity, particularly from non-model organisms, will provide a more complete picture of splicing evolution. Second, integrating multi-omics data—including epigenomic, transcriptomic, and proteomic datasets—will elucidate the functional consequences of alternative splicing across species. Third, developing more sophisticated computational models that can predict splicing outcomes from sequence and chromatin features will enhance both basic understanding and clinical applications.
For drug development professionals, these advances offer promising avenues for therapeutic intervention. Understanding the evolutionary conservation of splicing regulatory elements aids in assessing potential off-target effects of splice-switching therapies. The identification of lineage-specific splicing patterns may reveal taxon-specific vulnerabilities that can be exploited for antimicrobial development. Furthermore, insights into the splicing differences between model organisms and humans improve the translational relevance of preclinical studies.
As methods in single-cell sequencing, long-read technologies, and genome engineering continue to advance, comparative genomics will undoubtedly yield deeper insights into the evolution and regulation of alternative splicing, ultimately enhancing our understanding of gene regulation and expanding the toolkit for therapeutic development.
Structural and Functional Comparison of Protein Isoforms
Alternative splicing (AS) of precursor messenger RNA (pre-mRNA) is a fundamental mechanism for enhancing proteomic diversity in multicellular eukaryotic organisms [3]. This process allows a single gene to produce multiple mRNA isoforms, which are then translated into distinct protein variants, or isoforms [30]. It is estimated that up to 95% of human multi-exon genes undergo alternative splicing, making it a crucial contributor to functional complexity [153] [3] [154]. While canonical isoforms are often well-characterized, understanding the structural and functional consequences of alternative protein isoforms remains a central challenge in molecular biology [153]. This guide synthesizes current methodologies and findings to provide a framework for the systematic comparison of protein isoforms, with a focus on implications for research and therapeutic development.
Alternative Splicing Mechanisms and Isoform Classification
Fundamental Splicing Mechanisms
Alternative splicing is mediated by a dynamic macromolecular machine known as the spliceosome, which consists of five small nuclear ribonucleoprotein particles (snRNPs) and numerous associated proteins [3] [30]. The spliceosome recognizes conserved cis-acting elements within the pre-mRNA, including the 5' splice site, the 3' splice site, the branch point sequence, and the polypyrimidine tract [3]. The specific exons included in the mature mRNA are determined by the interplay between these cis-acting elements and trans-acting factors, such as serine/arginine-rich (SR) proteins and heterogeneous nuclear ribonucleoproteins (hnRNPs), which act as enhancers and silencers of splicing, respectively [3] [30].
Major Types of Alternative Splicing Events
The table below summarizes the primary patterns of alternative splicing observed in eukaryotic genes, with notable differences in prevalence between plants and animals.
Table 1: Major Types of Alternative Splicing Events and Their Frequencies
| Splicing Type | Description | Approx. Frequency in Humans | Approx. Frequency in Plants |
|---|---|---|---|
| Exon Skipping (ES) | An exon is spliced out of the transcript. | ~30% (Predominant) [3] [30] | Less common [30] |
| Intron Retention (IR) | An intron remains in the mature mRNA. | Less common, often in UTRs [3] | ~70% (Predominant) [30] |
| Alternative 5' Splice Site | Use of different donor splice sites within an exon. | ~25% (combined) [3] | Information missing |
| Alternative 3' Splice Site | Use of different acceptor splice sites within an exon. | ~25% (combined) [3] | Information missing |
| Mutually Exclusive Exons | Only one of two adjacent exons is retained. | Information missing | Information missing |
A key difference between kingdoms is that exon skipping is the most common type in humans, whereas intron retention predominates in plants [30]. In humans, retained introns are often found in untranslated regions (UTRs) and can be associated with nonsense-mediated decay (NMD) [3].
From mRNA to Protein Isoforms
The different mRNA isoforms generated through AS are translated into protein isoforms. These isoforms can vary in their amino acid sequence, which in turn can affect their structure, function, subcellular localization, stability, and interaction partners [153] [46]. A significant challenge in the field is confirming which mRNA isoforms are actually translated into stable proteins, as not all predicted splice variants are expressed at the protein level [153] [154].
Methodologies for Structural Analysis of Isoforms
Computational Structure Prediction
The advent of highly accurate neural network-based structure prediction tools like AlphaFold2 has revolutionized the large-scale analysis of protein isoforms [153] [46]. This approach allows researchers to model the three-dimensional structures of thousands of isoforms in silico, bypassing the time-consuming and resource-intensive process of experimental structure determination.
Table 2: Computational Tools for Isoform Analysis
| Tool Name | Primary Function | Application in Isoform Analysis |
|---|---|---|
| AlphaFold2 [153] [46] | Protein structure prediction from sequence | Predicts 3D structures of alternative isoforms for comparison with canonical structures. |
| TAPASS [153] | Pipeline for structural state annotation | Annotates structured domains, intrinsically disordered regions (IDRs), transmembrane regions, and aggregation-prone regions. |
| Local BLASTP [153] | Sequence similarity search | Identifies conserved domains and filters isoforms for structural analysis based on evolutionary conservation. |
A critical consideration when using AlphaFold2 is that the quality of predictions, as measured by the predicted local distance difference test (pLDDT), can be lower for alternative splicing regions due to reduced depth of multiple sequence alignments (MSAs) for these variable segments [46]. Therefore, pLDDT scores should be used to filter out low-confidence predictions before analysis [46].
Figure 1: Computational workflow for structural comparison of protein isoforms, from sequence to functional analysis.
Experimental Proteomics and Mass Spectrometry
Mass spectrometry (MS)-based proteomics is the primary experimental method for detecting and quantifying protein isoforms. It provides physical evidence for the existence of isoforms predicted from nucleic acid sequences [154].
Key Proteomics Workflows:
- Bottom-Up Proteomics: This is the most common strategy. Proteins are extracted and digested with an enzyme like trypsin. The resulting peptides are separated by liquid chromatography (LC) and analyzed by tandem mass spectrometry (MS/MS) [155]. Peptides unique to specific isoforms can confirm their expression.
- Top-Down Proteomics: This approach involves analyzing intact proteins by MS, allowing for the characterization of isoforms, post-translational modifications (PTMs), and structural studies without digestion. However, it requires significant amounts of biological material [155].
- Long-Read Proteogenomics: An emerging approach that combines long-read sequencing with mass spectrometry to better delineate full-length isoform diversity [156].
A major limitation of MS is that it can only identify isoforms for which unique peptides can be detected. Current proteomic data supports only a fraction of the alternatively spliced genes annotated in databases like Ensembl, leaving a sizeable gap between theoretically feasible and experimentally confirmed isoforms [154].
Quantitative Structural and Functional Impacts
Global Structural Consequences
Large-scale bioinformatics analyses and AlphaFold2 predictions have revealed systematic differences between canonical proteins and their isoforms. One study of 58 eukaryotic proteomes found that isoforms, compared to canonical sequences, have fewer signal peptides, transmembrane regions, and tandem repeat regions, which can alter protein function and cellular localization [153]. While many isoforms fold into structures highly similar to their canonical counterparts, a significant subset undergoes substantial structural rearrangements [153] [46].
Table 3: Quantified Structural Impacts of Alternative Splicing
| Structural Property | Measurement Method | Key Finding | Reference |
|---|---|---|---|
| Overall Structural Similarity | Template Matching Score | Correlates with sequence identity, but a subset of isoforms show low structural similarity despite high sequence similarity. | [46] |
| Protein Compactness | Radius of Gyration | Exon skipping and alternative last exons tend to increase the radius of gyration, making the protein less compact. | [46] |
| Surface Properties | Surface Charge Distribution | Exon skipping and alternative last exons tend to increase surface charge. | [46] |
| Post-Translational Modifications | PTM Site Accessibility | Splicing can bury or expose PTM sites, altering potential regulatory states (e.g., in BAX isoforms). | [46] |
| Domain Integrity | CATH Domain Analysis | Isoforms often have truncated or altered conserved domains, impacting function. | [153] |
Functional Implications
The structural changes induced by alternative splicing have direct functional consequences. Structure-based function prediction has identified numerous functional differences between isoforms of the same gene, with loss of function compared to the reference isoform being a predominant outcome [46]. Alternative splicing can regulate critical biological processes by altering protein-protein interaction domains, enzymatic activity, and subcellular localization signals [154] [46]. Furthermore, tissue-specific distribution of protein isoforms, revealed by quantitative proteome maps, provides insights that cannot be obtained from transcript information alone and can explain the phenotypes of genetic diseases [157].
Experimental Protocols for Key Analyses
Protocol: AlphaFold2-Based Structural Comparison
This protocol outlines the steps for computationally comparing the structures of canonical proteins and their isoforms.
Dataset Construction:
- Obtain canonical and isoform protein sequences from a curated database such as UniProt. Select isoforms that have differences located within well-conserved structured domains as defined by CATH or a similar database [153].
- Filter sequences based on criteria such as length (e.g., a maximum of 600 amino acids) and the percentage of a conserved domain that remains in the isoform (e.g., at least 70% for domains <200 aa, or 50% for domains >200 aa) [153].
Structure Prediction:
- For the canonical protein, retrieve the pre-computed structure from the AlphaFold Protein Structure Database (https://alphafold.ebi.ac.uk/) [46].
- For the alternative isoform, use the AlphaFold Colab notebook or a local installation of AlphaFold2 to predict the 3D structure based on its amino acid sequence [153] [46].
Structural Metric Calculation:
- Calculate the following metrics for both structures using bioinformatics tools like PyMOL, Biopython, or MDTraj:
- Template Matching Score (TM-score): To assess global structural similarity.
- Secondary Structure Composition: Percentage of alpha-helices, beta-sheets, and coils.
- Radius of Gyration: A measure of protein compactness.
- Surface Electrostatic Potential: To map charge distribution.
- Solvent Accessible Surface Area (SASA) of PTM sites: To determine if sites are exposed or buried [46].
- Calculate the following metrics for both structures using bioinformatics tools like PyMOL, Biopython, or MDTraj:
Analysis and Validation:
- Correlate structural differences with sequence identity.
- Filter predictions based on pLDDT scores (e.g., >70 for confident analysis) to ensure reliability, particularly for regions affected by alternative splicing [46].
- Integrate findings with expression data (e.g., from single-cell RNA-seq databases like Tabula Sapiens) to understand the biological context of specific isoforms [46].
Protocol: Proteomic Detection of Isoforms via Mass Spectrometry
This protocol describes a bottom-up proteomics workflow to detect protein isoforms.
Sample Preparation:
- Lyse cells or tissue to extract the total protein complement.
- Reduce disulfide bonds and alkylate cysteine residues.
- Digest the protein mixture into peptides using a site-specific protease like trypsin [155].
Peptide Separation and Labeling (Optional):
Mass Spectrometry Analysis:
Data Analysis and Isoform Identification:
- Search the acquired MS/MS spectra against a custom protein database that includes the sequences of all known canonical and alternative isoforms (e.g., from Ensembl or UniProt) [154].
- Use search engines like Mascot or MaxQuant to identify peptides. Set a high-confidence threshold (e.g., peptide FDR < 1%) [154].
- Identify isoforms by detecting "junction peptides" — peptides that span splice junctions and are unique to a specific isoform [154].
Table 4: Key Reagents and Resources for Isoform Research
| Resource Category | Specific Examples | Function and Application |
|---|---|---|
| Protein/Database | UniProtKB/Swiss-Prot, NCBI RefSeq, Ensembl, APPRIS, ISOexpresso [153] [154] | Provide high-quality, annotated sequences of canonical proteins and their isoforms for use in searches and analyses. |
| Proteomics | Trypsin (protease), iTRAQ/TMT Isobaric Tags, DTT/TCEP (reducing agents), Iodoacetamide (alkylating agent) [155] [154] [157] | Essential reagents for sample preparation, digestion, and labeling in mass spectrometry-based proteomics. |
| MS Search Engines | Mascot, MaxQuant, Trans-Proteomic Pipeline [155] [154] | Software to identify peptides and proteins from raw MS/MS data by searching against sequence databases. |
| Structure Prediction | AlphaFold2 (Colab or local), AlphaFold Protein Structure Database, CATH Database [153] [46] | Tools and databases for predicting and accessing high-confidence protein structures. |
| Expression Data | PeptideAtlas, Tabula Sapiens [154] [46] | Repositories of peptide identifications and single-cell RNA-seq data for validating and contextualizing isoform expression. |
Figure 2: Logical relationship from splicing to functional change, highlighting technologies for experimental and computational analysis.
Benchmarking Splicing Prediction Algorithms and Tools
Accurate prediction of splice-disruptive variants is a critical challenge in genomics, with an estimated 15–30% of all disease-causing mutations affecting RNA splicing [16]. These variants contribute significantly to rare genetic diseases, cancer, and neurodevelopmental disorders, making their identification essential for both diagnosis and therapeutic development [16] [158]. The proliferation of computational predictors has created an urgent need for comprehensive benchmarking to guide researchers and clinicians in tool selection and implementation.
This review provides an in-depth technical assessment of splicing prediction algorithms, focusing on performance characteristics across different variant types and genomic contexts. We synthesize evidence from recent large-scale benchmarking studies that utilize orthogonal validation methods, including massively parallel splicing assays (MPSAs) and saturation genome editing, to establish reliable ground-truth datasets [102] [159]. By framing this analysis within the broader context of alternative splicing and protein diversity mechanisms, we aim to equip researchers with practical guidance for implementing these tools in both basic research and clinical applications.
Performance Benchmarking of Splicing Prediction Tools
Key Splicing Prediction Algorithms
Splicing prediction tools employ diverse computational approaches, from traditional motif-based algorithms to advanced deep learning models. Motif-based tools like MaxEntScan and SpliceSiteFinder-like use position-weight matrices to score splice sites based on nucleotide frequencies [159]. Classical machine learning tools such as GeneSplicer and NNSPLICE incorporate features like k-mer scores for splice regulatory elements and evolutionary conservation [102]. Deep learning algorithms represent the current state-of-the-art, with tools like SpliceAI, Pangolin, and Splam using convolutional neural networks or transformer architectures to learn informative features directly from primary sequence data [102] [160] [161].
Recent innovations include generative AI models like TrASPr+BOS, which employs multi-transformer architecture with Bayesian optimization to predict and design RNA for tissue-specific splicing outcomes [161]. Another emerging tool, Splam, utilizes a biologically-inspired design that recognizes splice donor/acceptor sites in pairs within an 800-nucleotide window, contrasting with SpliceAI's 10,000-nucleotide requirement [160].
Comparative Performance Analysis
Benchmarking studies consistently reveal significant performance differences among splicing predictors. A 2023 evaluation of eight widely used algorithms leveraged MPSA data from 3,616 variants across five genes, providing high-resolution ground-truth measurements [102]. The study found that deep learning-based predictors trained on gene model annotations achieved the best overall performance at distinguishing disruptive and neutral variants, with SpliceAI and Pangolon showing superior sensitivity when controlling for overall call rate genome-wide [102].
A separate 2021 study benchmarked both established and deep learning tools on validated sets of noncanonical splice site (NCSS) and deep intronic (DI) variants in the ABCA4 and MYBPC3 genes [159]. Performance varied substantially across datasets, with SpliceRover performing best for ABCA4 NCSS variants, SpliceAI for ABCA4 DI variants, and the Alamut 3/4 consensus approach (integrating GeneSplicer, MaxEntScan, NNSPLICE, and SpliceSiteFinder-like) for MYBPC3 NCSS variants [159].
Table 1: Performance Comparison of Major Splicing Prediction Tools
| Tool | Algorithm Type | Key Features | Strengths | Limitations |
|---|---|---|---|---|
| SpliceAI | Deep Learning (CNN) | 10kb sequence context; predicts splice sites from sequence alone | High sensitivity; best overall performance in independent benchmarks [102] | Lower concordance for exonic variants; high computational requirements [102] |
| Pangolin | Deep Learning (CNN) | Extension of SpliceAI architecture; trained on multiple tissues and species | Tissue-specific PSI predictions; competitive performance with SpliceAI [102] | Performance varies across tissue types [161] |
| Splam | Deep Learning (CNN) | 800nt sequence context; donor/acceptor site pair recognition | Better splice junction accuracy than SpliceAI; more biologically realistic design [160] | Newer tool with less extensive validation [160] |
| MMSplice | Deep Learning | Combines HAL training data with primary sequence features | Competitive performance for specific variant types [102] | Lower overall performance than SpliceAI and Pangolin [102] |
| ConSpliceML | Meta-classifier | Combines SQUIRLS, SpliceAI, and population constraint metrics | Integrates multiple evidence types for improved specificity [102] | Performance depends on constituent algorithms [102] |
| Alamut Visual | Consensus (Multiple) | Integrates GeneSplicer, MaxEntScan, NNSPLICE, SSF-like | Best performance for MYBPC3 NCSS variants [159] | Consensus may miss variants detected by single best-performing tool [159] |
Performance Across Genomic Contexts
A critical finding across benchmarking studies is the differential performance of predictors based on variant location and type. Algorithms consistently show lower concordance with experimental measurements for exonic variants compared to intronic variants, highlighting the particular challenge of identifying missense or synonymous splice-disruptive variants (SDVs) [102]. This performance gap underscores the complexity of exonic splicing regulatory elements and the need for improved algorithms in these regions.
For variants beyond the canonical splice sites, performance remains variable. While deep learning tools generally excel, even the best-performing algorithms show substantially more modest performance in real-world clinical settings compared to developer-reported metrics [159]. For instance, SpliceAI demonstrated lower precision in clinical test sets despite reporting an area under the precision-recall curve of 0.98 during development [159].
Experimental Validation and Benchmarking Methodologies
Ground-Truth Datasets for Benchmarking
Robust benchmarking requires experimentally validated ground-truth datasets. Several approaches have emerged as gold standards:
Massively Parallel Splicing Assays (MPSAs) enable high-throughput measurement of splicing effects for thousands of variants cloned into minigene constructs [102]. These saturation screens focus on individual exons or motifs, measuring the effects of every possible point variant within each target [102]. MPSAs provide uniform coverage across exonic and intronic regions, addressing the bias toward canonical splice site mutations in clinical variant sets [102].
Saturation Genome Editing (SGE) introduces mutations into the endogenous locus via CRISPR/Cas9, with splicing outcomes measured by RNA sequencing [102]. This approach assesses variants in their native genomic context, including potential effects from chromatin structure and transcriptional kinetics.
SpliceVarDB represents a consolidated resource containing over 50,000 functionally validated variants across more than 8,000 human genes [75]. This comprehensive database classifies variants as "splice-altering" (25%), "not splice-altering" (~25%), and "low-frequency splice-altering" (~50%), with 55% of splice-altering variants located outside canonical splice sites [75].
Table 2: Experimental Methods for Splicing Validation
| Method | Throughput | Key Features | Advantages | Limitations |
|---|---|---|---|---|
| MPSAs | High (Thousands of variants) | Cloned variant libraries; deep RNA sequencing | Uniform variant coverage; minimizes canonical splice site bias [102] | May lack native genomic context [102] |
| Saturation Genome Editing | Medium-High | Endogenous editing via CRISPR/Cas9; RNA-seq | Native genomic context; includes chromatin effects [102] | More complex implementation; lower throughput than MPSAs [102] |
| Minigene/Midigene Assays | Low-Medium | Site-directed mutagenesis; RT-PCR analysis | Focused validation; well-established methodology [159] | Low throughput; may not capture all regulatory elements [159] |
| RNA-seq from Patient Tissues | Variable | Direct RNA sequencing from affected tissues | In vivo relevance; includes tissue-specific factors [75] | Tissue accessibility; nonsense-mediated decay may mask effects [75] |
Benchmarking Protocols
Standardized benchmarking protocols are essential for fair tool comparison. Key methodological considerations include:
Variant Selection and Classification: Benchmarking sets should include variants across different genomic contexts - canonical splice sites, noncanonical splice sites, deep intronic regions, and exonic regions [159] [75]. Splice-altering variants are typically defined based on quantitative thresholds, such as >20% aberrant RNA in midigene assays or specific Bayes factor thresholds in computational analyses [159] [75].
Performance Metrics: Standard classification metrics include area under the receiver operating characteristic curve (AUROC), area under the precision-recall curve (AUPRC), sensitivity, and specificity [159]. For tissue-specific predictors, performance should be evaluated across multiple tissues and conditions [161].
Cross-Species Validation: To assess generalizability beyond training data, tools should be evaluated on genetically distant species without retraining [160]. This approach tests whether algorithms have learned fundamental splicing rules rather than simply memorizing human-specific patterns.
Table 3: Essential Research Resources for Splicing Analysis
| Resource | Type | Primary Function | Application in Research |
|---|---|---|---|
| SpliceVarDB | Database | Consolidated repository of >50,000 experimentally validated splicing variants [75] | Variant interpretation; training data for algorithm development [75] |
| Splam | Prediction Tool | Deep learning-based splice site predictor with 800nt context [160] | Transcriptome assembly; splice junction annotation [160] |
| TrASPr+BOS | Prediction & Design | Generative AI with Bayesian optimization for tissue-specific splicing [161] | Splicing outcome prediction; therapeutic RNA design [161] |
| Alamut Visual | Software Suite | Integrates multiple splice prediction algorithms with visualization [159] | Clinical variant interpretation; research analysis [159] |
| Minigene Vectors | Experimental | Plasmid systems for cloning and testing variant effects [159] | Functional validation of putative splice-altering variants [159] |
| HEK293T Cell Line | Experimental | Immortalized human embryonic kidney cell line | Minigene transfection; splicing assay validation [159] [75] |
Benchmarking studies consistently identify SpliceAI and Pangolin as top-performing predictors for general-purpose splice effect prediction, with emerging tools like Splam and TrASPr+BOS showing promise for specific applications [102] [160] [161]. However, significant challenges remain, particularly for exonic variants and deep intronic mutations, where all tools show reduced performance.
The integration of multi-modal data sources, including epigenetic features, chromatin accessibility, and RNA-binding protein profiles, may enhance prediction accuracy. Additionally, generative models capable of designing RNA sequences with specific splicing properties represent an exciting frontier for both basic research and therapeutic development [161]. As splicing-aware variant interpretation becomes increasingly central to precision medicine, continued refinement of these computational tools will be essential for unlocking the full diagnostic and therapeutic potential of the human genome.
Cross-Species Conservation and Divergence of Splicing Patterns
Alternative splicing (AS) is a fundamental post-transcriptional regulatory mechanism that enables a single gene to produce multiple distinct mRNA and protein isoforms, significantly enhancing the functional complexity of eukaryotic genomes [162] [47]. This process is not merely a cellular mechanism but a dynamic evolutionary landscape shaped by both conserved functional requirements and lineage-specific adaptations. The comparative analysis of splicing patterns across species provides a powerful lens through which to examine the molecular basis of phenotypic diversity, including traits as complex as maximum lifespan and brain specialization [162] [47] [163]. Understanding the forces that govern splicing conservation and divergence—ranging from cis-regulatory mutations to trans-acting factor evolution—is therefore critical for unraveling the intricacies of gene regulation in health and disease. This review synthesizes recent advances in our understanding of cross-species splicing dynamics, highlighting quantitative patterns, methodological frameworks, and functional implications for biomedical research.
Evolutionary Patterns of Splicing Conservation
Quantitative Comparisons Across Taxa
The extent of alternative splicing varies considerably across the tree of life, reflecting both evolutionary lineage and genomic architecture. Mammals and birds exhibit the highest levels of alternative splicing, while unicellular eukaryotes and prokaryotes display minimal splicing activity [41]. Plants show intermediate levels but exhibit high genomic composition variability, often compensating for lower splicing rates through genome expansion and gene duplication events [41].
Table 1: Alternative Splicing Conservation Across Selected Species
| Species | Percentage of Genes Alternatively Spliced | Average Transcripts per Gene | Notable Conservation Patterns |
|---|---|---|---|
| Human | 68% | ~8 | High conservation of cassette exons in signaling pathways |
| Mouse | 57% | ~6 | 85% of reference splices conserved with humans |
| Chicken | 23% | 2-3 | Strong intron definition (3% intron retention) |
| All Mammals | Variable (40-70%) | Species-dependent | Mutually exclusive exons show highest conservation rate (4.66%) |
A comprehensive analysis of 1494 species reveals that alternative splicing rates correlate with genomic features, particularly the proportion of non-coding DNA. The highest levels of alternative splicing occur in genomes containing approximately 50% intergenic DNA, suggesting an evolutionary trade-off between coding capacity and regulatory complexity [41]. This relationship is quantified by the Alternative Splicing Ratio (ASR), a novel genome-scale metric designed for cross-species comparison that measures the average number of distinct transcripts generated per coding sequence [41].
Conservation Classification Framework
Splicing events can be systematically classified through comparative genomics approaches:
- Conserved Splicing: Events reliably mapped in both genomes and identified in transcripts from both species (approximately 7% of alternative splices in human-mouse comparisons) [164]
- Novel Splicing: Events mapped in both genomes but identified in transcripts of only one species (44% of human alternative splices) [164]
- Diverged Splicing: No matching splice junction found within 10 bases based on cross-species alignment (49% of human alternative splices) [164]
Evolutionarily conserved alternative splicing is most enriched in brain-expressed signaling pathways, while diverged alternative splicing predominates in processes related to testis, stress responses, and cancerous cell lines [164]. This distribution suggests that splicing conservation serves as a reliable indicator of functional significance, with core neurological functions maintaining strong evolutionary constraint.
Methodological Approaches for Comparative Splicing Analysis
Experimental Designs for Divergence Mapping
Several experimental frameworks have been developed to delineate cis- and trans-regulatory components of splicing divergence:
Figure 1: F1 Hybrid Experimental Workflow for Splicing Divergence Analysis
The F1 hybrid mouse system (C57BL/6J × SPRET/EiJ) enables precise quantification of cis-regulatory divergence through allele-specific splicing quantification [165]. This approach involves:
- Cross-species hybridization: Generating F1 hybrids from divergent mouse species
- Multi-tissue RNA-seq: Profiling splicing patterns across cerebral cortex, heart, lung, kidney, spleen, and embryonic stem cells
- Allelic mapping: Separately quantifying percent spliced-in (PSI) values for each parental allele
- Perturbation experiments: Chemical inhibition of spliceosome components to reveal buffered cis-regulatory variation
This experimental paradigm has revealed that cis-regulatory divergence largely follows neutral evolutionary expectations, with the effects of mutations scaled by kinetic competition between splice sites [165]. Notably, non-adaptive mutations are often masked in tissues where accurate splicing is critical, revealing sophisticated buffering mechanisms in functionally important contexts.
Computational Frameworks for Splicing Annotation
Comparative splicing analysis requires specialized computational approaches:
- Splicing Graph Analysis: Representation of exons as nodes and introns as edges, enabling systematic classification of splicing events without genomic DNA reference [166]
- Orthologous Event Mapping: Identification of homologous AS events through sequence alignment and transcriptome assembly across multiple species [47]
- Maximum Entropy Modeling: Detection of non-trivial two-site correlations in donor splice site sequences across evolutionary lineages [167]
These methods have revealed that statistical regularities in 5' splice site composition carry phylogenetic signal, with characteristic two-site coupling patterns distinguishing plant and animal lineages [167]. Such lineage-specific signatures likely reflect differences in spliceosome machinery and regulatory constraints that have emerged over evolutionary timescales.
Table 2: Computational Methods for Splicing Conservation Analysis
| Method | Principle | Application | Key Finding |
|---|---|---|---|
| Splicing Graph Analysis | Exons as nodes, introns as edges in directed acyclic graphs | Classification of AS events without genomic reference | Chicken genes have fewer isoforms but similar AS event percentage as humans |
| Phylogenetic Independent Contrasts (PIC) | Statistical adjustment for evolutionary relationships | Identification of MLS-associated splicing events | 83% of MLS-AS associations remain after phylogenetic correction |
| Regularized Maximum Entropy Modeling | Identification of two-site couplings in splice sites | Mining lineage-specific signals | Negative epistasis between intronic and exonic consensus nucleotides |
| Bootstrap-Resampling Co-expression | Network analysis of correlated gene expression | Assessment of transcriptional program conservation | Cerebral cortex shows greatest divergence between human and mouse |
Tissue-Specific and Lineage-Specific Divergence Patterns
Neural-Specific Splicing Conservation
The brain exhibits distinctive splicing conservation patterns that set it apart from peripheral tissues:
Figure 2: Brain-Specific Splicing Divergence Patterns
- Maximum Lifespan Association: The brain contains twice as many tissue-specific maximum lifespan-associated splicing events compared to peripheral tissues [162] [47]
- Body Mass Decoupling: Brain splicing shows reduced overlap between maximum lifespan and body mass-associated events, suggesting independent regulation of longevity pathways [47]
- Micro-Exon Enrichment: Neural tissues exhibit strong conservation and high inclusion levels of micro-exons (3-30 nucleotides), which play critical roles in neuronal function and connectivity [165]
- Cell-Type Specific Divergence: Glial cells (microglia, astrocytes, oligodendrocytes) show three times greater transcriptomic divergence than neurons between human and mouse [163]
These neural-specific patterns highlight the exceptional regulatory complexity of brain transcriptomes and suggest that splicing evolution has contributed to neurological specialization across mammalian lineages.
Lifespan-Associated Splicing Divergence
Cross-species analyses of 26 mammalian species with varying maximum lifespans (MLS) have identified hundreds of conserved splicing events associated with longevity [162] [47]. These MLS-AS events display distinctive characteristics:
- Pathway Enrichment: MLS-AS events are enriched in pathways related to mRNA processing, stress response, neuronal functions, and epigenetic regulation [162] [47]
- Distinct from Expression Signals: MLS-associated splicing events are largely distinct from genes whose expression correlates with MLS, indicating that AS captures unique lifespan-related biological signals [47]
- Strong RBP Coordination: MLS-associated AS events display stronger RNA-binding protein motif coordination than age-associated events, suggesting more genetically programmed adaptation for lifespan determination [162]
- Tissue-Specific Patterns: The brain exhibits certain MLS-associated splicing patterns divergent from peripheral tissues, potentially reflecting tissue-specific longevity mechanisms [47]
Notably, MLS- and age-associated AS events show limited overlap, but shared events are enriched in intrinsically disordered protein regions, suggesting a role for protein flexibility and stress adaptability in lifespan determination [162].
Functional Implications and Research Applications
Disease Modeling Considerations
The conservation and divergence of splicing patterns have profound implications for disease modeling and therapeutic development:
- Model Organism Limitations: Approximately 18% of genes dysregulated in human neurological disorders show significant splicing divergence between human and mouse, potentially limiting their utility as disease biomarkers in mouse models [163]
- Primate-Specific Mechanisms: Numerous neurological disorders involve biological processes in brain regions or cell types with human- or primate-specific features, complicating recapitulation in model organisms [163]
- Co-expression Network Divergence: Dozens of human neuropsychiatric and neurodegenerative disease risk genes (COMT, PSEN-1, LRRK2, SHANK3, SNCA) show highly divergent co-expression between mouse and human [163]
These findings highlight the importance of considering species-specific splicing patterns when extrapolating from model organisms to human biology and disease mechanisms.
The Scientist's Toolkit: Research Reagent Solutions
Table 3: Essential Research Reagents for Comparative Splicing Studies
| Reagent/Resource | Function | Application Example |
|---|---|---|
| F1 Hybrid Mouse Systems (C57BL/6J × SPRET/EiJ) | Cis-regulatory divergence mapping | Allele-specific splicing quantification across tissues [165] |
| Multi-Tissue RNA-seq Libraries | Transcriptome profiling | Identification of tissue-specific conservation patterns [162] [47] |
| Spliceosome Inhibitors | Perturbation of splicing efficiency | Revealing buffered cis-regulatory variation [165] |
| Cross-Species Genomic Alignments | Orthologous event identification | Conservation classification (conserved/novel/diverged) [164] |
| Species-Specific Splice Site Models | Lineage-specific sequence pattern analysis | Identifying phylogenetic signals in 5'ss sequences [167] |
The comparative analysis of splicing patterns across species reveals a complex evolutionary landscape shaped by both functional constraint and lineage-specific innovation. Core splicing machinery and regulatory principles remain largely conserved across eukaryotes, but the implementation and regulation of alternative splicing have diverged substantially across evolutionary lineages. The brain emerges as a particularly notable site of splicing innovation, with distinct conservation patterns that reflect its unique functional complexity and potential role in species-specific adaptations such as lifespan extension. Moving forward, integrating comparative splicing analyses with functional genomic approaches will be essential for unraveling the molecular mechanisms through which splicing evolution contributes to phenotypic diversity and disease susceptibility. The research tools and experimental frameworks summarized here provide a foundation for these ongoing investigations at the intersection of genomics, evolution, and biomedical science.
Clinical Utility of Splicing-Aware Variant Interpretation
The accurate interpretation of genetic variants that disrupt RNA splicing represents a pivotal challenge and opportunity in genomic medicine. Splice-disruptive variants constitute a significantly underrecognized category of disease-causing mutations, now understood to account for an estimated 15–30% of all pathogenic mutations across genetic disorders [16] [168]. Historically, clinical variant assessment focused predominantly on coding sequences, yet it is now evident that synonymous, deep-intronic, and regulatory variants can profoundly perturb splicing events and contribute to disease pathogenesis [16]. This understanding has emerged alongside the recognition that splicing-aware interpretation substantially enhances diagnostic yield, informs the reclassification of variants of uncertain significance (VUS), and reveals novel targets for therapeutic intervention [16].
The clinical significance of this interpretive approach is powerfully demonstrated by the success of RNA-targeted therapeutics. Nusinersen, a splice-switching antisense oligonucleotide (SSO) approved for spinal muscular atrophy (SMA), corrects aberrant splicing of the endogenous SMN2 gene, dramatically improving patient outcomes [16] [51]. Similarly, eteplirsen, golodirsen, casimersen, and viltolarsen—all FDA-approved SSOs—aim to restore the reading frame of specific DMD gene mutations in Duchenne muscular dystrophy (DMD) [16]. These clinical successes underscore both the pathogenic potential of splicing variants and their tractability as therapeutic targets, highlighting the imperative for sophisticated interpretation frameworks.
As genomic diagnostics evolve from phenotype-first to genome-first paradigms, there is an urgent need for systematic strategies to identify and interpret splice-disruptive variants, including those residing in noncoding regions that escape detection by traditional annotation pipelines [16]. This technical guide examines the current methodologies, computational tools, experimental validations, and clinical applications of splicing-aware variant interpretation, providing researchers and clinicians with a comprehensive framework for advancing precision medicine in splicing-driven disorders.
Molecular Mechanisms of Splicing and Aberration
Fundamentals of Pre-mRNA Splicing
Pre-mRNA splicing is an essential eukaryotic process that enables production of multiple transcript and protein isoforms from a single gene, thereby greatly expanding functional proteomic complexity. This process is orchestrated by the spliceosome, a large ribonucleoprotein complex composed of five small nuclear ribonucleoproteins (snRNPs)—U1, U2, U4, U5, and U6—along with numerous associated proteins [16]. Accurate recognition of splice sites depends on conserved cis-acting elements: the 5′ splice site (donor site), the branch point sequence (BPS), the polypyrimidine tract (PPT), and the 3′ splice site (acceptor site) [16].
Spliceosome assembly initiates with recognition of the 5′ SS by U1 snRNP and of the BPS and PPT by U2 snRNP-associated factors (U2AF1/U2AF2). The exon definition model posits that 5′ and 3′ splice sites flanking an exon are cooperatively recognized as a functional unit, with coordination between U1 and U2 snRNPs being particularly critical in higher eukaryotes where long introns demand cross-exon communication for accurate exon boundary recognition [16]. This coordination is influenced by multiple genomic and transcriptional features, including exon size, intron length, and transcriptional kinetics, with RNA polymerase II elongation rates affecting co-transcriptional splicing by altering temporal availability of splice sites and recruitment dynamics of splicing factors [16].
Mechanisms of Splicing Disruption
Genetic variants can disrupt normal splicing through multiple mechanistic pathways, leading to various aberrant outcomes. The major types of aberrant splicing include:
- Exon skipping: Complete omission of an exon from the mature transcript
- Cryptic splice site usage: Activation of non-canonical splice sites leading to exon elongation or truncation
- Intron retention: Failure to remove an intron from the final transcript
- Pseudoexon inclusion: Inclusion of intronic sequences into mature mRNA
- Alternative splice site usage: Altered ratios of naturally occurring alternative splicing events [16] [168]
These aberrant outcomes can result from variants affecting canonical splice sites, branch points, polypyrimidine tracts, or splicing regulatory elements (enhancers/silencers). Importantly, splice-disruptive variants are not limited to canonical splice site disruptions; creation or activation of cryptic splice sites can also lead to pathogenic outcomes, as can mutations affecting splicing regulatory elements such as exonic splicing enhancers (ESEs), exonic splicing silencers (ESSs), intronic splicing enhancers (ISEs), and intronic splicing silencers (ISSs) [16].
Table 1: Types of Splice-Disruptive Variants and Their Mechanisms
| Variant Category | Genomic Location | Primary Mechanism | Common Aberrant Outcomes |
|---|---|---|---|
| Canonical Splicing Variants | ±1, ±2 of exon-intron boundaries | Disruption of highly conserved GU/AG dinucleotides | Exon skipping, intron retention |
| Cryptic Splice Site Variants | Deep intronic or exonic regions | Creation of novel splice motifs that compete with canonical sites | Exon elongation/truncation, pseudoexon inclusion |
| Splicing Regulatory Variants | Exonic or intronic regulatory elements | Alteration of splicing enhancer/silencer function | Exon skipping, altered alternative splicing ratios |
| Branch Point/Polypyrimidine Tract Variants | -18 to -34 upstream of 3' SS | Disruption of BPS recognition or U2AF binding | Exon skipping, cryptic 3' SS usage |
| Tandem Acceptor Variants (NAGNnAG) | ±30 bp of natural acceptor | Creation/disruption of competing AG dinucleotides | Alternative acceptor usage, frameshifts |
A particularly challenging category involves tandem splice acceptor sites (NAGNnAG), where variants create or disrupt AG dinucleotides within approximately 30 bases of the natural splice acceptor site [169]. These variants can activate alternative acceptor sites despite preservation of the natural site, and they are enriched in clinical databases compared to population controls, indicating their clinical relevance [169]. The region between the branch point and the 3′ splice site typically exhibits an AG exclusion zone (AGEZ), and variants introducing AG dinucleotides within this zone are particularly likely to be pathogenic due to competition with the natural acceptor [169].
Figure 1: Molecular Mechanisms of Splicing Disruption. This diagram illustrates how different categories of genetic variants lead to distinct aberrant splicing outcomes through diverse molecular pathways.
Computational Prediction Frameworks
Algorithmic Approaches and Tool Classifications
Computational prediction of splice-disruptive variants has evolved significantly, with current methods employing diverse algorithmic strategies. These can be broadly categorized into:
- Information theory-based models: Calculate changes in information content of splice site sequences
- Machine learning classifiers: Utilize random forests, gradient boosting, or neural networks
- Deep learning architectures: Employ deep residual neural networks for sequence analysis
- Ensemble methods: Combine multiple algorithmic approaches and features [16] [170] [168]
The SQUIRLS (Super Quick Information-content Random-forest Learning of Splice variants) algorithm exemplifies a modern, interpretable machine learning approach. SQUIRLS generates a compact set of interpretable features including information-content of wild-type and variant sequences, changes in candidate splicing regulatory sequences, exon length, disruptions of the AG exclusion zone, and evolutionary conservation [170]. It employs two random-forest classifiers for donor and acceptor sites, combining their outputs via logistic regression to yield a final prediction score [170].
In contrast, SpliceAI utilizes a deep residual neural network architecture that predicts whether each position in a pre-mRNA functions as a splice donor, splice acceptor, or neither [170]. While demonstrating state-of-the-art accuracy, its deep learning approach provides limited interpretability, making clinical application more challenging compared to more transparent algorithms [170].
Comparative Performance and Clinical Implementation
Recent benchmarking studies reveal significant differences in the performance characteristics of splicing prediction tools. SQUIRLS has demonstrated capacity to transcend previous state-of-the-art accuracy in classifying splice variants as assessed by rank analysis in simulated exomes, with substantially faster computation times compared to competing methods [170]. This combination of accuracy and speed makes it particularly suitable for diagnostic pipelines processing large genomic datasets.
Table 2: Computational Tools for Splicing-Aware Variant Interpretation
| Tool | Algorithmic Approach | Key Features | Clinical Interpretability | Performance Characteristics |
|---|---|---|---|---|
| SQUIRLS | Random forest + logistic regression | Information-content, SRE changes, AG exclusion zone, conservation | High (tabular output with feature visualization) | Rank analysis superiority in simulated exomes |
| SpliceAI | Deep residual neural network | Positional splice site probability predictions | Low (single score without explanatory features) | State-of-the-art accuracy, limited explainability |
| MaxEntScan | Maximum entropy modeling | Information content, dependencies between positions | Medium (information theory basis) | Established baseline performance |
| Information Theory-Based Tools | Information theory | Binding affinity quantification, Ri values | High (thermodynamic interpretation) | Discerns leaky vs. abolished splicing |
Critical to clinical implementation is the interpretability of predictions. Methods like SQUIRLS provide tabular output files with visualizations that contextualize predicted effects of variants on splicing, directly supporting diagnostic interpretation [170]. This contrasts with "black box" approaches that offer limited insight into the specific features driving pathogenicity predictions. Furthermore, different tools exhibit varying performance characteristics for different variant types—while SpliceAI demonstrates strong overall performance, it shows limitations in specifically predicting functional variants that create or disrupt NAGNnAG tandem acceptor sites [169].
Experimental Validation Strategies
Transcript Analysis Methodologies
Experimental validation represents an essential step in confirming the functional impact of predicted splice-altering variants, particularly for clinical interpretation. Multiple methodological approaches provide complementary insights:
Minigene Splicing Assays: Clone genomic fragments encompassing the variant into splicing reporter vectors, transfer into cultured cells, and analyze resulting RNA via RT-PCR to assess splicing patterns [170] [168]. This approach allows controlled assessment of variant impact independent of endogenous expression.
RNA Sequencing from Patient Tissues: Isolate RNA from patient-derived tissues or cells (typically blood, muscle, or fibroblasts) and perform reverse transcription followed by PCR amplification and sequencing of target transcripts [170] [169]. This method captures native splicing patterns in biologically relevant contexts.
Long-Read Transcriptome Sequencing: Utilize platforms from Pacific Biosciences or Oxford Nanopore to sequence full-length transcripts spanning thousands of base pairs, providing unambiguous determination of splicing variants without assembly artifacts [51]. This approach is particularly valuable for complex splicing events or when multiple variants affect a single transcript.
Massively Parallel Splicing Assays: Systematically test thousands of variants simultaneously using synthetic oligonucleotide libraries in high-throughput functional screens, providing empirical data on variant effects at scale [170].
Each method presents distinct advantages and limitations regarding sensitivity, specificity, throughput, and biological relevance. Minigene assays offer controlled environments but may lack native genomic context, while patient RNA analysis captures physiological complexity but faces challenges of tissue accessibility and expression levels.
Research Reagents and Experimental Toolkit
Table 3: Essential Research Reagents for Splicing Validation Experiments
| Reagent/Category | Specific Examples | Experimental Function | Technical Considerations |
|---|---|---|---|
| Splicing Reporter Vectors | pSPL3, pCAS2, hybrid minigenes | Provide genomic context for cloned fragments in cellular assays | Requires appropriate genomic flanking sequences (typically ~300-500bp) |
| Cell Lines | HEK293T, HeLa, patient-derived fibroblasts | Cellular environment for splicing assays | Tissue relevance, transfection efficiency, endogenous splicing factors |
| Reverse Transcription Primers | Gene-specific, random hexamers, oligo-dT | cDNA synthesis from RNA templates | Primer choice affects representation of different transcript regions |
| PCR Amplification Primers | Flanking exonic primers | Amplification of target transcript regions | Must flank predicted aberrant splicing event with appropriate product size |
| Long-Read Sequencing Platforms | PacBio Sequel, Oxford Nanopore | Full-length transcript sequencing without assembly | Higher error rates than short-read, but provides phasing information |
| RNA Extraction Methods | TRIzol, column-based kits | Isolation of high-quality RNA from cells/tissues | RNA integrity number (RIN) >8.0 typically required for reliable assays |
Figure 2: Experimental Validation Workflow for Splice-Disruptive Variants. This diagram outlines the key methodological pathways for experimental confirmation of splicing anomalies, incorporating both minigene approaches and direct patient RNA analysis.
Clinical Applications and Therapeutic Implications
Diagnostic Yield Enhancement and VUS Reclassification
The implementation of splicing-aware interpretation frameworks significantly impacts clinical diagnostics by improving variant classification and solving previously undiagnosed cases. Multiple studies demonstrate that RNA sequencing can identify molecular diagnoses in approximately 30% of exome-negative cases [170], highlighting the substantial proportion of disorders where splicing defects represent the underlying disease mechanism. This diagnostic enhancement is particularly evident in specific gene-disease contexts; for example, in NF1 (neurofibromatosis type 1) and ATM (ataxia-telangiectasia), studies indicate that approximately 50% of all disease-causing variants result in defective splicing [168].
The reclassification of variants of uncertain significance (VUS) represents another critical clinical application. Non-canonical splice-altering variants that escape detection by conventional annotation pipelines frequently receive VUS classifications despite functional evidence of pathogenicity. Systematic application of splicing-aware interpretation—combining computational predictions with experimental validation—enables evidence-based reclassification of these variants, providing patients and families with definitive diagnoses [16] [170]. This is particularly relevant for synonymous variants, which were historically often dismissed as benign but are now recognized to frequently disrupt exonic splicing regulatory elements [16].
RNA-Targeted Therapeutic Development
The accurate identification of splice-disruptive variants directly enables the development of targeted RNA-based therapies. Several therapeutic modalities have demonstrated clinical success:
- Splice-Switching Antisense Oligonucleotides (SSOs): Short, synthetic nucleotides designed to bind specific RNA sequences and modulate splicing patterns by blocking access to splice sites or regulatory elements [16] [51]
- Small-Molecule Splicing Modulators: Compounds that interact with splicing machinery components to influence splice site selection [16]
- RNA Editing Platforms: Emerging technologies that enable precise correction of pathogenic RNA sequences [16]
The paradigm for SSO therapy was established by nusinersen for spinal muscular atrophy, which targets the SMN2 gene to promote inclusion of exon 7, compensating for mutations in the SMN1 gene [16] [51]. Similarly, eteplirsen for Duchenne muscular dystrophy induces skipping of DMD exon 51 to restore the reading frame in eligible patients [16]. These clinical successes demonstrate how precise understanding of splicing mechanisms enables development of targeted interventions that directly address underlying molecular pathology.
Integration into Diagnostic Pipelines
For optimal clinical utility, splicing-aware interpretation must be systematically integrated into genomic diagnostic workflows. This requires:
- Computational prioritization of potential splice-disruptive variants using tools with validated performance characteristics
- Interpretable output generation that supports evidence-based variant classification according to ACMG/AMP guidelines
- Multidisciplinary review incorporating bioinformatic predictions, experimental data, and clinical findings
- Iterative reassessment as new computational methods and functional data become available [16] [170]
The SQUIRLS algorithm exemplifies this approach through its design specifically for diagnostic settings, providing both prioritization scores and visualizations that contextualize predicted effects to support clinical decision-making [170]. This interpretability is essential for integration into medical workflows where understanding the basis of pathogenicity predictions directly impacts patient management decisions.
Splicing-aware variant interpretation represents a transformative advancement in genomic medicine, addressing a historically underrecognized category of pathogenic variants with significant clinical implications. The integration of sophisticated computational prediction frameworks with experimental validation strategies has substantially improved diagnostic yields, enabled reclassification of variants of uncertain significance, and revealed novel targets for therapeutic intervention.
Future progress in this field will likely emerge from several developing areas: Long-read sequencing technologies are overcoming historical limitations in transcript assembly, providing more comprehensive views of splicing patterns [51]; Massively parallel functional assays are generating empirical splicing effect data at unprecedented scales, enabling training of more accurate prediction algorithms [170]; and RNA-targeted therapeutic platforms are expanding the clinical applications of splicing correction beyond rare disorders to more common conditions [16] [51].
The ongoing refinement of these approaches promises to further illuminate the complex landscape of splicing regulation and its disruption in human disease, ultimately advancing both diagnostic capabilities and therapeutic opportunities for patients with genetic disorders. As these methodologies mature and integrate into routine clinical practice, splicing-aware interpretation will increasingly represent a standard component of comprehensive genomic analysis, fulfilling its potential to transform patient care in the precision medicine era.
Conclusion
Alternative splicing represents a fundamental layer of genomic regulation that dramatically expands proteomic diversity from a limited set of genes, with profound implications for normal development and disease. The integration of advanced computational methods, particularly deep learning-based structure prediction and single-cell transcriptomics, has revolutionized our ability to map and interpret splicing complexity. However, significant challenges remain in accurately predicting the structural and functional consequences of splice variants and translating these insights into clinical applications. The growing success of RNA-targeted therapies, such as antisense oligonucleotides for neuromuscular disorders, highlights the therapeutic potential of manipulating splicing pathways. Future research should focus on improving the accuracy of splice variant prediction, understanding the interplay between splicing and other regulatory mechanisms, developing more effective splicing-modulating therapeutics, and expanding splicing-aware genomic interpretation in clinical diagnostics. As these efforts converge, alternative splicing research promises to yield novel biomarkers, therapeutic targets, and personalized treatment strategies across a wide spectrum of human diseases.
References
- 1. Alternative Splicing and Isoforms: From Mechanisms to ... [https://pmc.ncbi.nlm.nih.gov/articles/PMC8951537/]
- 2. Alternative splicing and related RNA binding proteins in ... [https://www.nature.com/articles/s41392-024-01734-2]
- 3. Mechanism of alternative splicing and its regulation - PMC [https://pmc.ncbi.nlm.nih.gov/articles/PMC4360811/]
- 4. Visualizing the splicing of single pre-mRNA molecules in ... [https://pmc.ncbi.nlm.nih.gov/articles/PMC2151038/]
- 5. A deep dive into statistical modeling of RNA splicing QTLs ... [https://www.sciencedirect.com/science/article/pii/S0002929725004033]
- 6. Mapping Splicing Quantitative Trait Loci in RNA-Seq - PMC [https://pmc.ncbi.nlm.nih.gov/articles/PMC4218654/]
- 7. RNA Splicing Visualized, Easing the Design of Small- ... [https://www.genengnews.com/topics/drug-discovery/rna-splicing-visualized-easing-the-design-of-small-molecule-modulators/]
- 8. Intron Retention as a Mode for RNA-Seq Data Analysis [https://www.frontiersin.org/journals/genetics/articles/10.3389/fgene.2020.00586/full]
- 9. Do not panic: An intron-centric guide to alternative splicing [https://pmc.ncbi.nlm.nih.gov/articles/PMC10226583/]
- 10. Splice site proximity influences alternative exon definition [https://pmc.ncbi.nlm.nih.gov/articles/PMC9225289/]
- 11. Exon skipping [https://en.wikipedia.org/wiki/Exon_skipping]
- 12. Origins and implications of intron retention quantitative trait ... [https://pubmed.ncbi.nlm.nih.gov/41192419/?utm_source=FeedFetcher&utm_medium=rss&utm_campaign=None&utm_content=1lsn_QJkONLNDZkSiM8vFIOOGjBINvNqd60svSKdFadgmqPQrX&fc=None&ff=20251106081117&v=2.18.0.post22+67771e2]
- 13. Quantifying splice-site usage: a simple yet powerful ... [https://pmc.ncbi.nlm.nih.gov/articles/PMC8121094/]
- 14. A basic framework to explain splice-site choice in eukaryotes [https://www.nature.com/articles/s41467-025-63622-9]
- 15. Computational Methods and Correlation of Exon-skipping ... [https://pmc.ncbi.nlm.nih.gov/articles/PMC5203767/]
- 16. Genome-wide functional annotation and interpretation of ... [https://www.nature.com/articles/s10038-025-01424-z]
- 17. Targeting RNA splicing modulation: new perspectives for ... [https://jeccr.biomedcentral.com/articles/10.1186/s13046-025-03279-w]
- 18. Systematic analysis of the effects of splicing on the diversity ... [https://www.sciencedirect.com/science/article/abs/pii/S2405471225001516]
- 19. $name [https://www.sdu.dk/en/forskning/rna-splicing-disease/research-areas/splicing-regulation-and-exon-vulnerability]
- 20. Alternative Splicing and CaV‐Associated Channelopathies [https://pmc.ncbi.nlm.nih.gov/articles/PMC12149502/]
- 21. Data-driven insights to inform splice-altering variant assessment [https://pmc.ncbi.nlm.nih.gov/articles/PMC12081236/]
- 22. Epigenome profiling reveals distinctive regulatory features ... [https://pmc.ncbi.nlm.nih.gov/articles/PMC12063414/]
- 23. SpliceVarDB: A comprehensive database of experimentally ... [https://www.sciencedirect.com/science/article/pii/S000292972400288X]
- 24. Poison exons: tuning RNA splicing for targeted gene ... [https://www.sciencedirect.com/science/article/pii/S0165614725000021]
- 25. hnRNPs: roles in neurodevelopment and implication for ... [https://www.frontiersin.org/journals/molecular-neuroscience/articles/10.3389/fnmol.2024.1411639/full]
- 26. SR protein [https://en.wikipedia.org/wiki/SR_protein]
- 27. Crucial roles of different RNA-binding hnRNP proteins in Stem ... [https://pmc.ncbi.nlm.nih.gov/articles/PMC7975692/]
- 28. The splicing factors 9G8 and SRp20 transactivate ... [https://pmc.ncbi.nlm.nih.gov/articles/PMC1369774/]
- 29. The Functional Relationship Between RNA Splicing and ... [https://www.sciencedirect.com/science/article/pii/S0022283624002092]
- 30. Alternative Splicing and Protein Diversity: Plants Versus ... [https://www.frontiersin.org/journals/plant-science/articles/10.3389/fpls.2019.00708/full]
- 31. Long-read RNA-seq demarcates cis- and trans-directed ... [https://pmc.ncbi.nlm.nih.gov/articles/PMC12575695/]
- 32. Co-transcriptional regulation of alternative pre-mRNA ... [https://pmc.ncbi.nlm.nih.gov/articles/PMC3371144/]
- 33. Pre-mRNA splicing and its co-transcriptional connections [https://pmc.ncbi.nlm.nih.gov/articles/PMC10524715/]
- 34. Coupling of RNA polymerase II transcription elongation ... [https://pmc.ncbi.nlm.nih.gov/articles/PMC4893998/]
- 35. Coupling of RNA Polymerase II Transcription Elongation ... [https://www.sciencedirect.com/science/article/abs/pii/S0022283616300766]
- 36. Emerging and Re-emerging Themes in Co-transcriptional pre ... [https://pmc.ncbi.nlm.nih.gov/articles/PMC11463726/]
- 37. Functional coupling of RNAP II transcription to spliceosome ... [https://pmc.ncbi.nlm.nih.gov/articles/PMC1472470/]
- 38. Coupling of co-transcriptional splicing and 3' end Pol II ... [https://genomebiology.biomedcentral.com/articles/10.1186/s13059-023-03050-4]
- 39. Coupling of Transcription with Alternative Splicing: RNA ... [https://www.sciencedirect.com/science/article/pii/S109727650080372X]
- 40. Evidence for the role of transcription factors in the co ... [https://genomebiology.biomedcentral.com/articles/10.1186/s13059-023-02885-1]
- 41. Alternative splicing across the tree of life [https://elifesciences.org/articles/94802]
- 42. Alternative splicing across the tree of life - PMC [https://pmc.ncbi.nlm.nih.gov/articles/PMC12534046/]
- 43. Alternative Splicing Across the Tree of Life: A Comparative ... [https://elifesciences.org/reviewed-preprints/94802]
- 44. Methods for Characterization of Alternative RNA Splicing [https://pmc.ncbi.nlm.nih.gov/articles/PMC4770877/]
- 45. Efficient and Accurate Quantitative Profiling of Alternative ... [https://www.sciencedirect.com/science/article/pii/S1097276518306786]
- 46. Predicting the structural impact of human alternative splicing [https://genomebiology.biomedcentral.com/articles/10.1186/s13059-025-03744-x]
- 47. The implications of alternative splicing regulation for ... [https://www.nature.com/articles/s41467-025-65339-1]
- 48. Functional impact of splice isoform diversity in individual cells [https://pmc.ncbi.nlm.nih.gov/articles/PMC4984447/]
- 49. Genome-wide detection of tissue-specific alternative splicing ... [https://pmc.ncbi.nlm.nih.gov/articles/PMC137414/]
- 50. SpliceTransformer predicts tissue-specific splicing linked to ... [https://www.nature.com/articles/s41467-024-53088-6]
- 51. Five questions on alternative splicing with Omar El Garwany [https://sangerinstitute.blog/2025/08/14/five-questions-on-alternative-splicing-with-omar-el-garwany/]
- 52. New clues to why some animals live longer - UCR News [https://news.ucr.edu/articles/2025/11/24/new-clues-why-some-animals-live-longer]
- 53. AS-Quant: Detection and Visualization of Alternative Splicing ... [https://pmc.ncbi.nlm.nih.gov/articles/PMC8123109/]
- 54. Methods to study splicing from high-throughput RNA ... [https://pubmed.ncbi.nlm.nih.gov/24549677/]
- 55. RNA splicing analysis using heterogeneous and large ... [https://www.nature.com/articles/s41467-023-36585-y]
- 56. Mining alternative splicing patterns in scRNA-seq data using ... [https://genomebiology.biomedcentral.com/articles/10.1186/s13059-024-03323-6]
- 57. New Approach for Detection of Normal Alternative Splicing ... [https://pmc.ncbi.nlm.nih.gov/articles/PMC8389194/]
- 58. Comprehensive quantitative analysis of alternative splicing ... [https://www.nature.com/articles/s41598-021-03989-z]
- 59. RNA Targeting Small Molecules Therapeutics Global ... [https://finance.yahoo.com/news/rna-targeting-small-molecules-therapeutics-100900139.html]
- 60. Advances in RNA-based therapeutics: current ... [https://www.frontiersin.org/journals/genetics/articles/10.3389/fgene.2025.1675209/full]
- 61. and related RNA binding Alternative in human... splicing proteins [https://www.nature.com/articles/s41392-024-01734-2?error=cookies_not_supported]
- 62. Computational methods for alternative polyadenylation and ... [https://pmc.ncbi.nlm.nih.gov/articles/PMC12411624/]
- 63. is an efficient Alternative for the generation of... splicing mechanism [https://pubmed.ncbi.nlm.nih.gov/1877390/]
- 64. Alternative splicing - Latest research and news [https://www.nature.com/subjects/alternative-splicing]
- 65. Improved methods for RNAseq-based alternative splicing ... [https://www.nature.com/articles/s41598-021-89938-2]
- 66. Computational Comparison of Differential Splicing Tools ... [https://www.mdpi.com/1422-0067/26/7/3220]
- 67. Bioinformatics workshops - Spring 2025 - Pitt CRC [https://www.crc.pitt.edu/bioinformatics-workshops-spring-2025]
- 68. Methods for Analyzing Alternative Splicing and Its Regulation ... [https://pmc.ncbi.nlm.nih.gov/articles/PMC12626760/]
- 69. PEAKS 2025 AOHUPO/AOAPO/π-HuB/CNHUPO Pre- ... [https://www.bioinfor.com/aohupo-2025-workshop/]
- 70. Protein structure prediction by AlphaFold2: are attention and symmetries all you need? - PMC [https://pmc.ncbi.nlm.nih.gov/articles/PMC8329862/]
- 71. Frontiers | Before and after AlphaFold2: An overview of protein structure prediction [https://www.frontiersin.org/journals/bioinformatics/articles/10.3389/fbinf.2023.1120370/full]
- 72. Predicting the structural impact of human alternative splicing | Genome Biology [https://link.springer.com/article/10.1186/s13059-025-03744-x]
- 73. Alternative splicing in stem cells and development [https://pmc.ncbi.nlm.nih.gov/articles/PMC12137872/]
- 74. Predicting the Structural Impact of Human Alternative Splicing [https://pmc.ncbi.nlm.nih.gov/articles/PMC10769328/]
- 75. SpliceVarDB: A comprehensive database of experimentally ... [https://pmc.ncbi.nlm.nih.gov/articles/PMC11480807/]
- 76. Harnessing alternative splicing for off-the-shelf mRNA ... [https://www.nature.com/articles/s41422-025-01199-0]
- 77. Deciphering splicing heterogeneity at single-cell resolution ... [https://www.nature.com/articles/s41467-025-64517-5]
- 78. Interrogations of single-cell RNA splicing landscapes with ... [https://www.nature.com/articles/s41467-024-46480-9]
- 79. Identifying cell state–associated alternative splicing events ... [https://pmc.ncbi.nlm.nih.gov/articles/PMC9341514/]
- 80. ELLIPSIS – robust quantification of splicing in scRNA-seq [https://www.rna-seqblog.com/ellipsis-robust-quantification-of-splicing-in-scrna-seq/]
- 81. Millefy: visualizing cell-to-cell heterogeneity in read ... [https://pmc.ncbi.nlm.nih.gov/articles/PMC7053140/]
- 82. Combined single-cell profiling of chromatin–transcriptome ... [https://www.nature.com/articles/s41587-025-02734-5]
- 83. RNA Sequencing reveals cell-type-specific link between ... [https://www.rna-seqblog.com/rna-sequencing-reveals-cell-type-specific-link-between-alternative-splicing-and-autoimmune-disease-inheritance/]
- 84. Re-evaluating the impact of alternative RNA splicing on ... [https://pmc.ncbi.nlm.nih.gov/articles/PMC9947481/]
- 85. Identification of Differentially Expressed Splice Variants by ... [https://pmc.ncbi.nlm.nih.gov/articles/PMC5629268/]
- 86. Variant biomarker discovery using mass spectrometry ... [https://www.frontiersin.org/journals/aging/articles/10.3389/fragi.2023.1191993/full]
- 87. Identification of Splice Variants and Isoforms in ... [https://pmc.ncbi.nlm.nih.gov/articles/PMC10840079/]
- 88. Global detection of human variants and isoforms by deep ... [https://www.nature.com/articles/s41587-023-01714-x]
- 89. SpliceVista, a Tool for Splice Variant Identification and ... [https://www.sciencedirect.com/science/article/pii/S1535947620330851]
- 90. Assessment of label-free quantification and missing value ... [https://bmcgenomics.biomedcentral.com/articles/10.1186/s12864-022-08723-1]
- 91. The burden of splice-disrupting variants in inherited heart ... [https://pmc.ncbi.nlm.nih.gov/articles/PMC10567745/]
- 92. Genome-wide functional annotation of variants [https://www.frontiersin.org/journals/pharmacology/articles/10.3389/fphar.2025.1474026/full]
- 93. SpliceAI Lookup [https://spliceailookup.broadinstitute.org/]
- 94. Functional impact of splicing variants in the elaboration ... [https://www.nature.com/articles/s41467-025-58970-5]
- 95. SpliceVista, a Tool for Splice Variant Identification and ... [https://pmc.ncbi.nlm.nih.gov/articles/PMC4047474/]
- 96. Leveraging functional annotations to map rare variants ... [https://pubmed.ncbi.nlm.nih.gov/40840451/]
- 97. Systematic identification of post-transcriptional regulatory ... [https://www.nature.com/articles/s41467-024-52215-7]
- 98. Protein diversity in store-operated calcium entry ... [https://www.sciencedirect.com/science/article/pii/S0143416025000752]
- 99. Integrative analysis of Hub1 overexpression - PubMed Central [https://pmc.ncbi.nlm.nih.gov/articles/PMC12502333/]
- 100. Experimental Assessment of Splicing Variants Using ... [https://pmc.ncbi.nlm.nih.gov/articles/PMC4425124/]
- 101. What's Wrong in a Jump? Prediction and Validation of ... [https://pmc.ncbi.nlm.nih.gov/articles/PMC8482176/]
- 102. Benchmarking splice variant prediction algorithms using ... [https://genomebiology.biomedcentral.com/articles/10.1186/s13059-023-03144-z]
- 103. A multicenter study reveals a novel pathogenic splice-site ... [https://pmc.ncbi.nlm.nih.gov/articles/PMC12502505/]
- 104. Stepwise ABC system for classification of any type ... [https://www.nature.com/articles/s41431-021-00903-z]
- 105. Single cell and spatial alternative splicing analysis with ... [https://www.nature.com/articles/s41467-025-60902-2]
- 106. OpenSpliceAI provides an efficient modular ... [https://elifesciences.org/articles/107454]
- 107. a resource for analysis and visualization of RNA-Seq data on ... [https://pmc.ncbi.nlm.nih.gov/articles/PMC3436850/]
- 108. Analyzing the Performance of Deep Learning Splice ... [https://sciety-labs.elifesciences.org/articles/by?article_doi=10.1101/2025.11.20.689501]
- 109. Quantifying annotation-driven bias in alternative splicing ... [https://pmc.ncbi.nlm.nih.gov/articles/PMC12605758/]
- 110. Exploring the Latest Advances in Transcriptomics [https://www.technologynetworks.com/proteomics/articles/exploring-the-latest-advances-in-transcriptomics-382260]
- 111. Long-read transcriptomics of a diverse human cohort reveals ... [https://pmc.ncbi.nlm.nih.gov/articles/PMC11956941/]
- 112. Transcript assembly and annotations: Bias and adjustment [https://journals.plos.org/ploscompbiol/article?id=10.1371/journal.pcbi.1011734]
- 113. Annotation depth confounds direct comparison of gene ... [https://bmcbioinformatics.biomedcentral.com/articles/10.1186/s12859-021-04414-y]
- 114. Robust and annotation-free analysis of alternative splicing ... [https://elifesciences.org/articles/73520]
- 115. Bias in RNA-seq Library Preparation: Current Challenges ... [https://pmc.ncbi.nlm.nih.gov/articles/PMC8079181/]
- 116. Systematic assessment of long-read RNA-seq methods for ... [https://www.nature.com/articles/s41592-024-02298-3]
- 117. Identification and functional characteristics of a novel splice ... [https://www.frontiersin.org/journals/genetics/articles/10.3389/fgene.2025.1588709/full]
- 118. Functional Characterization of Splice Variants in the ... [https://pmc.ncbi.nlm.nih.gov/articles/PMC11355033/]
- 119. Functional Characterization of Splice Variants in the ... [https://www.mdpi.com/1422-0067/25/16/8657/review_report]
- 120. Functional analysis of four splice site variants, including a ... [https://www.sciencedirect.com/science/article/abs/pii/S1525157825002788]
- 121. Possibilities and limitations of antisense oligonucleotide ... [https://www.nature.com/articles/s43856-023-00419-1]
- 122. Small molecule modulators of pre-mRNA splicing in cancer ... [https://pmc.ncbi.nlm.nih.gov/articles/PMC4707101/]
- 123. Antisense Oligonucleotides: An Emerging Area in Drug ... [https://pmc.ncbi.nlm.nih.gov/articles/PMC7355792/]
- 124. Antisense oligonucleotides: a novel Frontier in pharmacological strategy - PMC [https://pmc.ncbi.nlm.nih.gov/articles/PMC10690781/]
- 125. Small molecules modulating RNA splicing: a review of targets ... [https://pmc.ncbi.nlm.nih.gov/articles/PMC11042171/]
- 126. Antisense oligonucleotide therapy - Latest research and news | Nature [https://www.nature.com/subjects/antisense-oligonucleotide-therapy]
- 127. Enhanced comprehension of the pathogenicity of splicing ... [https://www.sciencedirect.com/science/article/abs/pii/S1525157825002624]
- 128. Recommendations from the ClinGen SVI Splicing Subgroup [https://pubmed.ncbi.nlm.nih.gov/37352859/]
- 129. Recommendations from the ClinGen SVI Splicing Subgroup [https://clinicalgenome.org/docs/application-of-the-acmg-amp-framework-to-capture-evidence-relevant-to-predicted-and-observed-impact-on-splicing-recommendations/]
- 130. Decoding genetic variants: ClinGen's expert ... [https://medicover-genetics.com/decoding-genetic-variants-clingens-expert-recommendations-for-evaluating-splicing-variant-data/]
- 131. Variant analysis pipeline for accurate detection of genomic ... [https://journals.plos.org/plosone/article?id=10.1371/journal.pone.0216838]
- 132. RNAseq short variant discovery (SNPs + Indels) - GATK [https://gatk.broadinstitute.org/hc/en-us/articles/360035531192-RNAseq-short-variant-discovery-SNPs-Indels]
- 133. RNA-Seq Variant Calling Pipeline: From Transcript Reads ... [https://www.cd-genomics.com/resource-rna-seq-variant-calling-pipeline-transcript-mutations.html]
- 134. Data-driven insights to inform splice-altering variant ... [https://www.sciencedirect.com/science/article/pii/S000292972500059X]
- 135. PepGen Announces Highest Mean Splicing Correction ... [https://investors.pepgen.com/news-releases/news-release-details/pepgen-announces-highest-mean-splicing-correction-reported-dm1]
- 136. Dyne Therapeutics Announces FDA Breakthrough Therapy ... [https://investors.dyne-tx.com/news-releases/news-release-details/dyne-therapeutics-announces-fda-breakthrough-therapy-designation]
- 137. Splice Correction of UNC13A: A New Frontier in ALS ... [https://www.targetals.org/2025/07/22/splice-correction-of-unc13a-a-new-frontier-in-als-treatment/]
- 138. RNA-targeted splice-correction therapy for neuromuscular ... [https://pubmed.ncbi.nlm.nih.gov/20150322/]
- 139. PepGen Announces Highest Mean Splicing Correction ... [https://www.bioescalator.ox.ac.uk/news-and-events/news/pepgen-announces-highest-mean-splicing-correction-reported-in-dm1-patients]
- 140. Dyne Therapeutics Announces New Clinical Data from ... [https://investors.dyne-tx.com/news-releases/news-release-details/dyne-therapeutics-announces-new-clinical-data-achieve-trial-dyne]
- 141. A new way to understand and predict gene splicing [https://news.mit.edu/2025/katmap-new-way-to-understand-predict-gene-splicing-1104]
- 142. Predicting nonsense-mediated mRNA decay from splicing ... [https://pmc.ncbi.nlm.nih.gov/articles/PMC12461151/]
- 143. Splicing defects in rare diseases: transcriptomics and ... [https://pmc.ncbi.nlm.nih.gov/articles/PMC10516351/]
- 144. RNA splicing [https://en.wikipedia.org/wiki/RNA_splicing]
- 145. A novel splicing mutation identified in a DMD patient [https://www.frontiersin.org/journals/pediatrics/articles/10.3389/fped.2023.1261318/full]
- 146. Alternative-splicing defects in cancer - PubMed Central - NIH [https://pmc.ncbi.nlm.nih.gov/articles/PMC6002934/]
- 147. Splicing accuracy varies across human introns, tissues, ... [https://pmc.ncbi.nlm.nih.gov/articles/PMC11772838/]
- 148. Intronic Alternative Splicing Identified by Regulators ... Comparative [https://journals.plos.org/ploscompbiol/article?id=10.1371/journal.pcbi.0020086]
- 149. Chromatin and Splicing - PMC - PubMed Central - NIH [https://pmc.ncbi.nlm.nih.gov/articles/PMC7665794/]
- 150. KATMAP infers splicing factor activity and regulatory ... [https://www.nature.com/articles/s41587-025-02881-9]
- 151. Protocol to study the effects of mutations near splicing sites ... [https://www.sciencedirect.com/science/article/pii/S2666166725000796]
- 152. Alternative Splicing of RNF180 Genes in Different Species Based on... [https://www.researchsquare.com/article/rs-129993/v1]
- 153. The Difference in Structural States between Canonical ... [https://pmc.ncbi.nlm.nih.gov/articles/PMC9687161/]
- 154. Investigating protein isoforms via proteomics: a feasibility ... [https://pmc.ncbi.nlm.nih.gov/articles/PMC3708446/]
- 155. Comparative and Quantitative Global Proteomics Approaches [https://pmc.ncbi.nlm.nih.gov/articles/PMC5302699/]
- 156. Enhanced protein isoform characterization | Nature Methods [https://www.nature.com/articles/s41592-022-01472-9]
- 157. A Quantitative Proteome Map of the Human Body [https://www.sciencedirect.com/science/article/pii/S0092867420310783]
- 158. Exploring the connection between RNA splicing and ... [https://www.sciencedirect.com/science/article/pii/S0959437X25000140]
- 159. Benchmarking deep learning splice prediction tools using ... [https://pmc.ncbi.nlm.nih.gov/articles/PMC8360004/]
- 160. New AI tool pinpoints gene splicing with unmatched precision [https://www.rna-seqblog.com/new-ai-tool-pinpoints-gene-splicing-with-unmatched-precision/]
- 161. Generative modeling for RNA splicing predictions and design [https://elifesciences.org/reviewed-preprints/106043]
- 162. The implications of alternative splicing regulation for maximum ... [https://pubmed.ncbi.nlm.nih.gov/41285791/?utm_source=FeedFetcher&utm_medium=rss&utm_campaign=None&utm_content=1-SjSZJSoHBGsnEXcLDjZZ8F-vz5YagNLIUYugSQFZXvZle9Rx&fc=None&ff=20251125193805&v=2.18.0.post22+67771e2]
- 163. Evolutionary conservation and divergence of the human brain ... [https://genomebiology.biomedcentral.com/articles/10.1186/s13059-020-02257-z]
- 164. Evolutionarily conserved and diverged alternative splicing ... [https://pmc.ncbi.nlm.nih.gov/articles/PMC1240112/]
- 165. Mammalian splicing divergence is shaped by drift, ... [https://pmc.ncbi.nlm.nih.gov/articles/PMC8739531/]
- 166. Comprehensive splicing graph analysis of alternative splicing ... [https://pmc.ncbi.nlm.nih.gov/articles/PMC2709266/]
- 167. Conserved and divergent signals in 5' splice site sequences ... [https://journals.plos.org/ploscompbiol/article?id=10.1371/journal.pcbi.1011540]
- 168. Interpretation of mRNA splicing mutations in genetic disease [https://f1000research.com/articles/3-282]
- 169. Tandem splice acceptor sites: Profiling their relevance to ... [https://www.sciencedirect.com/science/article/pii/S1098360025001674]
- 170. Interpretable prioritization of splice variants in diagnostic ... [https://pmc.ncbi.nlm.nih.gov/articles/PMC8456162/]