Autosomal Dominant vs Recessive Inheritance: Molecular Mechanisms, Clinical Applications, and Implications for Drug Development
This article provides a comprehensive analysis of autosomal dominant and recessive inheritance patterns for researchers and drug development professionals.
Autosomal Dominant vs Recessive Inheritance: Molecular Mechanisms, Clinical Applications, and Implications for Drug Development
Abstract
This article provides a comprehensive analysis of autosomal dominant and recessive inheritance patterns for researchers and drug development professionals. It explores the foundational genetic mechanisms, distinctive pedigree features, and molecular consequences such as gain-of-function versus loss-of-function effects. The content covers methodological applications in genetic testing and clinical diagnosis, addresses complex challenges including reduced penetrance and genetic heterogeneity, and examines how inheritance patterns inform therapeutic target selection and drug development strategies. By integrating classical Mendelian principles with contemporary genetic evidence and clinical trial data, this resource aims to bridge the gap between genetic discovery and therapeutic innovation for monogenic disorders.
Mendelian Foundations: Decoding Autosomal Dominant and Recessive Inheritance Mechanisms
The principles of inheritance, first meticulously outlined by Gregor Mendel in the 1860s, form the indispensable cornerstone of modern genetics research and its therapeutic applications [1] [2]. His experiments with pea plants established fundamental laws that explain the transmission of traits from parents to offspring, principles that remain vitally relevant in contemporary studies of genetic disorders and drug development [2] [3]. Mendel's work introduced the concept of discrete "unit factors" – now known as genes – which maintain their integrity across generations and segregate predictably during reproduction [1]. This framework provides the essential logic for understanding how genetic information is transmitted and expressed, a foundation upon which all complex genetic analysis is built.
Within the context of autosomal dominant and recessive inheritance research, Mendel's Law of Segregation and Law of Dominance provide the predictive power to determine inheritance patterns of monogenic disorders [2] [4]. The Law of Segregation elucidates the mechanism by which alleles separate into gametes, ensuring that each parent contributes only one allele for each trait to their offspring [1] [5]. Concurrently, the Law of Dominance describes the interaction between these paired alleles in a heterozygous individual, where the presence of a single dominant allele can mask the expression of a recessive counterpart [6] [4]. For research scientists and drug development professionals, a precise understanding of these laws is not merely academic; it is critical for identifying disease-causing genes, calculating recurrence risks in families, and selecting the correct therapeutic strategy, such as determining whether to inhibit or activate a specific gene product [3] [7].
Core Principle I: The Law of Segregation
Conceptual Definition and Genetic Mechanism
The Law of Segregation, also known as Mendel's first law, states that an individual's two alleles for a given gene separate (segregate) during the formation of gametes [1] [4]. Consequently, each gamete carries only one allele for each gene, and the union of two gametes during fertilization restores the paired (diploid) condition in the offspring [1]. This law is frequently termed the "law of purity of gametes" because the two alleles for a trait do not blend or contaminate each other; they remain distinct and are separated cleanly during gametogenesis [1].
The biological basis for this segregation lies in the process of meiosis [1]. During anaphase I of meiosis, homologous chromosomes, each carrying one allele of the gene, are pulled to opposite poles of the cell. Subsequently, in anaphase II, sister chromatids separate. This meticulous chromosomal division ensures that the resulting gametes (sperm or egg cells) are haploid, containing only one set of chromosomes and, therefore, only one allele for every genetic locus [1]. The separation of allele pairs during gamete formation is a fundamental mechanism that ensures genetic variation and provides a pathway for recessive alleles to be carried silently in one generation and expressed in the next [4].
Experimental Foundation and Evidence
Mendel's monohybrid cross experiments provided the first empirical evidence for the Law of Segregation [4]. In one classic experiment, he crossed pure-breeding (homozygous) tall pea plants with pure-breeding dwarf pea plants. The resulting first filial (F₁) generation consisted entirely of tall plants, consistent with the Law of Dominance. However, when Mendel then self-pollinated these F₁ hybrid plants, the recessive dwarf phenotype reappeared in the second (F₂) generation in a predictable 3:1 phenotypic ratio (three tall to one dwarf) [4].
The reappearance of the recessive trait in the F₂ generation was the critical observation that demonstrated segregation. It proved that the hereditary factors for dwarfism had not been lost, altered, or blended in the F₁ generation but had instead been temporarily masked and then segregated into separate gametes [4]. The genotypic ratio underlying the 3:1 phenotypic ratio is 1:2:1 (1 homozygous dominant : 2 heterozygous : 1 homozygous recessive) [6].
Table 1: Expected Genotypic and Phenotypic Outcomes from a Monohybrid Cross
| Generation | Parental Cross | F₁ Genotype | F₁ Phenotype | F₂ Genotypic Ratio | F₂ Phenotypic Ratio |
|---|---|---|---|---|---|
| Example | TT x tt | Tt (100%) | Tall (100%) | 1 TT : 2 Tt : 1 tt | 3 Tall : 1 Dwarf |
The following diagram illustrates the chromosomal basis of allele segregation during meiosis, which underpins the phenotypic observations in Mendelian crosses:
Core Principle II: The Law of Dominance
Conceptual Definition and Allelic Interaction
The Law of Dominance states that in a heterozygous individual, one allele (the dominant allele) may mask the expression of the other allele (the recessive allele) [6] [4]. The physical expression, or phenotype, of the heterozygote is therefore identical to that of an individual homozygous for the dominant allele [2]. For a recessive trait to be expressed, the individual must inherit two copies of the recessive allele (homozygous recessive) [6]. This law explains why certain traits can appear to "skip" a generation, remaining unexpressed in heterozygous carriers (who display the dominant phenotype) only to reappear in offspring who inherit the recessive allele from both parents [4].
It is crucial to understand that dominance is a property of the phenotype, not the allele itself [6]. An allele is labeled dominant because of its effect when paired with a different allele in a heterozygote. The molecular basis of dominance often lies in the function of the protein the allele encodes; a dominant allele typically produces a functional protein (or a protein with altered function) that dictates the phenotype, even in the presence of a recessive allele that may produce a non-functional or less effective protein [6].
Clinical and Research Implications in Inheritance Patterns
The Law of Dominance directly informs the clinical understanding of autosomal dominant and recessive disorders [2]. In autosomal dominant (AD) disorders, a single copy of a mutant allele is sufficient to cause the disease phenotype. An affected individual typically has a 50% chance of passing the disorder to each offspring [2]. In contrast, autosomal recessive (AR) disorders require two mutant alleles for the disease to manifest. Individuals with only one mutant allele are carriers; they are typically asymptomatic but can pass the mutant allele to their children [2].
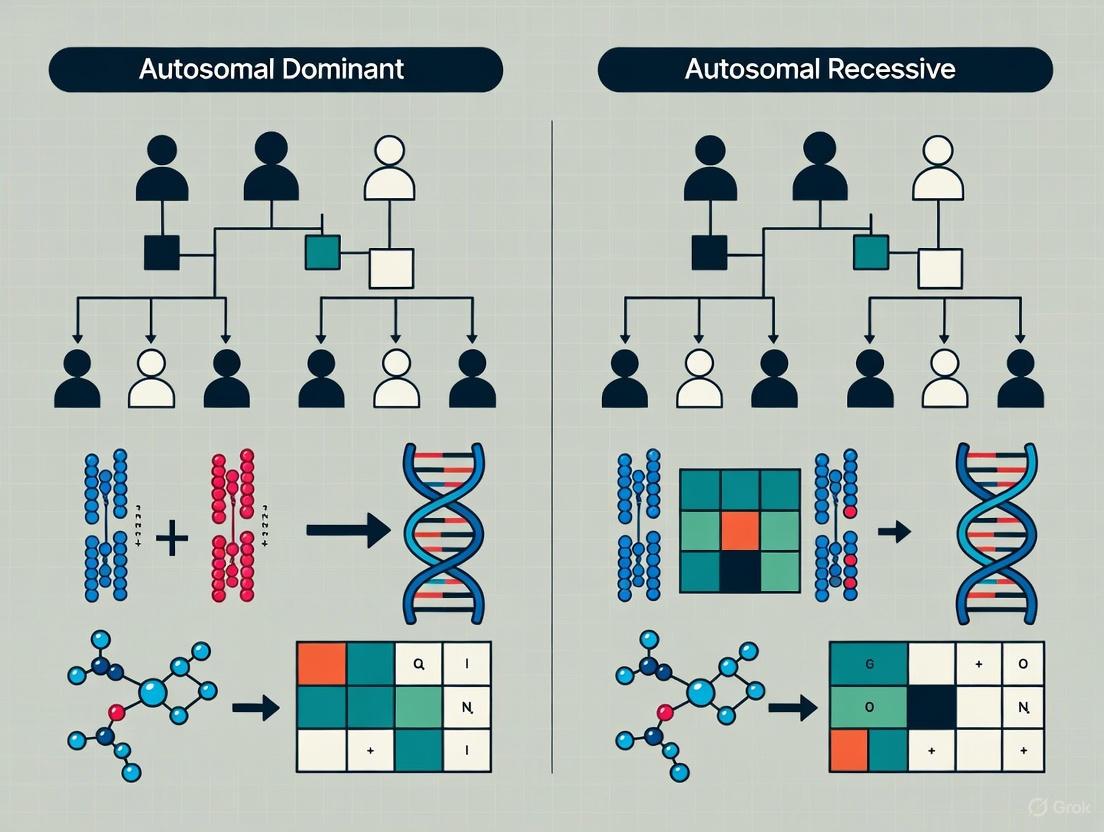
Table 2: Characteristics of Autosomal Dominant vs. Autosomal Recessive Inheritance
| Feature | Autosomal Dominant (AD) | Autosomal Recessive (AR) |
|---|---|---|
| Number of Mutant Alleles to Express Disease | One | Two |
| Typical Family Pedigree Pattern | Appears in every generation; does not skip [2] | May skip generations; often seen in a single sibship [8] |
| Parental Genotype of an Affected Individual | Usually one affected (heterozygous) parent | Both parents are typically asymptomatic carriers (heterozygous) |
| Recurrence Risk for Offspring of an Affected Parent | 50% | 0% (unless the other parent is a carrier) |
| Consanguinity | Not a significant factor | Increases risk [8] |
| Example Disorders | Marfan Syndrome [2], Tuberous Sclerosis [2] | Cystic Fibrosis, Sickle Cell Anemia [8] |
Modern genomic research confirms these patterns on a large scale. Studies of developmental disorders have shown that genes involved in autosomal dominant disorders are enriched for both activator and inhibitor drug targets, whereas genes involved in autosomal recessive disorders are depleted for inhibitor mechanisms, reflecting their underlying loss-of-function pathology [3].
Research Applications and Advanced Methodologies
Experimental Protocols for Validating Inheritance Patterns
Determining the mode of inheritance for a novel genetic variant or confirming a gene-disease association requires robust experimental and analytical protocols. The following methodologies are central to this research.
1. Family-Based Linkage Analysis and Trio-Based Whole Exome/Genome Sequencing: This is a primary method for identifying disease-causing variants and establishing inheritance patterns [8] [7]. The process begins with the collection of biological samples (typically blood or saliva) from a proband (the initial affected individual) and their parents (a "trio") and often extends to other affected and unaffected family members. DNA is extracted and subjected to high-throughput sequencing. Bioinformatic pipelines then align sequences to a reference genome, call variants, and filter them against population databases (e.g., gnomAD) to remove common polymorphisms. The analysis focuses on identifying:
- De novo variants (absent in parents' genomes) for dominant conditions.
- Compound heterozygous or homozygous recessive variants consistent with AR inheritance [8].
- Segregation of the candidate variant with the disease phenotype across the family pedigree.
2. Gene Burden Testing for Recessive Disorders: In large cohort studies, researchers quantify the burden of recessive coding variants by comparing the observed number of rare, damaging biallelic genotypes (homozygous or compound heterozygous) in cases versus the number expected by chance, using GIA group-specific allele frequencies and autozygosity levels [8]. A significant excess in cases indicates a recessive contribution to the disorder. This approach has shown that the attributable fraction of developmental disorders due to autosomal recessive coding variants can range from ~2% to over 18%, strongly correlating with the average autozygosity of the population [8].
The Scientist's Toolkit: Essential Research Reagents
Table 3: Key Reagents and Resources for Genetic Inheritance Research
| Research Reagent / Resource | Function and Application in Inheritance Studies |
|---|---|
| Trios and Family Pedigrees | The fundamental biological material for establishing co-segregation of genotypes and phenotypes and determining inheritance patterns [8]. |
| Whole Exome/Genome Sequencing Kits | Enable comprehensive identification of single nucleotide variants (SNVs), small insertions/deletions (indels), and copy number variants (CNVs) across the genome [8]. |
| Population Genomics Databases (e.g., gnomAD) | Provide allele frequencies across diverse populations, which is critical for filtering out common polymorphisms and assessing variant pathogenicity [8]. |
| Gene Intolerance Metrics (e.g., LOEUF) | Quantify a gene's tolerance to loss-of-function variants. Lower scores indicate higher constraint, a hallmark of genes associated with dominant disorders [3] [7]. |
| Disease Gene Databases (e.g., OMIM, DDG2P) | Curated repositories of known gene-disease relationships and their established inheritance patterns, used for validation and seed gene selection in machine learning models [7]. |
| Machine Learning Models (e.g., mantis-ml) | Semi-supervised frameworks that integrate genetic features (intolerance, expression) to predict novel risk genes in an inheritance-specific manner, accelerating gene discovery [7]. |
Application in Drug Development and Target Validation
Understanding inheritance patterns is critical for determining the direction of effect (DOE) for a potential drug target—that is, whether to inhibit or activate the target protein for therapeutic benefit [3]. Genetic evidence directly informs this decision:
- If gain-of-function (GOF) mutations in a gene increase disease risk, this suggests that inhibitor drugs are the appropriate therapeutic strategy.
- Conversely, if loss-of-function (LOF) mutations cause the disease, it may indicate that activator drugs or protein replacement therapies are needed [3].
Recent computational frameworks now predict DOE-specific druggability by integrating genetic associations, gene embeddings, and protein features [3]. These models have revealed distinct characteristics between activator and inhibitor targets; for instance, inhibitor drug targets tend to be more intolerant to LOF variation (lower LOEUF scores) and are enriched for genes involved in autosomal dominant disorders [3]. The following workflow diagram summarizes how genetic principles inform the drug target discovery pipeline:
Mendel's Law of Segregation and Law of Dominance are far more than historical concepts; they are dynamic principles that continue to underpin cutting-edge research in human genetics and therapeutic development [2] [3]. The Law of Segregation provides the mechanistic basis for the transmission of genetic variants, while the Law of Dominance explains the resulting phenotypic expression, forming the logical framework for distinguishing between autosomal dominant and recessive disorders [2] [4].
The integration of these principles with modern genomic technologies—such as large-scale trio sequencing, burden testing, and inheritance-aware machine learning models—is dramatically accelerating the pace of gene discovery and the validation of novel drug targets [8] [7]. For researchers and drug developers, a deep and functional understanding of these core genetic principles is not optional but essential. It enables the correct interpretation of genetic data, informs the prediction of disease risk, and critically, guides the strategic selection of therapeutic modality, ultimately paving the way for more precise and effective genetic medicine.
Autosomal dominant (AD) inheritance represents a fundamental pattern of genetic transmission in human genetics, wherein a single pathogenic variant on one allele is sufficient to cause disease phenotype. This comprehensive review elucidates the molecular mechanisms underlying AD disorders, explores their distinctive inheritance patterns characterized by vertical transmission across generations, and examines the clinical implications for disease diagnosis and management. Through detailed analysis of quantitative genetic data, experimental methodologies, and visualization of biological pathways, this article provides researchers and drug development professionals with advanced insights into AD pathology. The discussion is contextualized within broader patterns of Mendelian inheritance, highlighting both the classical understanding of AD transmission and emerging complexities that challenge traditional classification paradigms, including genes exhibiting dual autosomal dominant and recessive inheritance patterns.
Autosomal dominant inheritance constitutes a major category of Mendelian disorders where mutation of a single allele on an autosome (chromosomes 1-22) is sufficient to manifest disease phenotype [9] [2]. This pattern contrasts sharply with autosomal recessive disorders, which require biallelic mutations for clinical expression. The term "autosomal" distinguishes these conditions from sex-linked disorders, while "dominant" indicates that the heterozygous state (one wild-type allele and one mutant allele) produces clinical disease [10]. In AD inheritance, males and females are equally likely to inherit and transmit the disorder, and male-to-male transmission can occur, which distinguishes it from X-linked inheritance patterns [2] [11].
The clinical significance of AD disorders extends beyond their inheritance pattern, as they include numerous conditions with substantial morbidity and mortality. Approximately 50% of known Mendelian disorders in humans follow an AD pattern [9]. Understanding the molecular basis and inheritance characteristics of these disorders is crucial for genetic counseling, risk assessment, diagnostic approaches, and the development of targeted therapies. This article explores the mechanistic foundations of AD disorders, their distinguishing features within the spectrum of inheritance patterns, and the experimental frameworks used in their investigation.
Core Mechanisms of Single-Allele Pathogenicity
Molecular Pathways to Dominance
In autosomal dominant disorders, pathogenicity arises through several distinct molecular mechanisms even when only a single allele carries a pathogenic variant. The primary mechanisms include haploinsufficiency, dominant-negative effects, and gain-of-function mutations [12]. Each mechanism disrupts normal cellular function through different pathways, though all result in a dominant phenotype despite the presence of one normal allele.
Haploinsufficiency occurs when a single functional copy of a gene cannot produce sufficient protein to maintain normal function [12]. In these cases, a 50% reduction in protein levels resulting from heterozygosity for a loss-of-function allele is sufficient to cause disease. This mechanism operates in disorders such as Marfan syndrome, where mutations in the FBN1 gene lead to defective fibrillin, an essential component of the extracellular matrix [2]. The insufficient production of functional fibrillin disrupts the structural integrity of connective tissue, resulting in the characteristic clinical manifestations including cardiovascular, skeletal, and ocular abnormalities.
Dominant-negative effects occur when a mutant gene product interferes with the function of the wild-type allele product within the same cell [9]. This mechanism is particularly common in disorders involving multimeric proteins, where the incorporation of even a single mutant subunit can disrupt the function of the entire protein complex. For example, in tuberous sclerosis complex (TSC), mutations in either TSC1 or TSC2 genes produce defective hamartin or tuberin proteins that dysregulate the mTOR signaling pathway through dominant-negative effects on the TSC protein complex [2].
Gain-of-function mutations confer novel or enhanced activity on a gene product, often leading to toxic effects regardless of the presence of a normal allele [9]. This mechanism operates in disorders such as Huntington disease, where expansion of a triplet repeat within a polyglutamine tract causes cellular toxicity through acquired toxic functions of the mutant huntingtin protein [9]. Similarly, specific mutations can lead to constitutive activation of signaling pathways, disrupting normal cellular regulation and proliferation.
Table 1: Molecular Mechanisms in Autosomal Dominant Disorders
| Mechanism | Molecular Consequence | Example Disorders | Key Features |
|---|---|---|---|
| Haploinsufficiency | Reduced protein levels below functional threshold | Marfan syndrome (FBN1), AD polycystic kidney disease (PKD1/PKD2) | 50% reduction in functional protein sufficient for disease manifestation |
| Dominant-negative | Mutant protein disrupts function of wild-type protein | Tuberous sclerosis complex (TSC1/TSC2), some collagen disorders | Common in multimeric proteins; mutant subunit disrupts entire complex |
| Gain-of-function | Novel or enhanced protein activity with toxic effects | Huntington disease, achondroplasia | Toxic activity regardless of normal allele; often constitutive activation |
| Altered regulation | Disrupted gene expression or splicing | Some forms of familial hypercholesterolemia (LDLR) | May affect promoter regions, splicing sites, or regulatory elements |
Genetic Principles and Allelic Effects
Autosomal dominant inheritance follows Mendel's Law of Dominance and Uniformity, which states that some alleles are dominant over others, and thus mask the recessive allele when both are present [2]. The Law of Segregation further dictates that the two alleles for each gene separate during gametogenesis, so each parent passes only one allele to offspring [2]. This fundamental genetic principle explains the 50% transmission risk from an affected parent to each child, regardless of gender.
An important characteristic of many AD disorders is complete penetrance, meaning that all individuals who inherit the pathogenic variant will eventually express the disease phenotype [9]. Autosomal dominant polycystic kidney disease (ADPKD) exemplifies this principle, as virtually all carriers of pathogenic PKD1 or PKD2 variants develop characteristic renal cysts during their lifetime [9]. However, AD disorders also demonstrate variable expressivity, wherein the severity and specific features of the disease vary among individuals with the same mutation, even within the same family [9]. This variability reflects the influence of modifier genes, environmental factors, and stochastic events on disease manifestation.
Some AD disorders exhibit incomplete penetrance, where not all individuals with the pathogenic variant develop clinical disease [10]. This is particularly evident in inherited cancer susceptibility syndromes, such as those involving BRCA1 and BRCA2 genes, where penetrance figures for BRCA1 are approximately 60% for breast cancer and 40% for ovarian cancer, far from complete penetrance [9]. The concepts of penetrance and expressivity have critical implications for genetic counseling, risk assessment, and clinical management.
Vertical Transmission Patterns in Pedigree Analysis
Characteristic Pedigree Patterns
The autosomal dominant inheritance pattern displays distinctive features in pedigree analysis that facilitate its recognition and differentiation from other inheritance patterns. The most prominent characteristic is vertical transmission, wherein the phenotype appears in multiple generations without skipping [2] [11]. This pattern emerges because each affected individual typically has an affected parent, except in cases of de novo mutations or reduced penetrance.
Additional hallmark pedigree characteristics of AD inheritance include:
- Equal distribution between sexes: Males and females are equally likely to inherit and transmit the disorder [10] [11]
- Male-to-male transmission: Affected males can transmit the disorder to their sons, distinguishing AD inheritance from X-linked dominant inheritance [11]
- 50% transmission risk: Each child of an affected individual has a 50% chance of inheriting the pathogenic variant and the disorder [10] [2]
- Absence of carrier state: Individuals with the pathogenic variant are affected; there are no asymptomatic carriers [9]
The following diagram illustrates the characteristic pedigree pattern of autosomal dominant inheritance:
Exceptions and Complexities in Transmission
While the vertical transmission pattern typically characterizes AD inheritance, several factors can complicate pedigree interpretation and create apparent deviations from the expected pattern. Incomplete penetrance occurs when an individual inherits a pathogenic variant but does not manifest clinical symptoms, creating the appearance of skipped generations [10] [2]. For example, in hereditary cancer syndromes, not all variant carriers develop cancer during their lifetime, potentially obscuring the inheritance pattern.
De novo mutations represent another exception, wherein the pathogenic variant arises spontaneously in an affected individual with no family history of the disorder [2]. Many AD disorders arise frequently from de novo mutations, including an estimated 70% of tuberous sclerosis complex cases [2]. In such cases, the recurrence risk for siblings of the affected individual is low, but the affected individual themselves now face the 50% transmission risk to their offspring.
Germline mosaicism occurs when a parent carries the pathogenic variant in their germline cells but not in somatic cells, allowing them to have multiple affected children without being affected themselves [2]. This phenomenon can create patterns that resemble autosomal recessive inheritance but with higher recurrence risks than typically associated with de novo mutations.
Phenocopies represent another complicating factor, wherein individuals without the pathogenic variant develop similar clinical features through alternative mechanisms [10]. In breast cancer families with BRCA mutations, for instance, sporadic breast cancer cases in non-carriers can create the false impression of reduced penetrance or misassign affected status in pedigree analysis.
Table 2: Transmission Patterns in Autosomal Dominant vs. Autosomal Recessive Inheritance
| Characteristic | Autosomal Dominant | Autosomal Recessive |
|---|---|---|
| Generational pattern | Vertical transmission across generations | Horizontal transmission (often single generation) |
| Carrier status | No carriers; all variant holders affected | Asymptomatic carriers common |
| Parental affected status | Usually one affected parent | Both parents typically unaffected carriers |
| Recurrence risk | 50% for offspring of affected individual | 25% for offspring of carrier parents |
| Consanguinity | Not a significant factor | Increases recurrence risk |
| Sex distribution | Equal in males and females | Equal in males and females |
| Male-to-male transmission | Possible | Possible |
Experimental Methodologies for Analysis
Genetic Testing Approaches
The investigation of autosomal dominant disorders employs specialized genetic testing methodologies designed to identify pathogenic variants in single alleles. Single-gene tests represent the most targeted approach, sequencing or analyzing specific genes associated with known clinical presentations [13]. For patients with characteristic features of a specific AD disorder, such as Marfan syndrome or neurofibromatosis type 1, single-gene testing provides a direct and cost-effective diagnostic pathway.
Gene panel testing utilizes next-generation sequencing to simultaneously examine multiple genes associated with particular clinical presentations or organ systems [13]. This approach is particularly valuable for genetically heterogeneous disorders, such as inherited cardiac conditions or hereditary cancer syndromes, where mutations in numerous different genes can produce similar phenotypes. Panel testing offers the advantage of comprehensive assessment while maintaining focused analysis on clinically relevant genes.
Large-scale genetic tests, including whole exome sequencing (WES) and whole genome sequencing (WGS), provide the most extensive analysis of an individual's genetic material [13]. WES examines the protein-coding regions of all genes, while WGS extends to non-coding regions as well. These approaches are particularly valuable for diagnosing atypical presentations or conditions with unknown genetic etiology. The following diagram illustrates a typical workflow for genetic testing in autosomal dominant disorders:
Functional Validation of Pathogenic Variants
Following genetic testing and variant identification, functional studies are often necessary to establish the pathogenicity of identified variants, particularly for novel or previously uncharacterized mutations. In vitro assays assess the functional consequences of mutations in controlled laboratory settings, using cell cultures or biochemical systems to evaluate protein function, stability, or interaction properties.
Molecular modeling utilizes computational approaches to predict the structural impact of mutations on protein folding, binding sites, or enzymatic activity. This approach is particularly valuable for missense variants of uncertain significance, where changes in amino acid sequence may alter protein structure and function.
Animal models, particularly genetically modified mice, provide systems for studying the in vivo consequences of pathogenic variants and exploring potential therapeutic interventions. These models recapitulate aspects of human disease and allow investigation of pathogenetic mechanisms across developmental stages and tissue types.
For disorders demonstrating dual inheritance patterns (both autosomal dominant and recessive), additional functional studies are required to elucidate the molecular basis of these contrasting patterns [12]. Such genes may exhibit distinct genotype-phenotype correlations based on mutation type, position, or functional consequence, necessitating comprehensive biochemical and cellular characterization.
The Scientist's Toolkit: Research Reagent Solutions
Table 3: Essential Research Reagents for Investigating Autosomal Dominant Disorders
| Reagent Category | Specific Examples | Research Applications | Technical Considerations |
|---|---|---|---|
| Genomic DNA Isolation Kits | QIAamp DNA Blood Mini Kit, PureLink Genomic DNA Kits | Source material for genetic testing; quality critical for sequencing success | Assess concentration, purity (A260/280), and integrity |
| PCR and Sequencing Reagents | Taq polymerase, dNTPs, Sanger sequencing kits, NGS library prep kits | Target amplification and sequencing for variant detection | Optimize annealing temperatures; validate primer specificity |
| Cell Culture Systems | Patient-derived fibroblasts, lymphoblastoid cell lines, iPSCs | Functional studies of pathogenetic mechanisms | Monitor for phenotypic drift in continuous culture |
| Antibodies | Wild-type and mutant protein-specific antibodies, phospho-specific antibodies | Protein expression analysis, localization studies, Western blot | Validate specificity using appropriate controls |
| CRISPR-Cas9 Components | Guide RNAs, Cas9 expression vectors, homology-directed repair templates | Generation of isogenic cell lines, animal models | Optimize delivery efficiency; screen for off-target effects |
| Protein Analysis Reagents | Co-immunoprecipitation kits, crosslinkers, protein stability assays | Assessment of protein-protein interactions, complex formation | Include appropriate controls for nonspecific interactions |
Emerging Concepts and Complex Inheritance Patterns
Genes with Dual Inheritance Patterns
Recent research has identified a subset of genes that demonstrate both autosomal dominant and autosomal recessive inheritance patterns, challenging traditional Mendelian classification systems [12]. These "AD/AR genes" exhibit distinct bioinformatic properties, including intermediate constraint scores (metrics of tolerance to genetic variation), greater average numbers of exons, and an elevated propensity to encode proteins that form homomeric or heteromeric complexes [12].
The mechanistic basis for dual inheritance patterns varies among genes and disorders. In some cases, different mutation types (e.g., loss-of-function vs. missense mutations) or mutation locations within the gene produce distinct inheritance patterns. In other instances, the same mutation may exhibit both dominant and recessive patterns in different families or populations, reflecting the influence of genetic modifiers or environmental factors.
A notable example of this complexity is emerging in deficiency of adenosine deaminase 2 (DADA2), traditionally described as an autosomal recessive condition [14]. Recent evidence indicates that specific ADA2 variants can cause disease in heterozygous carriers through a dominant-negative mechanism, resulting in an autosomal dominant inheritance pattern with incomplete penetrance [14]. This finding has significant implications for diagnostic testing, genetic counseling, and family risk assessment.
Implications for Genetic Counseling and Drug Development
The complexities of autosomal dominant inheritance, including variable expressivity, incomplete penetrance, and emerging dual inheritance patterns, present significant challenges for genetic counseling. Risk assessment and communication must account for these nuances, emphasizing that inheritance patterns represent probabilities rather than certainties. For drug development, understanding the molecular mechanisms underlying AD disorders informs targeted therapeutic strategies.
For haploinsufficiency disorders, therapeutic approaches may aim to upregulate expression from the wild-type allele or compensate for the deficient protein. For dominant-negative disorders, strategies that selectively silence mutant alleles while preserving wild-type expression (e.g., allele-specific RNA interference) hold promise. Gain-of-function disorders may benefit from approaches that directly inhibit the toxic protein or its downstream effects.
The investigation of autosomal dominant inheritance patterns continues to evolve with advancing technologies and accumulating clinical experience. Future research directions include comprehensive characterization of genes with dual inheritance patterns, elucidation of modifier genes that influence expressivity and penetrance, and development of targeted therapies that address the specific molecular consequences of dominant pathogenic variants. These advances will enhance diagnostic accuracy, refine risk prediction, and ultimately improve clinical outcomes for individuals and families affected by autosomal dominant disorders.
Autosomal recessive (AR) inheritance represents a fundamental pattern of Mendelian genetics where phenotypes manifest only when an individual inherits two mutated alleles of a gene, one from each parent [15] [16]. This mechanism underlies thousands of rare genetic disorders, collectively contributing significantly to pediatric morbidity and mortality worldwide [17]. Understanding AR inheritance is crucial for researchers, clinical geneticists, and drug development professionals working to diagnose, manage, and develop therapies for these conditions.
Within the broader context of inheritance pattern research, AR disorders contrast sharply with autosomal dominant (AD) conditions. While AD disorders typically appear in every generation (vertical transmission) and require only a single mutated allele for expression, AR disorders often skip generations and require biallelic mutations [16] [18]. This whitepaper provides an in-depth technical examination of the molecular mechanisms, inheritance patterns, diagnostic methodologies, and research considerations specific to autosomal recessive conditions.
Molecular Mechanisms and Genetic Principles
Fundamental Genetic Laws
Autosomal recessive inheritance follows Mendel's laws of inheritance, particularly the Law of Segregation, which states that each individual carries two alleles for each gene, which segregate during gamete formation [15]. Each parent passes one randomly selected allele to their offspring, resulting in a 25% chance for carrier parents to have an affected child [15].
The term "autosomal" specifies that the gene in question is located on one of the 22 autosomes (non-sex chromosomes) rather than the X or Y sex chromosomes [13]. "Recessive" indicates that both alleles must harbor pathogenic mutations for the disease phenotype to manifest [18].
Biallelic Mutations and Pathogenic Mechanisms
In AR disorders, disease expression requires biallelic mutations—pathogenic variants in both copies of a gene [15]. These mutations typically result in loss of function through various mechanisms:
- Complete gene deletion or inactivation
- Enzyme deficiencies due to catalytic impairment
- Structural protein defects affecting cellular function
Carriers (heterozygotes) with a single mutated allele are typically asymptomatic due to haplosufficiency, where the single functional allele produces sufficient protein to maintain normal cellular function [15]. This contrasts with many AD disorders where haploinsufficiency (inadequate protein from a single functional allele) or dominant-negative effects lead to disease manifestation in heterozygotes [12].
Table 1: Comparison of Inheritance Patterns
| Feature | Autosomal Recessive | Autosomal Dominant |
|---|---|---|
| Alleles Required | Two mutated alleles (biallelic) | One mutated allele (monoallelic) |
| Transmission Pattern | Horizontal (skips generations) | Vertical (every generation) |
| Carrier Status | Heterozygotes are typically asymptomatic | Heterozygotes are affected |
| Recurrence Risk | 25% for carrier parents | 50% for affected parents |
| Common Molecular Mechanisms | Complete loss-of-function | Haploinsufficiency, dominant-negative, gain-of-function |
| Consanguinity Effect | Significantly increases risk | Minimal effect on recurrence risk |
Inheritance Patterns and Pedigree Characteristics
AR disorders typically display horizontal transmission patterns within pedigrees, where multiple affected individuals may appear within the same generation (siblings) but not typically across generations [15]. This contrasts with the vertical transmission pattern characteristic of AD disorders [15].
Several key pedigree features characterize AR inheritance:
- Unaffected carrier parents: Both parents of an affected individual are typically heterozygous carriers [16]
- Sibling clusters: Multiple affected siblings within a single generation [15]
- Generational skipping: Affected individuals often have unaffected offspring [15]
- Consanguinity increase: Higher prevalence in consanguineous families due to shared ancestry [15] [19]
An exception to typical horizontal transmission occurs in pseudodominance, where an affected individual (homozygote) has children with a carrier (heterozygote), resulting in a 50% chance of affected offspring and creating a vertical transmission pattern that mimics AD inheritance [15].
Clinical and Research Considerations
Epidemiology and Population Genetics
AR disorders collectively represent a significant health burden worldwide. Current research indicates that approximately 1 in 300 pregnancies is affected by AR or X-linked conditions globally [20]. Carrier frequencies for AR disorders vary considerably across different populations due to founder effects, genetic drift, and in some cases, heterozygote advantage [15] [19].
Table 2: Carrier Frequencies of Selected Autosomal Recessive Disorders
| Disorder | Gene | Carrier Frequency | High-Risk Populations |
|---|---|---|---|
| Cystic Fibrosis | CFTR | 1 in 30 | Caucasian, Ashkenazi Jewish [15] |
| Tay-Sachs Disease | HEXA | 1 in 27 | Ashkenazi Jewish, French Canadian [15] |
| Sickle Cell Anemia | HBB | 1 in 12 | African, Mediterranean, Middle Eastern [15] |
| Beta Thalassemia | HBB | 1 in 28 | Vietnamese, Mediterranean, Southeast Asian [20] |
| G6PD Deficiency | G6PD | 1 in 20 | Vietnamese, African, Mediterranean [20] |
| Alpha Thalassemia | HBA1/HBA2 | 1 in 25 | Vietnamese, Southeast Asian [20] |
Population isolates and endogamous groups demonstrate particularly high frequencies of specific AR disorders due to founder effects and genetic drift [19]. For example, the Roma population in Europe shows an elevated frequency of rare AR disorders, with researchers having identified 90 distinct AR disorders and 111 pathogenic variants in this population [19].
Some genes demonstrate both AD and AR inheritance patterns depending on the specific variant and its molecular consequences [12]. These "AD/AR genes" typically exhibit distinctive features including intermediate constraint scores, greater average number of exons, and an elevated propensity to form homomeric/heteromeric proteins [12].
Common Autosomal Recessive Disorders
Cystic Fibrosis (CF)
Caused by mutations in the CFTR gene on chromosome 7, CF affects approximately 1 in 1000 White births [15]. The disease affects exocrine glands, leading to lung infections, pancreatic insufficiency, and infertility [15]. The carrier frequency approaches 1 in 25 in Caucasian and Ashkenazi Jewish populations [15].
Hemoglobinopathies
Sickle cell disease and thalassemias represent common AR disorders affecting hemoglobin [15]. Sickle cell disease demonstrates incomplete dominance, where heterozygotes (sickle cell trait) exhibit an intermediate phenotype that provides protection against malaria, explaining its high frequency in malaria-endemic regions [15].
Tay-Sachs Disease
Caused by HEXA gene mutations, Tay-Sachs results in deficiency of hexosaminidase A, leading to GM2 ganglioside accumulation in the brain [15]. Affected infants experience progressive neurodegeneration, with death typically occurring in early childhood [15].
Research Methodologies and Experimental Protocols
Carrier Screening and Molecular Diagnostics
Next-generation sequencing (NGS) has revolutionized carrier screening for AR disorders, enabling simultaneous testing for hundreds of conditions in a single assay [20] [17]. The American College of Medical Genetics and Genomics (ACMG) recommends a tiered approach to carrier screening, with Tier 3 screening (conditions with ≥1/200 carrier frequency) recommended for all pregnant patients [20].
Experimental Protocol: Comprehensive Carrier Screening Using NGS
Sample Collection
- Collect 7-10 ml peripheral venous blood in EDTA tubes [20]
- Ensure proper sample labeling and storage at -20°C until processing
DNA Extraction
- Use validated DNA extraction kits (e.g., QIAamp DNA Blood Micro Kit) [20]
- Quantify DNA concentration using fluorometric methods
- Assess DNA quality via agarose gel electrophoresis or similar methods
Library Preparation and Sequencing
Bioinformatic Analysis
Variant Interpretation and Classification
- Classify variants according to ACMG guidelines [17]
- Report pathogenic and likely pathogenic variants
- Provide carrier status and recurrence risk information
Variant Classification Framework
Research and clinical diagnostics for AR disorders employ sophisticated variant classification systems [17]:
Type 1 Variants: Known pathogenic variants from ClinVar database with established disease association [17]
Type 2 Variants: Presumed loss-of-function variants including:
- Stop-gained (nonsense) mutations
- Frameshift insertions/deletions
- Splice-site variants (acceptor/donor)
- Start-lost mutations [17]
Type 3 Variants: Predicted deleterious missense changes identified using multiple in silico prediction tools (CADD, DANN, Polyphen2, SIFT, phastCons) with established cutoff scores [17]
Type 4 Variants: Potentially harmful in-frame insertions or deletions [17]
The Scientist's Toolkit: Research Reagent Solutions
Table 3: Essential Research Reagents for Autosomal Recessive Disorder Investigation
| Reagent/Resource | Function/Application | Examples/Specifications |
|---|---|---|
| NGS Library Prep Kits | Preparation of sequencing libraries from genomic DNA | Illumina Nextera, Twist Bioscience kits |
| Whole Genome Sequencing Platforms | Comprehensive variant discovery across entire genome | Illumina NextSeq, NovaSeq; PacBio Sequel |
| Targeted Gene Panels | Focused analysis of known AR genes | Custom panels for common AR disorders (CFTR, HEXA, HBB) |
| Sanger Sequencing Reagents | Validation of NGS findings | BigDye Terminator chemistry, capillary electrophoresis |
| Cell Line Models | Functional studies of AR disease mechanisms | Patient-derived fibroblasts, iPSCs, gene-edited cell lines |
| Antibodies for Protein Analysis | Detection of protein expression and localization | Western blot, immunohistochemistry, flow cytometry |
| CRISPR-Cas9 Systems | Gene editing to create disease models | SpCas9, base editors, prime editors for specific mutations |
| Bioinformatic Tools | Variant calling, annotation, and prioritization | GATK, ANNOVAR, Varsome, ExpansionHunter |
| Population Databases | Allele frequency filtering and pathogenicity assessment | gnomAD, 1000 Genomes, dbSNP, ClinVar |
| Protein Prediction Software | In silico analysis of missense variant effects | CADD, PolyPhen-2, SIFT, AlphaFold2 |
Data Analysis and Interpretation
Carrier Frequency Calculations
Research into AR disorders requires accurate calculation of carrier frequencies using large genomic datasets. The established pipeline involves [17]:
Cohort Selection: Utilize large-scale genomic databases (e.g., gnomAD) containing sequencing data from diverse populations [17]
Variant Filtering: Apply stringent quality control metrics and remove variants with:
- Alternative allele frequency ≥ 0.005
- Homozygous calls in presumed healthy individuals
- Poor sequencing quality metrics [17]
Population-Specific Analysis: Calculate carrier frequencies within distinct ethnic groups to account for population genetics differences [17]
Statistical Validation: Compare results across different cohorts with similar ethnicity backgrounds to verify findings (e.g., Pearson correlation coefficient >0.9 between Chinese cohorts) [17]
Pedigree Analysis and Risk Assessment
Accurate interpretation of family history remains crucial for AR disorder investigation:
- Carrier Identification: Asymptomatic individuals with family history of AR disorders
- Consanguinity Assessment: Document parental relatedness which significantly increases AR disorder risk [15] [19]
- Recurrence Risk Calculation: 25% for carrier parents, 50% in pseudodominance scenarios [15]
- Population Risk Integration: Combine family history with population-based carrier frequencies for comprehensive risk assessment
Autosomal recessive inheritance represents a genetically complex but well-characterized pattern of disease transmission with distinct molecular mechanisms and pedigree characteristics. The requirement for biallelic mutations and the resulting horizontal transmission pattern differentiate AR disorders from other inheritance models and present unique challenges for researchers and clinicians.
Advanced molecular techniques, particularly comprehensive carrier screening using NGS, have significantly improved our ability to identify at-risk couples and implement preventive strategies. Population-specific differences in carrier frequencies necessitate tailored approaches to genetic screening and counseling across different ethnic groups.
Ongoing research continues to expand our understanding of AR disorders, including the identification of novel disease genes, characterization of atypical inheritance patterns such as pseudodominance, and investigation of genes with dual AD/AR inheritance capabilities. These advances, coupled with improved therapeutic interventions, promise to reduce the global burden of autosomal recessive disorders through enhanced diagnosis, management, and prevention strategies.
Understanding the molecular mechanisms of disease-causing genetic variants is fundamental to advancing genetic medicine. While numerous pathogenic mutations occur in protein-coding regions, they exert their effects through fundamentally different mechanisms: loss-of-function (LOF), gain-of-function (GOF), and dominant-negative (DN) effects [21]. These mechanisms are intimately connected to the inheritance patterns observed in genetic disorders. Autosomal recessive conditions are overwhelmingly associated with LOF mutations, where both gene copies must be impaired to cause disease [22]. In contrast, autosomal dominant disorders can arise through multiple molecular mechanisms, including LOF (haploinsufficiency), GOF, or DN effects, with significant implications for disease pathology and therapeutic development [23] [24].
The distinction between these mechanisms is not merely academic; it directly informs diagnostic approaches and therapeutic strategies. GOF and DN mutations account for approximately 48% of phenotypes in dominant genes, highlighting their clinical significance [23]. Furthermore, 43% of dominant and 49% of mixed-inheritance genes exhibit intragenic mechanistic heterogeneity, where different mutations within the same gene cause disease through distinct molecular mechanisms [23]. This review provides a comprehensive technical examination of GOF and LOF mechanisms within the framework of inheritance patterns, integrating structural insights, computational predictions, and experimental methodologies.
Molecular Mechanisms and Inheritance Patterns
Autosomal Recessive Inheritance and Loss-of-Function Mechanisms
Autosomal recessive disorders require biallelic mutations that collectively result in complete or near-complete loss of gene function [22]. Affected individuals typically inherit one mutant allele from each parent, both of whom are usually asymptomatic carriers. This pattern reflects the fundamental principle that one functional allele is often sufficient to maintain normal cellular function, a concept known as haplosufficiency [15] [22].
In recessive disorders, LOF mutations primarily include nonsense variants (premature stop codons), frameshifts, splice-site disruptions, and missense mutations that severely destabilize protein structure or disrupt critical functional residues [22]. The resulting phenotypic manifestations occur only when the residual protein activity falls below a critical threshold necessary for normal physiological function.
Clinical Examples:
- Cystic fibrosis: Caused by mutations in the CFTR gene, leading to defective chloride ion transport [15] [22]
- Tay-Sachs disease: Results from HEXA gene mutations causing deficiency of hexosaminidase A and accumulation of GM2 ganglioside [15]
- Sickle cell disease: Caused by homozygous mutations in HBB leading to structural hemoglobin abnormalities [15] [22]
Table 1: Characteristics of Autosomal Recessive LOF Disorders
| Aspect | Characteristics |
|---|---|
| Inheritance Pattern | Horizontal transmission within sibships, often with unaffected parents |
| Molecular Requirement | Biallelic mutations (homozygous or compound heterozygous) |
| Protein Impact | Severe structural destabilization or complete functional ablation |
| Carrier Status | Heterozygotes typically asymptomatic due to haplosufficiency |
| Consanguinity Effect | Increased recurrence risk in consanguineous families |
Autosomal Dominant Inheritance: Diverse Molecular Mechanisms
Autosomal dominant disorders manifest when a single mutant allele is sufficient to cause disease, through several distinct molecular pathways:
Haploinsufficiency (LOF)
In haploinsufficiency, a 50% reduction in protein activity due to a single LOF allele is insufficient to maintain normal function [2] [10]. This mechanism applies to genes where precise protein dosage is critical for biological activity, such as transcription factors or regulatory proteins [24].
Dominant-Negative (DN) Effects
DN mutations occur when a mutant subunit disrupts the function of a multimeric protein complex containing wild-type subunits [21] [24]. The mutant protein must be sufficiently stable to co-assemble with wild-type partners but functionally impaired enough to "poison" the entire complex. Structurally, DN mutations are highly enriched at protein-protein interfaces and tend to have milder destabilizing effects than recessive LOF mutations [21].
Gain-of-Function (GOF)
GOF mutations confer new or enhanced activities to the protein, including:
- Constitutive activation without normal regulatory constraints
- Altered binding specificity for substrates or interaction partners
- Novel toxic functions such as aggregation propensity [21] [25]
Unlike LOF mutations, GOF variants often cluster in specific functional domains and cause minimal protein destabilization [23].
Table 2: Molecular Mechanisms in Autosomal Dominant Disorders
| Mechanism | Structural Impact | Functional Consequence | Example Disorders |
|---|---|---|---|
| Haploinsufficiency (LOF) | Severe destabilization | Reduced protein dosage | Marfan syndrome (FBN1), Tuberous sclerosis (TSC1/TSC2) [2] |
| Dominant-Negative | Mild destabilization, interface disruption | Disruption of multimeric complexes | Collagenopathies, long QT syndrome [23] [24] |
| Gain-of-Function | Minimal destabilization, functional site alterations | Enhanced or novel protein activity | STAT1 GOF (chronic mucocutaneous candidiasis) [25] |
Structural and Computational Insights
Protein Structural Effects of Different Mechanisms
The structural consequences of pathogenic missense mutations vary dramatically between molecular mechanisms. Studies analyzing ΔΔG values (changes in Gibbs free energy of folding) reveal that recessive LOF mutations cause severe protein destabilization (average |ΔΔG| = 3.89 kcal mol⁻¹), while dominant non-LOF mutations (DN and GOF) have markedly milder effects [21] [24]. This distinction arises because DN mutations must preserve the ability to co-assemble with wild-type subunits, while GOF mutations typically avoid global unfolding to maintain their altered function.
The structural location of mutations also differs between mechanisms. LOF mutations are distributed throughout protein structures, affecting both buried and surface residues critical for folding stability. In contrast, DN mutations cluster at protein-protein interfaces, and GOF mutations concentrate in functional domains such as active sites or regulatory regions [21] [23].
Consideration of full biological assemblies rather than isolated monomers significantly improves the identification of disease mutations, particularly for DN variants where intermolecular interactions are critical [21] [24]. This highlights the importance of structural context for understanding pathogenicity.
Computational Prediction of Molecular Mechanisms
Accurate computational prediction of variant effects remains challenging, particularly for non-LOF mechanisms. Most variant effect predictors (VEPs), including those based on sequence conservation, demonstrate reduced performance for DN and GOF mutations compared to LOF mutations [21] [25]. This limitation stems from the fundamental differences in structural constraints between mechanism types.
Recent advances integrate multiple structural features to improve mechanism prediction:
The mLOF Score
The missense LOF (mLOF) likelihood score integrates both the energetic impact (ΔΔG) and spatial clustering (Extent of Disease Clustering, EDC) of pathogenic variants [23]. This approach leverages the observation that LOF variants tend to be highly destabilizing and spread throughout the structure, while non-LOF variants cause milder destabilization and cluster in specific regions. The mLOF score achieves a balanced accuracy of 71.2% in distinguishing LOF from non-LOF mechanisms [23].
LoGoFunc
The LoGoFunc machine learning method represents a significant advancement in genome-wide prediction of GOF and LOF variants [25]. Trained on 474 diverse features derived from AlphaFold2-predicted structures, protein interaction networks, evolutionary constraints, and other biological characteristics, LoGoFunc outperforms general pathogenicity predictors for mechanism classification. The model employs an ensemble of LightGBM classifiers and provides precomputed predictions for all missense variants in canonical human transcripts [25].
Table 3: Performance Metrics for Mechanism Prediction Methods
| Method | Features | LOF vs Non-LOF AUROC | Key Applications |
|---|---|---|---|
| Stability predictors (FoldX) | Absolute ΔΔG values | 0.677 [21] | Identifying destabilizing LOF mutations |
| mLOF Score | ΔΔGrank + EDC | 0.714 (single phenotype genes) [23] | Phenotype-level mechanism prediction |
| LoGoFunc | 474 diverse features (structural, evolutionary, network-based) | State-of-the-art for GOF/LOF classification [25] | Genome-wide variant interpretation |
Experimental Methodologies
Structure-Based Stability Assessments
Protein stability assays provide direct experimental evaluation of LOF mutations. The core methodology involves:
Experimental Workflow
Diagram 1: Protein Stability Assay Workflow
Protein Expression and Purification
- Express wild-type and variant proteins in appropriate systems (E. coli, mammalian cells)
- Purify using affinity chromatography (His-tag, GST-tag) followed by size exclusion chromatography
- Verify purity and monodispersity via SDS-PAGE and dynamic light scattering
Stability Measurements
- Thermal shift assays: Monitor fluorescence changes with temperature increase to determine melting temperature (Tₘ)
- Chemical denaturation: Use urea or guanidine HCl denaturation curves monitored by circular dichroism or fluorescence to calculate ΔG of unfolding
- Proteolytic sensitivity: Assess resistance to limited proteolysis as indicator of structural integrity
Data Analysis
- Calculate ΔΔG values between wild-type and variant proteins
- Correlate stability changes with functional impairments
- Classify variants as destabilizing (LOF) or stability-neutral (potential non-LOF)
For DN mutations, additional complex formation assays (co-immunoprecipitation, analytical ultracentrifugation, surface plasmon resonance) determine whether mutant subunits incorporate into multimers and inhibit wild-type function [21].
Functional Characterization of GOF Mutations
GOF mutations require specialized assays tailored to the specific gained function:
Experimental Workflow
Diagram 2: GOF Variant Characterization
Cellular Assays
- Constitutive signaling: Measure downstream pathway activation in absence of normal stimuli (e.g., phospho-specific antibodies, reporter gene assays)
- Altered localization: Visualize subcellular distribution using immunofluorescence or live-cell imaging with GFP-tagged proteins
- Aggregation propensity: Assess protein solubility and aggregation using filter trap assays or microscopy
Biochemical Assays
- Enzyme kinetics: Determine KM, Vmax, and catalytic efficiency for enzymatic GOF variants
- Binding affinity: Quantify interactions with substrates, cofactors, or binding partners using isothermal titration calorimetry or surface plasmon resonance
- Specificity profiling: Screen against alternative substrates or targets to identify altered specificity
Physiological Assays
- Animal models: Express GOF variants in model organisms (mice, zebrafish) to assess organism-level effects
- Electrophysiology: For channelopathies, measure ionic currents and gating properties using patch clamp techniques
- High-throughput screening: Implement functional assays in multi-well format for systematic GOF variant characterization
The Scientist's Toolkit: Research Reagent Solutions
Table 4: Essential Research Reagents for Mechanism Studies
| Reagent/Category | Specific Examples | Function/Application | Mechanism Relevance |
|---|---|---|---|
| Structure Prediction | AlphaFold2 models, FoldX | Predict protein structures and stability effects | All mechanisms [25] |
| Stability Assays | Thermal shift dyes (SYPRO Orange), Urea/GdnHCl | Experimental stability measurement | LOF, DN discrimination [21] |
| Interaction Mapping | Co-IP antibodies, FRET pairs, SPR chips | Protein-protein interaction analysis | DN mechanism validation [21] |
| Computational Tools | LoGoFunc, mLOF score, CADD, REVEL | Computational variant effect prediction | Mechanism classification [23] [25] |
| Expression Systems | Mammalian (HEK293), Bacterial (E. coli) | Recombinant protein production | Functional characterization |
| Variant Libraries | Saturation mutagenesis, Patient-derived variants | Functional screening | Mechanism-pathotype correlation |
Therapeutic Implications and Future Directions
The molecular mechanism of pathogenic variants directly informs therapeutic strategy development. LOF disorders are often amenable to gene replacement therapies or approaches that boost residual protein function [23]. In contrast, GOF and DN disorders typically require inhibitory approaches such as small-molecule inhibitors, targeted degradation, or allele-specific silencing [23].
The presence of intragenic mechanistic heterogeneity - where different mutations in the same gene cause disease through distinct mechanisms - presents both challenges and opportunities for precision medicine [23]. In such genes, therapeutic approaches must be tailored to the specific mechanism of each patient's mutation rather than applying a uniform treatment strategy.
Future research directions include:
- Developing improved computational methods that integrate structural, evolutionary, and functional data
- Expanding high-throughput experimental characterization of variant effects
- Creating mechanism-specific therapeutic platforms targeting shared pathological features
- Advancing allele-specific interventions that selectively target mutant alleles while sparing wild-type function
As our understanding of molecular mechanisms deepens and therapeutic technologies advance, mechanism-based treatment strategies will increasingly enable personalized approaches to genetic disorders.
The analysis of family pedigrees remains a cornerstone of clinical genetics, providing critical insights into the transmission of hereditary disorders. Understanding whether a condition follows an autosomal dominant or autosomal recessive pattern is fundamental to estimating recurrence risks, guiding molecular testing, and informing drug development strategies. This framework originates from Mendelian inheritance principles, which describe how genetic traits are passed through generations via autosomes—the 22 paired chromosomes not involved in sex determination [13]. Autosomal inheritance patterns explain how genetic variants in single genes cause disorders, distinct from polygenic or chromosomal conditions [18].
Pedigree analysis enables researchers to determine the mode of inheritance by identifying characteristic patterns within family trees. This analysis forms the basis for genetic counseling, risk assessment, and the development of targeted genetic therapies. For pharmaceutical researchers, recognizing these patterns aids in identifying patient populations for clinical trials and understanding potential hereditary responses to therapeutics. This technical guide examines the defining characteristics, methodologies, and research applications of autosomal dominant and recessive pedigree analysis within the broader context of inheritance pattern research.
Fundamental Genetic Concepts and Definitions
Mendelian Inheritance Principles
Mendelian genetics provides the theoretical foundation for pedigree analysis, based on Gregor Mendel's three fundamental laws [2]. The Law of Segregation states that each individual possesses two alleles for a trait, which separate during gamete formation so each gamete carries only one allele. The Law of Independent Assortment describes how genes for different traits segregate independently during gamete formation. The Law of Dominance establishes that some alleles are dominant over others, with dominant traits expressed when at least one dominant allele is present [15].
Key Terminology in Pedigree Analysis
- Proband: The first family member identified with the disorder of interest; the index case that initiates pedigree construction [26]
- Autosomal Dominant: Inheritance pattern where a single copy of a mutant allele is sufficient to cause the disorder [2]
- Autosomal Recessive: Inheritance pattern requiring two copies of a mutant allele for the disorder to manifest [15]
- Penetrance: The proportion of individuals with a disease-causing variant who exhibit clinical symptoms [2]
- Consanguinity: Genetic relatedness between individuals who share recent common ancestors, increasing risk for recessive disorders [15]
- Carrier: An individual with one copy of a recessive mutant allele who typically does not show disease symptoms [27]
Autosomal Dominant Inheritance Patterns
Characteristic Pedigree Features
Autosomal dominant disorders display distinctive pedigree patterns that reflect their inheritance mechanism. Affected individuals typically have at least one affected parent, and the disorder appears in multiple generations without skipping [2]. This creates vertical transmission patterns where the trait can be traced through multiple vertical lines in the pedigree [15]. Males and females are equally likely to be affected and to transmit the disorder, with approximately 50% of offspring at risk when one parent is affected [2]. Affected family members are typically heterozygous for the dominant mutant allele [28].
Two exceptions to these patterns include de novo mutations, where a disorder appears in an individual with no family history, and reduced penetrance, where an individual inherits the mutant allele but does not express the disorder phenotype [2]. Age-dependent penetrance may also obscure inheritance patterns in disorders that manifest later in life.
Molecular Mechanisms and Genotype Correlations
In autosomal dominant disorders, the disease phenotype manifests despite the presence of one normal allele. Molecular mechanisms include haploinsufficiency (where a single functional copy does not produce sufficient protein), dominant-negative effects (where mutant protein disrupts function of normal protein), and gain-of-function mutations (where mutant protein acquires new toxic functions) [2].
Table 1: Characteristic Features of Autosomal Dominant Inheritance
| Feature | Description | Research Implications |
|---|---|---|
| Transmission Pattern | Vertical, appears in multiple generations | Enables tracking through large pedigrees for gene mapping |
| Parent-Offspring | Affected individual has 50% chance of passing to offspring | Consistent recurrence risk simplifies genetic counseling |
| Sex Distribution | Males and females equally affected | No sex-linked modifiers expected in purely autosomal pattern |
| Sporadic Cases | Can occur due to de novo mutations | Complicates diagnosis; requires molecular confirmation |
Clinical and Research Examples
Marfan syndrome exemplifies autosomal dominant inheritance, resulting from mutations in the FBN1 gene on chromosome 15 encoding fibrillin-1 [2]. The disorder affects approximately 1 in 5,000-10,000 individuals worldwide without ethnic, geographic, or social class predilection. Clinical manifestations involve the skeletal, ocular, and cardiovascular systems, with cystic medial necrosis of the aorta representing the most life-threatening complication.
Tuberous sclerosis complex (TSC) demonstrates another autosomal dominant pattern, with about 30% of cases inherited and 70% resulting from de novo mutations [2]. TSC results from loss-of-function mutations in either TSC1 (encoding hamartin) or TSC2 (encoding tuberin), leading to dysregulated mTOR signaling and clinical manifestations including facial angiofibromas, renal angiomyolipomas, and neurological symptoms.
Autosomal Recessive Inheritance Patterns
Characteristic Pedigree Features
Autosomal recessive disorders exhibit fundamentally different pedigree patterns from dominant conditions. Typically, affected individuals are usually siblings within a single generation, with unaffected parents who are often carriers [15]. This creates a horizontal transmission pattern where multiple affected individuals appear in the same generation but not necessarily in previous or subsequent generations [15]. Consanguinity significantly increases the risk for autosomal recessive disorders, as related parents are more likely to carry the same recessive mutation [15] [29].
Autosomal recessive conditions can manifest through either homozygosity (two identical mutant alleles) or compound heterozygosity (two different mutant alleles in the same gene) [27]. Carrier parents have a 25% chance with each pregnancy of having an affected child, a 50% chance of having an asymptomatic carrier, and a 25% chance of having a child with two normal alleles [15] [27].
Molecular Mechanisms and Genotype Correlations
In autosomal recessive disorders, both alleles must be mutated for the disease to manifest. Molecular mechanisms typically involve loss-of-function mutations that eliminate or significantly reduce protein activity. Carriers with one functional allele are usually asymptomatic because the single normal allele produces sufficient protein for normal function, a phenomenon known as haplosufficiency [15].
Table 2: Characteristic Features of Autosomal Recessive Inheritance
| Feature | Description | Research Implications |
|---|---|---|
| Transmission Pattern | Horizontal, often limited to single generation | May require extended family screening to identify patterns |
| Parent-Offspring | Two carrier parents have 25% affected offspring | Risk calculation constant for each pregnancy |
| Consanguinity | Increases recurrence risk | Important consideration in genetic counseling |
| Carrier Frequency | Varies by population and disorder | Impacts screening strategy design |
Clinical and Research Examples
Cystic fibrosis (CF) represents one of the most common autosomal recessive disorders in Caucasian populations, affecting approximately 1 in 1,000 births with a carrier frequency of 1 in 30 [15]. CF results from mutations in the CFTR gene on chromosome 7, which encodes a chloride channel protein. The most common mutation, p.Phe508del, accounts for approximately 72% of CF alleles in Caucasian populations but shows significant geographic variation [29].
Sickle cell disease demonstrates how autosomal recessive disorders can provide heterozygote advantage in specific environments. The disorder results from mutations in HBB encoding hemoglobin, with the p.Glu6Val mutation causing sickling of red blood cells under low oxygen conditions [15]. Carriers (with sickle cell trait) have protection against severe malaria, explaining the high allele frequency in malaria-endemic regions [15]. Carrier frequency for the p.Glu6Val mutation exceeds 30% in some African populations, compared to near absence in East Asian populations [29].
Tay-Sachs disease illustrates the profound impact of population-specific founder effects on autosomal recessive disorder prevalence. This neurodegenerative disorder results from HEXA gene mutations, with carrier frequency approximately 10 times higher in Ashkenazi Jewish populations (1 in 27) compared to other populations [15] [29].
Pedigree Analysis Methodologies
Standardized Pedigree Construction Protocols
Accurate pedigree analysis requires standardized symbols and notation to ensure consistent interpretation across research and clinical settings. The established protocol specifies circles for females, squares for males, and diamonds for unspecified gender [26]. Shaded symbols indicate affected individuals, while clear symbols represent unaffected individuals [28]. A horizontal line connecting two individuals represents mating, with vertical lines extending to their offspring [26]. Siblings should be drawn from left to right in birth order [26].
The proband (index case) should be clearly marked with an arrow, and each symbol should be labeled with current age or age at death, known diagnoses with age of onset, and relevant clinical information [26]. For research purposes, additional information including residence, ethnicity, and willingness to participate in research should be documented [26].
Diagnostic Algorithm for Inheritance Pattern Determination
The pedigree analysis algorithm begins with comprehensive family history collection, followed by systematic pattern recognition. Key decision points include assessing whether affected individuals appear in multiple generations (suggesting dominant inheritance) or primarily in a single generation (suggesting recessive inheritance) [15] [2]. Additional considerations include evaluating for male-to-male transmission (which excludes X-linked inheritance), assessing parental consanguinity, and determining sex distribution of affected individuals [28].
Advanced Analytical Techniques
Modern pedigree analysis incorporates computational tools for complex scenarios. Linkage analysis uses pedigree data to map disease genes by tracking co-segregation of genetic markers and disease phenotypes. Risk calculation algorithms incorporate Bayesian methods to integrate pedigree information with genetic test results. Population-adjusted genetic screening panels leverage ethnogeographic variant frequency data to optimize carrier detection rates [29].
Research Reagent Solutions for Genetic Studies
Table 3: Essential Research Reagents for Pedigree Analysis and Genetic Studies
| Reagent/Resource | Function/Application | Technical Specifications |
|---|---|---|
| Whole Exome Sequencing Kits | Identification of coding variants in affected individuals | Coverage: >95% of exonic regions; Depth: >100x for heterozygote detection |
| SNP Microarrays | Genotype analysis for linkage studies and homozygosity mapping | Density: 1-4 million markers; Includes disease-relevant variants |
| Sanger Sequencing Reagents | Validation of putative pathogenic variants identified by NGS | Accuracy: >99.99%; Capable of detecting mosaicism at >20% variant allele frequency |
| Cell Culture Media for Fibroblasts | Establishment of cell lines from affected individuals for functional studies | Supports growth of primary human fibroblasts; Serum-free options available |
| CRISPR-Cas9 Gene Editing Systems | Functional validation of putative pathogenic variants | Knock-in efficiency optimized for human cell lines; Includes controls |
| Population-Specific Genotype Panels | Carrier screening adjusted for ethnogeographic background | Includes founder mutations specific to target population [29] |
| Bioinformatics Pipelines | Annotation and prioritization of sequence variants | Integrates population frequency, prediction algorithms, and clinical databases |
Population Genetics and Epidemiological Considerations
Global Distribution of Autosomal Recessive Disorders
Autosomal recessive disorders demonstrate striking population-specific differences in prevalence and genetic heterogeneity. Recent analysis of 508 genes associated with 450 AR disorders across 141,456 individuals from seven ethnogeographic groups revealed that 27% of AR diseases are limited to specific populations, while 68% show more than tenfold prevalence differences across major population groups [29]. These differences result from a combination of founder effects, genetic drift, and in some cases, heterozygote advantage.
Carrier frequencies for common autosomal recessive disorders vary dramatically between populations. For example, cystic fibrosis carrier frequency for the p.Phe508del mutation is 1 in 40 in European populations but nearly absent in East Asian populations [29]. Similarly, the HFE p.Cys282Tyr mutation causing hereditary hemochromatosis shows 300-fold higher carrier frequency in Europeans (1 in 9) compared to East Asians (1 in 3,000) [29].
Founder Effects and Population Genetics
Founder effects occur when a population originates from a small group of ancestors, some of whom carried specific genetic variants. This phenomenon explains the high frequency of certain autosomal recessive disorders in specific populations. For example, Ashkenazi Jewish populations show elevated frequencies of Tay-Sachs disease (HEXA mutations), Gaucher disease (GBA mutations), and Canavan disease (ASPA mutations) due to founder effects [29]. Similarly, the p.Trp1282Ter CFTR mutation accounts for 46% of cystic fibrosis cases in Ashkenazi Jews compared to only 1.5% in Europeans [29].
Molecular Genetic Complexity
The genetic complexity of autosomal recessive disorders varies significantly between conditions. Some disorders, like Stargardt disease (ABCA4) and sucrase-isomaltase deficiency (SI), demonstrate extreme genetic heterogeneity with hundreds of pathogenic variants [29]. Other disorders show concentration in specific pathogenic variants, enabling more targeted genetic screening approaches. This complexity has direct implications for genetic test design, as standardized panels that don't consider population differences may perform poorly in populations with specific founder mutations [29].
Research Applications and Drug Development Implications
Patient Stratification for Clinical Trials
Accurate pedigree analysis and inheritance pattern determination enable precise patient stratification for clinical trials. Understanding whether a condition follows autosomal dominant or recessive inheritance helps identify candidate populations for gene-based therapies. For clinical trials, pedigree analysis can identify extended family networks that may qualify for recruitment, particularly for rare genetic disorders.
Therapeutic Target Identification
Pedigree analysis facilitates the identification of novel therapeutic targets through the study of large families with multiple affected individuals. Linkage analysis in dominant families can narrow candidate regions, while homozygosity mapping in consanguineous recessive families can identify disease genes. Understanding inheritance patterns also informs therapeutic approaches—recessive disorders may benefit from gene replacement strategies, while dominant disorders may require gene silencing or correction approaches.
Pharmacogenomic Considerations
Inheritance patterns influence pharmacogenomic responses. For example, autosomal recessive mutations in drug metabolism enzymes (like TPMT and UGT1A1) can lead to dramatically different drug processing compared to dominant patterns. Pedigree analysis can identify family members at risk for adverse drug reactions based on inherited metabolic deficiencies.
Pedigree analysis remains an essential tool for determining inheritance patterns of genetic disorders. The characteristic family patterns of autosomal dominant and recessive inheritance provide the foundation for risk assessment, molecular testing strategies, and therapeutic development. Autosomal dominant disorders typically show vertical transmission across generations with 50% recurrence risk, while autosomal recessive disorders display horizontal patterns within generations with 25% recurrence risk when both parents are carriers.
Understanding these patterns requires consideration of exceptions including de novo mutations, reduced penetrance, pseudodominance, and population-specific founder effects. Modern pedigree analysis integrates traditional pattern recognition with population genetic data and molecular diagnostics to provide comprehensive risk assessment. For drug development professionals and researchers, these analyses inform clinical trial design, patient stratification, and therapeutic target identification, ultimately contributing to the development of precision medicine approaches for genetic disorders.
The inheritance pattern of a genetic disorder is fundamentally rooted in the nature of the underlying molecular mechanism and the dosage sensitivity of the affected gene. Autosomal dominant (AD) inheritance often arises through haploinsufficiency (where a single mutated copy results in insufficient protein production), dominant-negative effects (where the faulty protein disrupts the function of the normal protein produced by the healthy allele), or gain-of-function (GoF) effects (where the mutation confers a new, often toxic, function to the protein) [12]. In contrast, autosomal recessive (AR) inheritance typically results from a complete or partial loss of function (LoF), where both gene copies must be compromised to cause disease, indicating that a single functional allele is often sufficient to maintain normal physiological function [12].
Notably, a subset of genes demonstrates both AD and AR inheritance patterns, often leading to distinct or similar phenotypes depending on the specific molecular mechanism at play [12]. Genes with these dual modes of inheritance possess unique bioinformatic properties, including intermediate constraint scores and a greater propensity to form protein complexes, highlighting the complex interplay between gene function, tolerance to variation, and inheritance [12].
Differential Gene Expression Patterns
Gene expression profiles across tissues provide critical insights into why some genes cause dominant diseases while others follow recessive inheritance. Systematic analyses integrating transcriptome data with genetic disorder knowledge bases reveal distinct expression patterns.
Table 1: Gene Expression Patterns in Dominant vs. Recessive Disorders
| Feature | Autosomal Dominant (AD) Genes | Autosomal Recessive (AR) Genes |
|---|---|---|
| Expression in Affected Tissues | Pronounced upregulation in disease-affected tissues [30] | Less brain-centered expression patterns [31] |
| Tissue-Specificity Association | Stronger association between elevated expression and affected tissues [30] | Weaker association between expression level and tissue affection [30] |
| Developmental Cortex Expression | Differential expression patterns in monoallelic models [7] | Differential expression patterns in bi-allelic models [7] |
| Functional Pathway Enrichment | - | Enriched in metabolic processes, muscle organization, and metal ion homeostasis [31] |
Research on neurodevelopmental disorders (NDDs) shows that genes following recessive patterns are more enriched in metabolic processes, muscle organization, and metal ion homeostasis pathways [31]. In contrast, dominant genes are more likely to be upregulated in tissues affected by the corresponding disorder, suggesting their dosage sensitivity makes them more vulnerable to haploinsufficiency [30].
Genic Intolerance and Constraint Metrics
Genic intolerance metrics quantify the degree to which genes are under purifying selection and are intolerant to functional genetic variation. These metrics are powerful tools for identifying genes associated with severe, early-onset disorders.
- Dominant Gene Constraint: Genes associated with autosomal dominant disorders are typically under strong purifying selection and are highly depleted of loss-of-function (LoF) variants in the general population [7]. They exhibit high constraint scores (e.g., high pLI or LOEUF scores), indicating intolerance to heterozygous, protein-disrupting variation.
- Recessive Gene Constraint: Genes associated with autosomal recessive disorders are generally more tolerant of genetic variation [31]. They exhibit lower constraint scores, as they can accumulate LoF variants in the population without causing disease in heterozygous carriers.
- Intermediate Constraint in AD/AR Genes: Genes capable of both dominant and recessive inheritance display intermediate constraint scores, reflecting their unique functional positioning between strict haploinsufficiency and complete redundancy [12].
Table 2: Comparative Analysis of Genic Constraint and Features
| Characteristic | AD Genes | AR Genes | AD/AR Genes |
|---|---|---|---|
| Selection Pressure | Strong purifying selection against heterozygous LoF [7] | Tolerant of heterozygous LoF variants [31] | Intermediate purifying selection [12] |
| gnomAD Constraint | High (e.g., high pLI, low LOEUF) [7] | Low (e.g., low pLI, high LOEUF) [31] | Intermediate [12] |
| Protein Complexity | - | - | Elevated propensity for homomeric/heteromeric complexes [12] |
| Genomic Structure | - | - | Greater average number of exons [12] |
Machine learning models that incorporate these intolerance metrics, along with hundreds of other genetic and genomic features, have demonstrated high predictive power (AUCs: 0.84–0.95) in identifying new NDD risk genes in an inheritance-specific manner [7] [32]. These models reveal that top-ranked candidate genes are up to 2-fold (monoallelic/dominant models) and 6-fold (bi-allelic/recessive models) more enriched for high-confidence NDD risk genes compared to using intolerance metrics alone [7].
Experimental and Computational Methodologies
Inheritance-Specific Machine Learning for Gene Discovery
The following workflow outlines a modern computational approach for predicting disease genes, accounting for inheritance patterns.
Protocol Details:
- Seed Gene Curation: High-confidence "seed" genes are first curated from authoritative sources like OMIM, SFARI, and DDG2P. These are genes with established disease associations [7].
- Inheritance Stratification: Seed genes are meticulously stratified into monoallelic (dominant) and bi-allelic (recessive) groups based on documented mechanisms of inheritance [7].
- Feature Integration: A wide array of ~300 orthogonal genomic features is assembled for each gene. Key features include:
- Single-cell RNA sequencing (scRNA-seq) data from relevant tissues (e.g., developing human cortex) to capture cell-type-specific expression patterns [7].
- Genic intolerance metrics (e.g., from gnomAD) to quantify tolerance to variation [7].
- Protein-protein interaction (PPI) data, as genes forming complexes are more likely to exhibit dominant-negative effects [12] [31].
- Model Training and Prediction: A semi-supervised machine learning framework (mantis-ml) is trained on the seed genes and their features to generate genome-wide, inheritance-specific risk probability scores [7] [32].
- Validation: Top predictions are validated by assessing their enrichment in independent, high-confidence gene sets from large sequencing studies and their prevalence in scientific literature compared to low-ranking genes [7].
Differential Gene Expression (DGE) Analysis
DGE analysis identifies genes whose expression levels differ significantly between disease states (e.g., affected vs. control), which can highlight candidate genes and pathways.
Protocol Details:
- Sample Collection and RNA Extraction: Obtain post-mortem tissue from affected and control individuals. Extract RNA ensuring high quality (e.g., RIN > 2) [33].
- RNA Sequencing and QC: Perform RNA sequencing (e.g., Illumina). Conduct quality control using tools like FastQC and Trimmomatic to remove low-quality reads and adapters [33].
- Alignment and Quantification: Map sequenced reads to a reference genome (e.g., hg38) using aligners like STAR. Perform gene-level quantification with tools such as RSEM [33].
- Differential Expression Analysis: Use statistical models (e.g., in R/Bioconductor packages like DESeq2 or limma) to identify genes with significant expression changes between case and control groups, adjusting for covariates like batch, sex, and estimated cell-type proportions [33].
The Scientist's Toolkit: Research Reagent Solutions
Table 3: Essential Reagents and Resources for Inheritance Pattern Research
| Research Reagent / Resource | Function and Application | Example Use Case |
|---|---|---|
| gnomAD Database | Provides genic intolerance metrics (pLI, LOEUF) to quantify gene constraint against variation [7] [31]. | Prioritizing candidate genes for dominant disorders based on high constraint scores. |
| GTEx (Genotype-Tissue Expression) | Delivers normalized transcript-level data (TPM) across healthy human tissues [31] [30]. | Assessing if a disease gene is highly expressed in affected tissues. |
| Single-cell RNA-seq Data | Reveals cell-type-specific expression patterns in development and disease [7]. | Modeling differences in monoallelic vs. bi-allelic gene expression in the fetal cortex. |
| Spatially Resolved Transcriptomics (SRT) | Maps gene expression within the context of tissue architecture; platforms include 10x Visium and Xenium [34]. | Linking gene expression patterns to specific tissue or cellular neighborhoods. |
| Protein-Protein Interaction (PPI) Networks | Maps physical interactions between proteins; useful for identifying complex subunits [31]. | Identifying genes with potential for dominant-negative effects (common in AD/AR genes). |
| DDG2P / OMIM / SFARI | Expert-curated databases of established disease genes and their inheritance patterns [7]. | Curating high-confidence seed genes for model training and validation. |
| mantis-ml Framework | A semi-supervised machine learning framework for disease gene prediction [7] [32]. | Integrating multi-modal data to generate inheritance-specific risk gene scores. |
The distinct profiles of dominant and recessive disease genes—in their expression patterns, intolerance to variation, and network properties—provide a powerful framework for interpreting genetic findings and guiding discovery. The integration of large-scale genomic data, particularly through inheritance-aware machine learning models, is significantly accelerating the identification of novel risk genes [7] [32].
Future research directions will involve refining these models with even more diverse datasets, including expanded ancestral diversity beyond European-ancestry cohorts [33], and incorporating emerging technologies like deep learning prediction of spatial gene expression from histology [34]. A deeper understanding of the molecular mechanisms that allow some genes to manifest disease through both dominant and recessive patterns will further refine variant interpretation and bring us closer to personalized therapeutic interventions.
From Variant to Therapy: Application of Inheritance Patterns in Diagnosis and Drug Development
The efficacy of genetic testing in both research and clinical practice is fundamentally dependent on a precise understanding of inheritance patterns. For researchers, scientists, and drug development professionals, tailoring experimental and analytical strategies to the specific mode of inheritance is not merely beneficial—it is a prerequisite for generating meaningful, interpretable data. The genetic architecture of a disorder, defined by whether it follows autosomal dominant, autosomal recessive, or X-linked inheritance, directly dictates which genetic variants are pathogenic, the expected population frequency of these variants, and the appropriate methodological framework for their detection [35]. Utilizing an incorrect inheritance model can lead to false negative results, misinterpretation of variant pathogenicity, and ultimately, flawed scientific conclusions and therapeutic targets.
This guide provides an in-depth technical framework for aligning genetic testing strategies with inheritance patterns. It details specific experimental protocols, analytical workflows, and validation metrics, with a particular focus on advanced machine learning applications that leverage inheritance-specific models to accelerate gene discovery [7]. The principles outlined herein are essential for optimizing the design of genetic studies, from initial gene discovery and validation to the development of targeted therapies.
Inheritance Pattern Fundamentals and Clinical Implications
A thorough grasp of Mendelian inheritance patterns is the foundation upon which targeted genetic testing strategies are built. Each pattern has distinct implications for disease risk, transmission, and the optimal approach for genetic analysis.
Autosomal Dominant Inheritance
- Molecular Mechanism: A single pathogenic variant in one allele of an autosomal gene is sufficient to cause the disorder. This often occurs through haploinsufficiency (where a single functional copy of the gene is inadequate for normal function) or a dominant-negative effect (where the mutant gene product disrupts the function of the wild-type product) [7].
- Risk to Offspring: An affected individual has a 50% chance of passing the pathogenic variant to each offspring [36].
- Research & Testing Implications: The focus is on identifying heterozygous variants in the affected individual. De novo (new) mutations are a common cause, especially in severe neurodevelopmental disorders where reproductive fitness is reduced [7]. Genetic testing strategies must be sensitive enough to detect these single-copy variants.
Autosomal Recessive Inheritance
- Molecular Mechanism: Typically, biallelic pathogenic variants—one on each allele of the gene—are required for the disorder to manifest. Individuals with a single variant are carriers and are usually asymptomatic [36] [35].
- Risk to Offspring: The offspring of two carriers have a 25% chance of being affected, a 50% chance of being an asymptomatic carrier, and a 25% chance of inheriting no pathogenic variants [36].
- Research & Testing Implications: The primary goal is to identify compound heterozygous or homozygous pathogenic variants. Carrier screening programs are particularly valuable for this category, as they aim to identify at-risk couples before conception [37] [36]. The variants involved may be more common in the population than those causing dominant disorders, as they are "shielded" from natural selection in carriers.
X-Linked Inheritance
- Molecular Mechanism: The pathogenic variant is located on the X chromosome. The expression and transmission of the disorder differ markedly between sexes [36] [38].
- Expression and Risk:
- Males (XY): Hemizygous for the X chromosome. A single pathogenic variant will typically cause the full disorder. They cannot transmit the variant to their sons but will transmit it to all their daughters, who will be carriers [36] [38].
- Females (XX): Heterozygous females are typically carriers. Due to X-chromosome inactivation, their presentation can range from asymptomatic to fully affected, depending on the pattern of inactivation [36].
- Research & Testing Implications: Analysis must be targeted to the X chromosome. Specialized algorithms are often needed to account for the unique inheritance pattern and the potential for variable expressivity in females.
Table 1: Core Characteristics and Testing Implications of Major Inheritance Patterns
| Feature | Autosomal Dominant | Autosomal Recessive | X-Linked |
|---|---|---|---|
| Genomic Locus | Autosomes | Autosomes | X Chromosome |
| Variant State for Disease | Heterozygous (typically) | Biallelic (Homozygous or Compound Heterozygous) | Hemizygous in Males; Heterozygous/Homozygous in Females |
| Typical Variant Discovery Focus | Affected Proband | Affected Proband (homozygous/compound het) or Parental Carrier Pairs | Affected Male or Manifesting Female |
| Key Challenge for Testing | Distinguishing de novo variants from background noise; assessing incomplete penetrance | Detecting two mutant alleles; high carrier frequency in specific populations | Assessing skewed X-inactivation in females; high de novo mutation rate for some disorders |
| Common Technologies | Exome/Genome Sequencing, Gene Panels | Exome/Genome Sequencing, Expanded Carrier Screening Panels | X-Chromosome Focused Analysis, Gene Panels |
Tailored Experimental Protocols and Workflows
The selection of laboratory methods and analytical workflows must be precisely calibrated to the suspected inheritance pattern of the disorder.
Protocol 1: Expanded Carrier Screening for Autosomal Recessive and X-Linked Conditions
This protocol is designed for population-scale screening to identify carriers of pathogenic variants, as recommended by ACMG and ACOG [37] [36].
- 1. Objective: To simultaneously interrogate multiple genes for pathogenic variants associated with severe autosomal recessive and X-linked disorders in a preconception or prenatal population.
- 2. Sample Preparation:
- Input: Genomic DNA extracted from blood, saliva, or cheek swab.
- Quality Control: Quantify DNA using fluorometry (e.g., Qubit) and assess integrity via gel electrophoresis. A minimum of 50 ng/µL DNA is typically required.
- 3. Library Preparation and Sequencing:
- Technology: Next-Generation Sequencing (NGS) is the standard. Use a targeted capture panel or a whole-exome sequencing approach.
- Method: Fragment genomic DNA, ligate platform-specific adapters, and perform hybrid capture using biotinylated probes designed to target the coding regions of a defined gene set (e.g., 113 genes for a Tier 3 panel as per ACMG) [37].
- Sequencing: Perform paired-end sequencing on an Illumina NovaSeq or comparable platform to achieve a minimum mean coverage of 30x across the target regions [37].
- 4. Bioinformatic Analysis:
- Alignment: Map sequencing reads to the reference genome (e.g., GRCh38) using tools like BWA-MEM or DRAGEN.
- Variant Calling: Call single-nucleotide variants (SNVs) and small insertions/deletions (indels) using a caller like GATK HaplotypeCaller. For X-linked analysis, adjust calling parameters for hemizygous regions in males.
- Variant Filtering and Annotation:
- Filter for variants with a population allele frequency of <1% in gnomAD.
- Annotate variants for predicted pathogenicity (e.g., using SIFT, PolyPhen-2) and classify them according to ACMG/AMP guidelines [37].
- For recessive conditions, perform a compound heterozygous analysis to identify pairs of variants in the same gene.
- 5. Reporting and Interpretation:
- Report only pathogenic and likely pathogenic variants to minimize uncertainty [37].
- For autosomal recessive conditions, calculate residual risk after a negative test using the formula:
Population Carrier Frequency × (1 – Assay Detection Rate)[37]. - Provide comprehensive genetic counseling to discuss results, residual risks, and reproductive options.
Protocol 2: Inheritance-Specific Machine Learning for Novel Gene Discovery
This advanced protocol leverages machine learning to prioritize novel candidate genes for neurodevelopmental disorders (NDDs) based on inheritance pattern, as demonstrated by state-of-the-art research [7].
- 1. Objective: To train supervised machine learning models that predict novel NDD risk genes by integrating multi-omics data, with separate models for monoallelic (dominant) and bi-allelic (recessive) inheritance patterns.
- 2. Seed Gene Curation (Training Set):
- Monoallelic Seed Genes: Compile high-confidence gene lists from authoritative sources (e.g., SFARI Tier 1 genes for autism, "definitive" genes from DDG2P for developmental delay). Manually review to confirm monoallelic inheritance evidence [7].
- Bi-allelic Seed Genes: Curate from sources like DDG2P and OMIM, explicitly filtering for genes with autosomal recessive inheritance [7].
- 3. Feature Engineering and Data Integration:
- Extract ~300 orthogonal genomic features for all human genes. Key features include:
- Gene Expression: Single-cell RNA-seq data from relevant tissues (e.g., developing human cortex) to calculate cell-type-specific expression scores [7].
- Evolutionary Constraint: Genic intolerance metrics (e.g., pLI, LOEUF) from population databases like gnomAD.
- Protein Interactions: Data from protein-protein interaction (PPI) networks.
- Functional Annotations: Gene Ontology (GO) terms, pathway membership, and chromatin states.
- Extract ~300 orthogonal genomic features for all human genes. Key features include:
- 4. Model Training and Validation:
- Framework: Utilize a semi-supervised machine learning framework such as mantis-ml [7].
- Process: Train separate random forest or gradient boosting models for monoallelic and bi-allelic seed genes.
- Validation: Assess model performance using Area Under the Receiver Operator Curve (AUC), with high-performing models achieving AUCs of 0.84–0.95 [7].
- Enrichment Analysis: Validate top-ranked candidate genes by testing for enrichment in high-confidence gene sets from large-scale sequencing studies. Top candidates from bi-allelic models showed a 6-fold enrichment compared to using intolerance metrics alone [7].
The following workflow diagram illustrates the key steps in this machine learning-based gene discovery protocol:
Quantitative Analysis of Model Performance and Gene Predictions
Robust quantitative metrics are essential for evaluating the performance of inheritance-specific genetic models and interpreting their predictions. The following tables summarize key empirical findings from a recent large-scale machine learning study on neurodevelopmental disorders (NDDs) [7].
Table 2: Performance Metrics of Inheritance-Specific Machine Learning Models for NDDs
| Model Type | Area Under Curve (AUC) | Comparison Benchmark | Enrichment over Benchmark | Key Predictive Features |
|---|---|---|---|---|
| Monoallelic (Dominant) Model | 0.84 - 0.95 | Genic Intolerance Metrics (e.g., pLI) | 2-fold enrichment for high-confidence NDD genes | Fetal cortex scRNA-seq expression, protein-protein interactions, genic intolerance |
| Bi-allelic (Recessive) Model | 0.84 - 0.95 | Genic Intolerance Metrics (e.g., pLI) | 6-fold enrichment for high-confidence NDD genes | Fetal cortex scRNA-seq expression, different genic intolerance profiles, orthogonal genomic features |
Table 3: Validation and Functional Enrichment of Top-Ranked Gene Predictions
| Validation Metric | Monoallelic Model Results | Bi-allelic Model Results | Interpretation and Significance |
|---|---|---|---|
| Literature Support (Top vs. Bottom Decile) | 45x more likely | 180x more likely | Top predictions are vastly more likely to have existing published evidence of disease association. |
| Gene Ontology (GO) Enrichment | Neuronal development, synaptic signaling | Metabolic processes, cellular respiration | Reflects fundamental biological differences between dominant and recessive NDD genes. |
| Clinical Actionability | High potential for de novo variant discovery in trios | Informs pan-ethnic carrier screening panels | Guides different downstream clinical and research applications. |
Successful implementation of the described protocols requires a suite of specialized reagents, data resources, and computational tools.
Table 4: Key Research Reagent Solutions for Inheritance-Specific Genetic Analysis
| Resource Category | Specific Item / Database | Function and Application in Research |
|---|---|---|
| Genomic Data Repositories | gnomAD (Genome Aggregation Database) | Provides allele frequencies and genic intolerance metrics (pLI/LOEUF) critical for variant filtering and feature generation in ML models [7]. |
| Gene-Disease Validity | ClinGen (Clinical Genome Resource) | Offers expert-curated evidence for gene-disease relationships, used for validating seed genes and model predictions [37]. |
| Variant Classification | ClinVar | Public archive of interpretations of genetic variants; essential for training and benchmarking variant prioritization pipelines [37]. |
| Machine Learning Framework | mantis-ml | A semi-supervised machine learning framework designed for disease gene prediction, capable of integrating hundreds of genomic features [7]. |
| Cell-Type-Specific Expression | Human Fetal Cortex scRNA-seq Data | Used to calculate cell-type-specific expression scores that serve as powerful features for predicting NDD genes [7]. |
| Phenotypic Data | OMIM (Online Mendelian Inheritance in Man) | Authoritative database of human genes and genetic phenotypes, crucial for curating seed genes and inheritance patterns [7]. |
| Gene Ontology | Gene Ontology (GO) Consortium | Provides structured biological knowledge for functional enrichment analysis of candidate gene lists [7]. |
The stratification of genetic testing strategies by inheritance pattern is a cornerstone of effective genomic medicine and research. As demonstrated, the methodologies for investigating autosomal dominant disorders differ profoundly from those for recessive or X-linked conditions, from the initial experimental design and sequencing protocols to the final analytical algorithms. The integration of machine learning models that are explicitly trained on inheritance-specific gene sets represents a powerful advancement, enabling more accurate gene discovery and a deeper understanding of disease biology [7]. For researchers and drug developers, adhering to these tailored approaches ensures the rigorous identification of pathogenic variants, facilitates the interpretation of complex genomic data, and ultimately paves the way for developing targeted interventions that are informed by the fundamental principles of genetics.
Carrier screening represents a cornerstone of modern clinical genetics, serving as a primary preventive tool for autosomal recessive and X-linked recessive disorders. Its practical application is fundamentally shaped by the underlying inheritance patterns it aims to intercept. For autosomal recessive (AR) conditions, carrier screening identifies asymptomatic individuals who possess a single pathogenic variant in a gene associated with a disorder; these carriers face no significant health consequences themselves but have a 25% chance of having an affected child if their partner is also a carrier of the same condition [39]. In contrast, for X-linked recessive (XLR) conditions, female carriers typically remain asymptomatic but have a 50% chance of passing the variant to their offspring, with sons who inherit the variant being affected and daughters becoming carriers themselves [40].
The technological evolution of carrier screening has progressed from ethnicity-based screening for single disorders to pan-ethnic expanded carrier screening (ECS) panels capable of assessing hundreds of conditions simultaneously [39]. This progression, largely driven by next-generation sequencing (NGS) technologies, allows for a more comprehensive risk assessment that transcends ancestral boundaries, thereby reducing stigmatization and improving equity in genetic care [39] [40]. The clinical implementation of these advances, however, requires careful consideration of gene-disease validity, disease severity, and the feasibility of interventions to justify screening offers [41].
Table 1: Key Characteristics of Inheritance Patterns in Carrier Screening
| Feature | Autosomal Recessive (AR) | X-Linked Recessive (XLR) |
|---|---|---|
| Carrier Status | Heterozygous individuals with one mutant allele | Females with one mutant allele on the X chromosome |
| Health Implications for Carrier | Typically asymptomatic | Typically asymptomatic (though some may show mild symptoms) |
| Reproductive Risk | 25% risk of affected child if both partners are carriers | 50% risk of affected son; 50% risk of carrier daughter |
| Example Conditions | Cystic Fibrosis, Spinal Muscular Atrophy, Tay-Sachs disease | Fragile X Syndrome, Duchenne Muscular Dystrophy, Hemophilia A |
Quantitative Landscape: Population Carrier Frequencies and At-Risk Couples
Understanding the population prevalence of carrier status is critical for structuring screening programs and allocating genetic counseling resources. Recent large-scale studies provide robust data on carrier frequencies and the detection of at-risk couples (ARCs), where both partners are carriers for the same AR condition.
The Australian Mackenzie's Mission study, a government-funded research project, offered screening for over 1,000 genetic conditions to more than 9,000 couples. This landmark initiative identified that 1.9% of screened couples were ARCs, and more than 75% of these newly identified carrier couples planned to use this information to avoid the birth of an affected child, demonstrating the significant impact on reproductive decision-making [39].
Regional studies further illuminate the genetic landscape. A pilot study in Fujian Province, China, utilizing an NGS-based ECS panel of 332 genes, found a mean of 1.16 pathogenic or likely pathogenic variants per individual among 440 participants. The overall percentage of at-risk couples in this clinical cohort was 6.36% (14 couples), involving seven different genetic conditions [40]. This higher rate, compared to the Australian study, is likely attributable to the clinical setting where participants already had concerns based on family or reproductive history.
Table 2: Quantitative Outcomes from Select Carrier Screening Studies
| Study / Program | Cohort Size | Genes/Conditions Screened | Key Quantitative Findings |
|---|---|---|---|
| Mackenzie's Mission (Australia) [39] | >9,000 couples | >1,000 conditions | 1.9% of couples identified as at-risk carriers |
| Fujian Province Study (China) [40] | 440 individuals (220 couples) | 332 genes (343 conditions) | 6.36% of couples were at-risk; 1.16 variants per individual |
| Marinakis et al. (Europe) [40] | Information not specified in excerpt | 176 genes | 47.50% of participants were carriers; 1.67% of couples were at-risk |
| Strauss et al. (New York City) [40] | Information not specified in excerpt | Information not specified in excerpt | 71.85% carrier rate; 9.46% of couples were at-risk |
Experimental and Methodological Protocols
The technical backbone of modern carrier screening relies on sophisticated molecular methodologies tailored to the type of genetic variant being detected.
Core Testing Technologies and Their Applications
Next-Generation Sequencing (NGS) serves as the primary platform for expanded carrier screening, enabling the simultaneous analysis of hundreds of genes for single nucleotide variants (SNVs) and small insertions/deletions (indels) [40]. The standard workflow involves: (1) Library Preparation, where genomic DNA is fragmented and adapter sequences are ligated; (2) Target Enrichment, using probe-based hybridization to capture the specific genes on the screening panel; (3) Sequencing on a high-throughput platform; and (4) Bioinformatic Analysis, aligning sequences to a reference genome and calling variants [40].
A significant technical challenge in NGS-based screening is the accurate detection of copy number variations (CNVs) and variants in regions of high homology (e.g., SMN1, CYP21A2). Advanced bioinformatics pipelines are required to identify exon-level deletions or duplications from NGS data. In the Fujian study, CNVs constituted 8.41% (43 of 511) of all detected variants, underscoring their importance in a comprehensive screening panel [40].
Supplemental Methodologies for Targeted Analysis
While NGS provides broad coverage, supplemental techniques are often employed for specific genes or to confirm findings:
- Multiplex Ligation-dependent Probe Amplification (MLPA): This technique is considered the gold standard for detecting exon-level deletions and duplications in genes like
DMD(Duchenne muscular dystrophy) andSMN1(spinal muscular atrophy). It is particularly valuable for confirming CNVs suspected by NGS [40] [42]. - Amplification Refractory Mutation System (ARMS-PCR): Used for highly specific detection of known point mutations in conditions like cystic fibrosis (
CFTRgene) and β-thalassemia. It is cost-effective and has a quick turnaround time but is not suitable for unknown variants [42]. - Sanger Sequencing: Remains the gold standard for validating variants identified by NGS and for targeted sequencing when a specific familial mutation is known [42].
- Enzyme Activity Assays: For conditions like Tay-Sachs disease, biochemical testing of enzyme activity (e.g., hexosaminidase A levels) is a crucial component of carrier screening, especially in pregnant women where serum testing can yield false positives [43].
Visualization of Clinical and Laboratory Workflows
The following diagrams map the critical pathways in carrier screening, from clinical decision-making to laboratory analysis.
Clinical Pathway for Carrier Screening
Laboratory Process for Expanded Carrier Screening
The Scientist's Toolkit: Essential Reagents and Materials
Successful implementation of a carrier screening program requires a suite of specialized reagents and analytical tools. The following table details key components of the research and clinical toolkit.
Table 3: Essential Research Reagent Solutions for Carrier Screening
| Reagent/Material | Specification/Example | Primary Function in Workflow |
|---|---|---|
| NGS Library Prep Kit | Illumina TruSeq, IDT xGen | Prepares fragmented DNA for sequencing by adding platform-specific adapters and indexes for sample multiplexing. |
| Targeted Capture Probes | Custom panel (e.g., 332-gene design [40]) | Biotinylated oligonucleotides that hybridize to genomic regions of interest, enabling enrichment of target genes prior to sequencing. |
| CLIA-certified Control DNA | Coriell Institute samples with known genotypes | Positive and negative controls for validating assay performance, sensitivity, and specificity across each batch run. |
| Variant Annotation Databases | ClinVar, gnomAD, dbSNP | Provide population frequency data and clinical interpretations for classifying variants as pathogenic, benign, or of uncertain significance. |
| CNV Detection Software | Biodiscovery Nexus CN, Golden Helix | Specialized bioinformatic tools that analyze NGS read depth to identify exon-level deletions and duplications not detectable by SNV callers. |
| Sanger Sequencing Reagents | BigDye Terminator v3.1 | Fluorescent dye-terminator chemistry for confirmatory sequencing of variants identified through NGS panels. |
| MLPA Probe Mixes | MRC Holland SALSA MLPA kits | Probe sets for genes prone to CNVs (e.g., SMN1, DMD); used for independent confirmation of copy number changes. |
The field of carrier screening is rapidly evolving, with several emerging trends poised to reshape its clinical application. There is a growing emphasis on developing region-specific, curated disease panels that reflect the local genetic architecture and prevalence of conditions, as demonstrated by the regional variant patterns identified in Southeast China [40]. Furthermore, the concept of a "treatable fetal findings list" is being explored, which would extend prenatal genomic analysis to include conditions for which fetal or early neonatal interventions exist, thereby transforming a diagnostic tool into a mechanism for facilitating early treatment [44].
Technological advancements continue to push the boundaries of screening. The integration of long-read sequencing technologies promises to improve the detection of variants in complex genomic regions, potentially reducing the need for supplemental testing methods like MLPA [40]. In the therapeutic realm, CRISPR/Cas-based strategies are being investigated for autosomal dominant disorders, offering a glimpse into a future where the identification of genetic risk could be coupled with innovative corrective interventions [45].
In conclusion, carrier screening represents a dynamic and critical application of human genetics. Its power lies in its ability to provide individuals and couples with the knowledge necessary to make informed reproductive choices, thereby reducing the burden of severe genetic disorders. As professional guidelines continue to standardize and the evidence base from real-world implementations grows, the integration of comprehensive, equitable, and ethically sound carrier screening into public health initiatives will be paramount for improving outcomes for future generations.
In target-based drug development, determining the correct Direction of Effect (DOE)—whether to increase or decrease the activity of a drug target—is fundamental to therapeutic success [3]. Despite its importance, incorrect DOE determination remains a significant contributor to the high failure rates in clinical drug development, which approaches 90% [3]. The integration of human genetic evidence has emerged as a powerful validator, associated with a 2.6-fold increase in drug development success rates [3]. This technical guide explores the framework for predicting DOE at both gene and gene-disease levels, contextualized within the patterns of autosomal dominant and recessive inheritance that inform target selection and validation strategies.
The relationship between inheritance patterns and therapeutic modulation strategies provides critical biological context. Autosomal dominant disorders result from a single pathogenic variant in one allele of a gene pair and manifest in the heterozygous state [2] [10]. This haploinsufficiency mechanism frequently suggests that therapeutic activation may be required to restore normal function. In contrast, autosomal recessive disorders require pathogenic variants in both alleles and typically involve loss-of-function mechanisms [15], which might suggest different therapeutic approaches. Understanding these inheritance mechanisms provides the foundational logic for DOE prediction in drug development.
Genetic Foundations: Inheritance Patterns and Therapeutic Implications
Autosomal Dominant Disorders and Gain-of-Function Mechanisms
Autosomal dominant conditions present when only one copy of a gene carries a pathogenic variant, while the other copy is usually unaltered [10]. An affected individual has a 50% chance of passing the variant allele, and therefore the condition, to each offspring [2] [10]. Key characteristics include: affectation of males and females equally, presence in multiple generations, and transmission by both males and females to their sons and daughters [10].
From a therapeutic perspective, autosomal dominant disorders often involve: (1) haploinsufficiency where one normal allele provides insufficient protein production; or (2) gain-of-function (GOF) mutations that confer new or enhanced activity on the protein [3]. Genes causing disease via GOF mechanisms show significant enrichment for inhibitor targets [3], suggesting that therapeutic inhibition may be the correct DOE for these conditions. Examples include Marfan syndrome (FBN1 gene) and Tuberous sclerosis complex (TSC1 or TSC2 genes) [2].
Autosomal Recessive Disorders and Loss-of-Function Mechanisms
Autosomal recessive (AR) diseases require two recessive disease alleles for phenotypic presentation and affect approximately 1.7-5 in 1000 neonates [29]. These disorders typically display horizontal inheritance patterns within families, often appearing in multiple siblings but not in prior generations [15]. Consanguinity significantly increases recurrence risk in affected families [15].
Therapeutic implications for AR disorders primarily involve loss-of-function (LOF) mechanisms where both gene copies are compromised [15]. From a DOE perspective, this may suggest several therapeutic strategies: (1) protein replacement therapies; (2) enzyme enhancement approaches; or (3) bypassing metabolic blocks in the case of enzymatic deficiencies. Clinical examples include cystic fibrosis (CFTR gene), Tay-Sachs disease (HEXA gene), and sickle cell disease (HBB gene) [15] [29].
Table 1: Inheritance Patterns and Therapeutic Implications
| Inheritance Pattern | Molecular Mechanism | Example Conditions | Suggested DOE |
|---|---|---|---|
| Autosomal Dominant | Gain-of-Function | Tuberous sclerosis, Neurofibromatosis type 1 | Inhibition |
| Autosomal Dominant | Haploinsufficiency | Marfan syndrome, Autosomal dominant polycystic kidney disease | Activation |
| Autosomal Recessive | Loss-of-Function | Cystic fibrosis, Tay-Sachs disease | Protein replacement/activation |
| Autosomal Recessive | Enzyme deficiency | Biotinidase deficiency, Hereditary fructose intolerance | Enzyme enhancement |
DOE Prediction Framework: A Multi-Level Modeling Approach
Gene-Level DOE Prediction Models
The DOE prediction framework operates at three distinct levels with increasing specificity [3]. The first level predicts DOE-specific druggability across 19,450 protein-coding genes using gene and protein embeddings alongside traditional genetic features [3]. This model achieves a macro-averaged Area Under the Receiver Operating Characteristic Curve (AUROC) of 0.95, substantially outperforming existing approaches like DrugnomeAI [3].
The second level predicts isolated DOE among 2,553 known druggable genes, answering whether therapeutic modulation of a target is useful across all disease contexts [3]. This model achieves a macro-averaged AUROC of 0.85 and reveals that activator and inhibitor targets have distinct genetic and functional characteristics [3]. For example, inhibitor targets demonstrate significantly lower LOEUF scores (prank-sum = 8.5 × 10⁻⁸), indicating stronger selective constraint against inactivation [3].
Gene-Disease-Specific DOE Prediction
The third model level predicts gene-disease-specific DOE for 47,822 gene-disease pairs using human genetics features across the allele frequency spectrum [3]. This approach utilizes an allelic series concept where different variants within the same gene exert graded effects on disease risk, modeling a dose-response relationship that directly informs DOE [3]. While overall performance is more modest (macro-averaged AUROC of 0.59), performance significantly improves with the availability of genetic evidence [3].
Table 2: DOE Prediction Model Performance Characteristics
| Prediction Level | Targets | Key Features | Performance (AUROC) |
|---|---|---|---|
| DOE-Specific Druggability | 19,450 protein-coding genes | Gene embeddings, protein embeddings, constraint metrics | 0.95 (macro-averaged) |
| Isolated DOE | 2,553 druggable genes | LOEUF, dosage sensitivity, protein localization | 0.85 (macro-averaged) |
| Gene-Disease-Specific DOE | 47,822 gene-disease pairs | Genetic associations across allele frequency spectrum | 0.59 (macro-averaged) |
Experimental Design and Methodologies
Data Acquisition and Curation
The foundational dataset for DOE prediction includes 7,341 unique drugs with specified mechanisms of action from five sources [3]. The distribution includes 46% in phase IV (approved), 29% in phases I-III clinical trials, and 25% under unspecified investigation phases [3]. Small molecules constitute 78.7% of these drugs, while antibodies represent 8.1% [3]. Among the 2,553 protein-coding genes targeted by these drugs, 75.9% are targeted by inhibitors, 23.2% by activators, and 15.8% by both activator and inhibitor drugs [3].
Genetic features incorporated include: (1) LOEUF scores quantifying gene intolerance to loss-of-function variants; (2) dosage sensitivity predictions; (3) mode of inheritance associations; and (4) protein localization and class [3]. The model also integrates continuous representations of gene function through GenePT embeddings of NCBI gene summaries and ProtT5 embeddings of amino acid sequences [3].
Analytical Framework and Validation
The analytical workflow employs machine learning models that integrate tabular genetic features with gene and protein embeddings [3]. Model validation demonstrates strong calibration, with predicted probabilities matching the proportion of druggable genes across different protein classes and among genes with high PHAROS novelty scores [3].
For the DOE-specific druggability model, optimal cutoff thresholds for maximizing F1 scores were lower for activator and other mechanism predictions (0.18 and 0.17 respectively) compared to inhibitor predictions (0.30), reflecting class imbalances in the training data [3]. The predictions demonstrate internal consistency, with >97% of genes predicted as druggable by a DOE-specific score also predicted as druggable by the overall score [3].
Key Findings and Research Applications
Distinct Characteristics of Activator vs. Inhibitor Targets
The research reveals fundamental genetic differences between activator and inhibitor targets. Inhibitor targets show significantly greater constraint against loss-of-function variation (lower LOEUF scores, prank-sum = 8.5 × 10⁻⁸) and higher predicted dosage sensitivity compared to activator targets [3]. This appears counterintuitive since inhibitor drugs mimic LOF, but can be explained by confounding factors: constrained inhibitor targets are enriched for DepMap common essential genes (OR = 4.3) and may treat GOF or overexpression-related phenotypes [3].
Genes involved in autosomal dominant disorders are enriched for both activator and inhibitor mechanisms, whereas genes involved in autosomal recessive disorders are specifically depleted of inhibitor mechanisms [3]. Additionally, genes causing disease via GOF mechanisms show greater enrichment for inhibitors compared to activator mechanisms [3]. Protein localization also predicts DOE, with G protein-coupled receptors significantly enriched for activators [3].
Population-Specific Considerations in DOE Prediction
Population genetic factors significantly influence DOE prediction and application. Research demonstrates striking differences in population-specific disease prevalence, with 101 AR diseases (27%) limited to specific populations and 305 diseases (68%) differing more than tenfold across major ethnogeographic groups [29]. Founder effects further complicate DOE strategies, as evidenced by cystic fibrosis where p.Phe508del predominates in Europeans (248 carriers per 10,000) while p.Trp1282Ter is most prevalent in Ashkenazim (46% of cases) [29].
These population-specific patterns extend to therapeutic targets. For Wilson disease (ATP7B gene), the primary risk variant differs substantially: p.His1069Gln in Ashkenazim and Europeans versus p.Arg778Leu in East Asians [29]. Such population-specific genetic architectures necessitate tailored DOE prediction models that account for ethnogeographic factors in therapeutic development.
The Scientist's Toolkit: Essential Research Reagents
Table 3: Key Research Reagents for DOE Prediction Studies
| Reagent/Resource | Type | Primary Function | Example Applications |
|---|---|---|---|
| GenePT Embeddings | Computational | 256-dimensional gene representations from NCBI summaries | Gene-level druggability prediction |
| ProtT5 Embeddings | Computational | 128-dimensional protein representations from amino acid sequences | Protein function characterization |
| LOEUF Scores | Dataset | Quantifies gene constraint against loss-of-function variants | Identifying essential genes |
| ClinVar Annotations | Database | Curated pathogenicity assessments for genetic variants | Validating disease associations |
| GPS Framework | Analytical Tool | Genetic priority score incorporating effect directions | Predicting drug indications and DOE |
| DrugnomeAI | Benchmark Model | Predicts gene-level druggability without DOE differentiation | Performance comparison |
The framework for Direction of Effect prediction represents a transformative approach to target selection and validation in drug development. By integrating genetic evidence across the allele frequency spectrum with advanced gene and protein embeddings, this methodology enables probabilistic determination of whether therapeutic success requires activation or inhibition of a target [3]. The strong association between these predictions and clinical trial success underscores their utility in de-risking drug development [3].
Contextualizing DOE within autosomal dominant and recessive inheritance patterns provides the biological rationale for differential therapeutic strategies. As the field advances, incorporating population-specific genetic architectures and ethnogeographic factors will further refine DOE predictions, enabling more targeted and effective therapeutic interventions across diverse global populations [29]. The continued integration of human genetic evidence with functional genomic data promises to expand the druggable genome in a DOE-specific manner, potentially addressing the current imbalance between activator and inhibitor targets in the therapeutic landscape [3].
In the realm of genetic disease drug development, understanding and accounting for inheritance patterns is not merely a biological consideration but a fundamental pillar influencing trial success. Autosomal dominant and recessive inheritance patterns dictate profoundly different patient recruitment strategies, endpoint selection, and statistical planning. These patterns directly impact disease prevalence, phenotypic heterogeneity, and natural history—all critical factors for clinical trial design [46]. The advancement of precision medicine has cemented genetic stratification, the process of dividing patients into subgroups based on their specific mutations and inheritance patterns, as a foundational starting point in the drug development lifecycle for rare genetic diseases [46].
Incorporating a clear genetic stratification plan is essential for developing effective Target Product Profiles (TPPs), which serve as strategic blueprints defining developmental "success" by aligning clinical, regulatory, and commercial strategies with patient needs [46]. The differential pathophysiology between autosomal dominant and recessive diseases often necessitates different therapeutic approaches, including small molecules, gene therapies, and RNA-targeting treatments, which in turn require tailored clinical development pathways [47] [48]. This guide provides an in-depth technical examination of how inheritance patterns inform patient stratification and trial design, framed within the context of autosomal dominant versus recessive inheritance pattern research.
Fundamental Concepts: Dominant and Recessive Inheritance
Molecular and Clinical Characteristics
Autosomal dominant and recessive disorders are distinguished by fundamentally different molecular mechanisms and clinical presentations, which directly influence clinical trial design. Autosomal dominant disorders occur when a single mutated allele is sufficient to cause disease, often through gain-of-function mechanisms or haploinsufficiency. These conditions are typically characterized by vertical transmission through generations, affect both males and females equally, and have a 50% recurrence risk for offspring of affected individuals. In contrast, autosomal recessive disorders require biallelic mutations (homozygous or compound heterozygous) for clinical manifestation. These often display horizontal inheritance patterns with multiple affected siblings within a single generation, consanguinity in families, and a 25% recurrence risk for offspring of carrier parents [49] [46].
The molecular consequences differ significantly between these inheritance patterns. Dominant disorders frequently involve mutations in structural proteins, regulatory elements, or result in toxic protein products, whereas recessive disorders often involve enzymatic deficiencies or loss-of-function mutations in metabolic pathways. These differences extend to phenotypic variability; dominant disorders often show variable expressivity and age-dependent penetrance, while recessive conditions typically demonstrate more consistent genotype-phenotype correlations, though modifier genes and environmental factors can influence both [49] [50].
Implications for Patient Identification and Prevalence
The inheritance pattern dramatically affects disease prevalence and population distribution. Autosomal dominant conditions generally have higher prevalence rates within specific families but lower population frequencies, as selective pressure limits propagation. Autosomal recessive disorders often have lower clinical prevalence but higher carrier frequencies within populations, particularly in genetic isolates or with founder mutations. This has direct implications for patient identification and recruitment strategies in clinical trials [46].
Table 1: Comparative Analysis of Inheritance Patterns and Their Trial Implications
| Characteristic | Autosomal Dominant | Autosomal Recessive |
|---|---|---|
| Genetic Requirement | Single mutated allele | Biallelic mutations |
| Typical Molecular Mechanism | Gain-of-function, dominant-negative, haploinsufficiency | Loss-of-function |
| Family History Pattern | Vertical transmission across generations | Horizontal pattern (affected siblings) |
| Carrier Frequency | Low (affected individuals are heterozygous) | Often high (unaffected carriers) |
| Patient Identification | Multi-generational family studies | Population screening, newborn screening |
| Phenotypic Variability | Often high (variable expressivity, reduced penetrance) | Typically more uniform |
| Example Conditions | Huntington disease, Marfan syndrome, autosomal dominant Alport syndrome | Cystic fibrosis, sickle cell anemia, autosomal recessive Alport syndrome |
Inheritance-Aware Patient Stratification Strategies
Genetic Database Interrogation and Population Analysis
Robust patient stratification begins with comprehensive genetic database analysis to quantify and qualify target populations. Large-scale genetic databases and biobanks such as gnomAD, UK Biobank, Genomics England's 100K Genomes, and All of Us provide invaluable resources for estimating variant carrier frequencies, ancestral risk distributions, and genotype-phenotype correlations [46]. The analytical workflow involves: (1) identifying pathogenic variants associated with the disease of interest; (2) mining genetic databases to determine variant frequencies across ancestry groups; (3) applying inheritance-specific considerations (penetrance for dominant disorders, carrier status for recessive); and (4) estimating real-world patient numbers by applying genetic risk to demographic data [46].
This methodology was exemplified in a Fabry disease analysis (X-linked, but demonstrating the principle), which revealed the condition may be over three times more common than previous clinically ascertained estimates. The study screened for pathogenic variants in the GLA gene within gnomAD, stratified by sex and ethnicity, providing precise population estimates essential for trial planning [46]. For autosomal recessive conditions, special attention must be paid to compound heterozygosity, where two different pathogenic variants affect the same gene, which can complicate genotype-phenotype predictions and eligibility criteria [49].
Mode-of-Inheritance Informed Variant Interpretation
Accurate variant interpretation must account for mode of inheritance, as pathogenic mechanisms differ between dominant and recessive disorders. Computational tools like MOI-Pred and ConMOI have been developed specifically to predict mode of inheritance at the variant level, integrating evolutionary and functional annotations to produce predictions sensitive to both dominant-acting and recessive-acting pathogenic variants [49]. These tools address a critical gap in variant effect predictors, which have traditionally been insensitive to recessive-acting diseases.
The consensus method ConMOI demonstrates how integration of multiple prediction methods enhances performance, with dominant and recessive predictions from both tools showing specific enrichment in individuals with pathogenic variants for dominant- and recessive-acting diseases, respectively, in real-world electronic health record-based validation across 29,981 individuals [49]. This approach provides variant-level MOI predictions for 71 million missense variants, representing a powerful resource for patient stratification [49].
Table 2: Inheritance-Specific Biomarker Considerations
| Biomarker Category | Autosomal Dominant Applications | Autosomal Recessive Applications |
|---|---|---|
| Genetic Biomarkers | Variant penetrance estimates, anticipation studies | Carrier frequency, compound heterozygosity |
| Biochemical Biomarkers | Products of dysregulated pathways, toxic metabolites | Substrate accumulation, product deficiency |
| Prognostic Biomarkers | Age-of-onset predictors, severity modifiers | Residual enzyme activity, kinetic measures |
| Pharmacodynamic Biomarkers | Target engagement, pathway modulation | Enzyme replacement efficacy, substrate reduction |
Clinical Trial Design Adaptations
Endpoint Selection and Natural History Utilization
Endpoint selection must be tailored to inheritance-specific disease trajectories. Autosomal dominant disorders often exhibit age-dependent penetrance and progressive deterioration, favoring time-to-event endpoints or quantitative functional measures. Autosomal recessive disorders frequently present with early-onset, stable deficits, making change-from-baseline or responder analyses more appropriate [50]. The Alport syndrome natural history study (ATHENA) exemplifies inheritance-aware endpoint development, demonstrating how different inheritance patterns (X-linked, autosomal recessive, autosomal dominant) within the same disease exhibit markedly different yearly eGFR slopes: -6.7 mL/min/1.73m² in X-linked males, 0.6 in X-linked females, and -1.66 in heterozygous autosomal patients [50].
Innovative endpoint methodologies like Desirability of Outcome Ranking (DOOR) offer particular utility in genetically stratified trials, as they can incorporate multiple clinical outcomes into a single metric, potentially enhancing statistical power in small population trials [51]. Furthermore, the ATHENA study identified urine albumin-to-creatinine ratio (UACR) as the strongest predictor for rapid eGFR decline, with patients having UACR >1 g/g exhibiting a yearly eGFR slope of -10.16 mL/min/1.73m² compared to -0.90 mL/min/1.73m² for those with UACR ≤1.0 g/g [50]. Such inheritance- and biomarker-informed enrichment strategies are critical for identifying rapid progressors most likely to demonstrate treatment effects within feasible trial durations.
Model-Informed Drug Development (MIDD) Approaches
Model-Informed Drug Development has emerged as a powerful paradigm addressing challenges inherent in rare disease drug development, including small patient populations and ethical constraints on clinical trial design [52]. MIDD leverages quantitative methods to enhance decision-making across all drug development stages, becoming particularly valuable for inheritance-stratified approaches. Key MIDD methodologies include population pharmacokinetic/pharmacodynamic (PK/PD) modeling, physiologically based pharmacokinetic (PBPK) modeling, disease progression modeling, Bayesian trial designs, and real-world data integration [52].
The development of risdiplam for spinal muscular atrophy (SMA, autosomal recessive) exemplifies successful MIDD application. PBPK modeling was used to predict drug-drug interaction (DDI) potential in pediatric patients when clinical DDI studies were not feasible, while a mechanistic population PK model integrated with PBPK derived in vivo flavin-containing monooxygenase 3 (FMO3) ontogeny to investigate its impact on DDI in children [52]. For nusinersen (another SMA therapy), population PK models were developed using data from infants and children with SMA across five trials, informing dosing regimens for this recessive disorder [52]. These examples demonstrate how MIDD approaches can extrapolate knowledge from adults to children, across inheritance patterns, and optimize dosing for specific genetic populations.
Case Studies in Inheritance-Aware Drug Development
Alport Syndrome: Inheritance-Driven Heterogeneity
The ATHENA natural history study provides a compelling case of inheritance-driven clinical trial considerations across X-linked, autosomal recessive, and autosomal dominant Alport syndrome [50]. This prospective, global, multicenter observational study followed 165 patients with confirmed AS for up to 120 weeks, collecting comprehensive clinical, biomarker, and genetic data under ICH-GCP standards. The study revealed dramatically different disease progression rates based on inheritance pattern and sex: yearly eGFR slope was -6.7 mL/min/1.73m² in X-linked males, 0.6 in X-linked females, and -1.66 in heterozygous autosomal patients [50].
These findings have direct implications for clinical trial design: (1) enrichment strategies should prioritize X-linked males and autosomal recessive patients for trials targeting rapid progression; (2) different endpoint expectations and trial durations are needed across inheritance patterns; (3) UACR serves as a powerful stratification biomarker across all inheritance types. The study also demonstrated that AEs related to the underlying AS medical condition were rare (only 26 out of 353 AEs, 7.4%), informing safety monitoring expectations in future interventional trials [50].
Spinal Muscular Atrophy: Recessive Disorder Development Pathway
Spinal muscular atrophy (SMA), an autosomal recessive neurodegenerative disorder caused by mutations in the SMN1 gene, demonstrates a successful drug development pathway for recessive conditions. Risdiplam development employed sophisticated MIDD approaches, including PBPK modeling to predict DDI potential in pediatric populations when clinical studies were not feasible [52]. The modeling strategy bridged from healthy adults to children with SMA, demonstrating comparable DDI effects of risdiplam on midazolam across age groups (2 months-18 years) [52].
Furthermore, a mechanistic population PK model integrated with PBPK derived in vivo FMO3 ontogeny from risdiplam data collected in patients aged 2 months to 61 years, improving prediction of risdiplam PK in children [52]. This case illustrates how understanding recessive disorder pathophysiology (complete loss of SMN1 function) enabled development of therapies targeting SMN2 modification, with trial designs adapted to the specific genetic context and natural history of this recessive condition.
The Scientist's Toolkit: Essential Research Reagents and Platforms
Table 3: Key Research Reagent Solutions for Inheritance Pattern Research
| Tool Category | Specific Technologies/Platforms | Research Application |
|---|---|---|
| Genetic Databases | gnomAD, UK Biobank, 100K Genomes, All of Us | Variant frequency analysis, ancestry-specific risk, population estimation |
| Variant Effect Predictors | MOI-Pred, ConMOI, REVEL, CADD | Pathogenicity prediction, mode-of-inheritance classification |
| Modeling & Simulation Platforms | NONMEM, Monolix, GastroPlus, Simcyp Simulator | PBPK modeling, population PK/PD, trial simulation |
| Biomarker Assays | ELISA, MSD, LC-MS, digital PCR | Biomarker quantification, pharmacodynamic monitoring |
| Genetic Sequencing | WES, WGS, targeted NGS panels (e.g., MSK-IMPACT) | Variant discovery, companion diagnostics |
Visualizing Inheritance-Aware Clinical Development Workflows
Genetic Stratification in Clinical Development
Molecular Consequences by Inheritance Pattern
Integrating inheritance pattern considerations throughout the clinical development lifecycle is no longer optional but essential for successful genetic disease drug development. From target identification through registration trials, autosomal dominant and recessive disorders demand distinct approaches to patient stratification, endpoint selection, and trial design. The emergence of sophisticated genetic databases, mode-of-inheritance prediction tools, and model-informed drug development approaches provides an unprecedented toolkit for designing inheritance-aware development programs.
Future directions will likely see increased use of genetically stratified clinical trials, leveraging population-scale next-generation sequencing with paired electronic health records to identify novel drug targets and optimize patient selection [48]. Furthermore, the growing acceptance of MIDD in pediatric rare disease contexts demonstrates how quantitative approaches can address inheritance-specific development challenges, facilitating dose optimization, supporting extrapolation, and enabling more efficient and ethical clinical trial strategies [52]. As these methodologies mature, they promise to accelerate the delivery of safe, effective treatments for all genetic disorders, regardless of inheritance pattern.
Spinocerebellar ataxia (SCA) represents a group of genetically heterogeneous neurological disorders characterized by progressive impairment of balance and coordination caused by cerebellar dysfunction. The hereditary forms of SCA predominantly follow an autosomal dominant inheritance pattern, meaning a single mutated allele from one parent is sufficient to cause the disease. This contrasts sharply with autosomal recessive disorders that require two mutated alleles for disease manifestation and typically show horizontal transmission patterns with skipped generations [15]. SCAs are classified as polyglutamine (PolyQ) repeat expansion diseases when caused by CAG triplet repeats in specific genes, with SCA3 (Machado-Joseph disease) being the most common autosomal dominant form in many populations [53].
The pathological mechanisms in autosomal dominant SCAs involve neurodegeneration of Purkinje cells in the cerebellum, neuronal loss in brainstem and spinal regions, and disruption of cerebellar output pathways. In SCA3, the mutation occurs in the ATXN3 gene, featuring an unstable CAG triplet repeat expansion that results in an excessively long polyglutamine tract in the ataxin-3 protein. This abnormal protein conformation leads to aggregation, oxidative stress, and eventual apoptotic death of neurons [54]. The autosomal dominant nature of SCA3 exhibits the phenomenon of "anticipation," where successive generations experience earlier disease onset and more severe symptoms due to repeat expansion during meiosis [53].
Currently, no curative treatments exist for SCAs, with management primarily focusing on symptomatic relief rather than addressing the underlying disease mechanisms. This therapeutic gap has motivated the development of novel approaches, including stem cell-based therapies that target the fundamental neurodegenerative processes [53].
Stemchymal Therapeutic Platform: Composition and Mechanism of Action
Stemchymal is an allogeneic adipose-derived mesenchymal stem cell therapy developed by Steminent Biotherapeutics Inc. The product is manufactured from mesenchymal stem cells extracted from adipose tissue collected from healthy donors, followed by culture expansion and formulation as a regenerative medicine product [55]. The cell suspension is diluted with saline and administered via intravenous infusion, making it a less invasive treatment approach compared to direct CNS delivery methods [55].
The manufacturing process involves harvesting approximately 100g of adipose tissue via liposuction from healthy, rigorously screened donors. The mononuclear fraction is isolated after enzymatic digestion and cultivated in low-serum medium (2% FBS). The attached cells are expanded through multiple passages, with Stemchymal typically used at the 12th passage. The final product is cryopreserved at a concentration of 7 × 10^7 viable cells in 20ml of cryopreservation solution [54].
Release criteria for the final product include:
- Cell viability exceeding 90%
- Specific surface marker expression (CD34-/CD45-/CD11b-/CD19-/HLA-DR- ≥98% and CD73+, CD90+, and CD105+ ≥95%)
- Meeting sterility criteria for bacteria, fungi, and mycoplasma
- Endotoxin concentration below acceptable limits [54]
Dual Mechanism of Action: Paracrine Signaling and Protein Clearance
Stemchymal exerts its therapeutic effects through multiple complementary mechanisms that address both the symptoms and underlying pathology of SCA:
Stemchymal Therapeutic Mechanism
The primary mechanisms include:
Paracrine-mediated neuroprotection: MSCs release a broad repertoire of trophic factors including brain-derived neurotrophic factor (BDNF), glial cell-derived neurotrophic factor (GDNF), insulin-like growth factor 1 (IGF-1), and vascular endothelial growth factor (VEGF) that promote neuronal survival and synaptic connectivity [54] [53].
Enhanced autophagy and protein clearance: A distinctive action of Stemchymal is its ability to clear pathogenic mutant Ataxin-3 proteins through induction of cellular autophagy, thereby reducing neurotoxic protein aggregates in the brain [56].
Immunomodulatory effects: MSCs suppress immune responses and modulate adjacent immune cells through secretion of regulatory cytokines, reducing inflammation-mediated neurodegeneration [53].
Potential tissue repair: While primarily acting through paracrine mechanisms, MSCs maintain differentiation potential and may contribute to repair of damaged neural tissues [55].
This multi-mechanistic approach represents a significant advantage over single-target therapies, particularly for complex neurodegenerative disorders like SCA that involve multiple pathological processes.
Clinical Development Program: Protocol Design and Outcomes
Phase I/IIa Clinical Study (Initial Human Trial)
The initial clinical development of Stemchymal began with a pilot, open-label, phase I/IIa clinical trial (NCT01649687) conducted in Taiwan to evaluate safety, tolerability, and preliminary efficacy [54].
Experimental Protocol:
- Study Design: Open-label, single-arm trial
- Participants: 7 subjects (6 with SCA3, 1 with MSA-C) aged 21-66 years with SARA scores between 10-20
- Intervention: Single intravenous administration of allogeneic AD-MSCs at dose of 1 × 10^6 cells/kg body weight
- Monitoring Period: 12 months with comprehensive safety and efficacy assessments
- Primary Outcomes: Safety parameters (vital signs, laboratory tests, adverse events)
- Secondary Efficacy Endpoints: SARA scores, sensory organization testing, brain magnetic resonance spectroscopy, and brain glucose metabolism using FDG-PET [54]
Key Findings:
- Safety: No adverse events related to MSC injection during the 1-year follow-up
- Tolerability: All patients completed the study and expressed desire to continue treatment
- Efficacy Signals: Stabilization or improvement in ataxia symptoms supported advancement to randomized controlled trials [54]
Phase II Clinical Trials (Randomized Controlled Studies)
The clinical development program advanced to randomized, double-blind, placebo-controlled Phase II trials in both Taiwan and Japan to rigorously evaluate efficacy and safety.
Experimental Protocol – Taiwan Phase II Trial:
- Study Design: Randomized, double-blind, placebo-controlled
- Participants: 56 patients with moderate to severe SCA3 with SARA scores ≥9
- Intervention: Three intravenous administrations of Stemchymal or placebo
- Primary Endpoint: Change in SARA score from baseline to week 52 [57] [56]
Experimental Protocol – Japan Phase II Trial (RS-01):
- Study Design: Placebo-controlled, multicenter, randomized, double-blinded, parallel-group
- Participants: 59 patients with SCA3 and SCA6 across 10 sites
- Intervention: Multiple intravenous administrations of Stemchymal or placebo
- Primary Endpoint: Change in SARA score from baseline to week 52 [58]
Table 1: Key Efficacy Outcomes from Phase II Clinical Trials
| Trial Parameter | Taiwan Trial (SCA3) | Japan Trial (SCA3/SCA6) | Natural History Data |
|---|---|---|---|
| Patient Population | 56 moderate-severe SCA3 | 59 SCA3 & SCA6 patients | Untreated SCA3 patients |
| Baseline SARA | ≥9 points | Subgroups analyzed: ≥11 points | N/A |
| Disease Progression (Placebo) | Similar to natural history | Worsening in high baseline subgroup | 1.5-1.6 points/year [57] |
| Treatment Effect | Slowed SARA progression | Statistically significant improvement (p=0.042) in ≥11 subgroup | N/A |
| Notable Findings | Some patients showed ≥1 point improvement | Consistent effect across ethnic groups | 1.41 points/year (US/Europe) [57] |
Safety Profile Across Clinical Trials
The safety database across all clinical trials demonstrates a consistent profile:
Japan Phase II Safety Results:
- 31 patients in Stemchymal group, 28 in placebo group
- Incidence of related adverse events: 77.4% (24/31) in treatment group vs. 35.7% (10/28) in placebo group
- All adverse events resolved without sequelae
- No serious adverse events related to study product [58]
Long-term Safety:
- No safety issues identified during extended follow-up periods
- Consistent safety profile across different ethnic populations (Taiwanese and Japanese)
- Support for chronic or repeated administration based on safety profile [57] [58]
Research Toolkit: Essential Reagents and Methodologies
Table 2: Key Research Reagent Solutions for MSC-Based Therapy Development
| Reagent/Category | Specification | Functional Application |
|---|---|---|
| Cell Culture Medium | Low serum (2% FBS) with essential supplements | MSC expansion while maintaining multipotency and phenotype [54] |
| Characterization Antibodies | CD34-, CD45-, CD11b-, CD19-, HLA-DR- (<2%); CD73+, CD90+, CD105+ (>95%) | Flow cytometry verification of MSC identity and purity [54] |
| Trilineage Differentiation Kits | Osteogenic, chondrogenic, adipogenic induction media | Verification of MSC multipotency per regulatory requirements [54] |
| Cryopreservation Solution | Formulation supporting >90% post-thaw viability | Maintenance of cell viability during storage and transport [54] |
| Pathogen Testing Panels | HBV, HCV, HIV-1/2, HTLV-1/2, CMV, syphilis, mycoplasma | Donor screening and product release sterility testing [54] |
| SARA Assessment Scale | 8-item scale (0-40 points) quantifying ataxia severity | Primary efficacy endpoint in clinical trials [57] [58] |
Regulatory Strategy and Global Development Path
Steminent has implemented a comprehensive regulatory strategy to advance Stemchymal through global development:
Orphan Drug Designations:
- Japan: Designated as regenerative medicine product for rare diseases (December 2018) [55] [58]
- United States: Orphan Drug designation granted by FDA [56]
- Benefits: Development cost subsidies (up to 50% in Japan), preferential tax treatment, priority review [58]
Manufacturing and Quality Control:
- PIC/S GMP compliance for manufacturing standards
- Certification as "Accredited Foreign Manufacturer" by Japan's Ministry of Health, Labour and Welfare (November 2024) [55]
- Customized cell processing isolator platform in collaboration with Shibuya Corporation [56]
Global Licensing and Partnerships:
- Japan: Exclusive commercialization license with REPROCELL Inc. (2016) [57] [55]
- South Korea: Exclusive license with SCM Life Science (2020) [55] [56]
- Active expansion into U.S., Europe, and Southeast Asia markets [57]
The development of Stemchymal represents a promising therapeutic approach for spinocerebellar ataxia, an autosomal dominant neurodegenerative disorder with significant unmet medical needs. The completed Phase II clinical trials demonstrate:
- Consistent Efficacy Signal: Statistically significant suppression of disease progression in higher severity patients (SARA ≥11) across multiple trials [57] [58]
- Favorable Safety Profile: No serious adverse events related to treatment across all clinical trials [54] [58]
- Reproducible Outcomes: Consistent results across different ethnic populations (Taiwanese and Japanese) supporting global development [57] [56]
- Disease-Modifying Potential: Evidence of mutant protein clearance and neuroprotection beyond symptomatic relief [56]
The future development path includes pursuing conditional approvals in Taiwan and Japan in 2025, applying for FDA approval for Phase 2b trials in the U.S., and advancing toward Phase 3 clinical development. The autophagy-inducing mechanism also supports potential expansion into other polyglutamine disorders such as Huntington's disease, representing a platform technology for multiple neurodegenerative conditions [56].
This case study illustrates the successful translation of MSC-based therapy from preclinical research to advanced clinical development, offering new hope for patients with hereditary neurodegenerative disorders and demonstrating the viability of regenerative medicine approaches for conditions traditionally considered "undruggable."
Genetic counseling represents a critical bridge between complex genetic information and clinical application, fundamentally relying on the accurate interpretation of inheritance patterns. The primary models of Mendelian inheritance—autosomal dominant (AD), autosomal recessive (AR), and X-linked—form the essential framework for risk assessment and patient communication. Recent research continues to refine our understanding of these patterns, revealing greater complexity than previously recognized while simultaneously developing more sophisticated tools for clinical translation.
Current investigations confirm that genes responsible for neurodevelopmental disorders harbor different molecular mechanisms and expression patterns according to their inheritance patterns, necessitating specialized approaches in diagnostic and counseling contexts [31]. The growing recognition of genes exhibiting both dominant and recessive inheritance patterns for different variants or even the same variant further complicates the genetic counseling landscape, demanding enhanced bioinformatic approaches and nuanced clinical interpretation [12]. This technical guide examines the translation of inheritance risk assessment into clinical practice within the broader research context of autosomal dominant versus recessive inheritance patterns.
Fundamental Inheritance Patterns: Molecular Mechanisms and Clinical Implications
Comparative Analysis of Autosomal Dominant and Recessive Inheritance
Table 1: Characteristics of Major Inheritance Patterns
| Feature | Autosomal Dominant (AD) | Autosomal Recessive (AR) | X-Linked |
|---|---|---|---|
| Affected Genes | Autosomes (chromosomes 1-22) | Autosomes (chromosomes 1-22) | X chromosome |
| Disease Manifestation | Single altered copy sufficient | Two altered copies required | Varies by pattern and sex |
| Transmission Pattern | Vertical (multiple generations) | Horizontal (often skips generations) | Sex-dependent |
| Carrier Status | Not applicable (affected individuals manifest) | Heterozygotes typically unaffected | Females may be asymptomatic carriers |
| Molecular Mechanisms | Haploinsufficiency, dominant-negative, gain-of-function | Complete loss-of-function | Varies by specific condition |
| Example Conditions | Huntington's disease, Achondroplasia, Neurofibromatosis, Familial hypercholesterolemia | Cystic fibrosis, Sickle cell disease, Tay-Sachs disease, Phenylketonuria | G6PD deficiency, Fabry disease, Duchenne muscular dystrophy |
Autosomal dominant disorders manifest when a single copy of a pathogenic variant is sufficient to cause disease, following vertical transmission patterns where affected individuals are typically present in multiple generations [13]. In contrast, autosomal recessive disorders require biallelic pathogenic variants for clinical manifestation, often appearing to skip generations and demonstrating horizontal transmission patterns where multiple siblings may be affected while parents are typically asymptomatic carriers [15].
The clinical translation of these patterns fundamentally impacts risk assessment. For autosomal dominant conditions, each child of an affected individual has a 50% chance of inheriting the pathogenic variant and developing the condition. For autosomal recessive conditions, the child of two carriers has a 25% chance of being affected, a 50% chance of being an asymptomatic carrier, and a 25% chance of inheriting no pathogenic variants [59]. These probabilities form the quantitative foundation of genetic counseling risk communication.
Emerging and Complex Inheritance Models
Beyond classical Mendelian patterns, several sophisticated inheritance models have emerged that refine clinical genetic counseling:
Dual Inheritance Patterns (AD/AR): Certain genes demonstrate both autosomal dominant and recessive inheritance depending on the specific variant and its functional impact [12]. Pathogenic variants in these AD/AR genes can lead to distinct or similar phenotypes, depending on the molecular mechanism. These genes exhibit unique bioinformatic properties such as intermediate constraint scores, combination of gene ontology terms, greater average number of exons, and elevated propensity to form homomeric/heteromeric proteins [12].
Bichromosomal X Inheritance (biXX): A newly proposed model suggests that affected females may harbor two pathogenic X-linked variants in different genes on opposite X chromosomes, potentially causing disease through a previously undescribed mechanism [60]. This biXX inheritance may improve diagnostic yield for females with unexplained genetic conditions and extends biological relevance to other species with multiple X chromosomes [60].
Conditional Dominance: Research highlights conditions like DADA2 (deficiency of adenosine deaminase 2), traditionally classified as autosomal recessive, where specific heterozygous variants can manifest disease through dominant negative mechanisms with incomplete penetrance [14]. This demonstrates how molecular mechanism knowledge directly impacts clinical assessment and counseling.
Methodological Approaches: From Bench to Clinical Interpretation
Diagnostic Technologies and Workflows
The implementation of comprehensive carrier screening represents a significant application of inheritance pattern knowledge in clinical practice. The following diagnostic workflow visualizes the technical process of genetic testing and result interpretation:
Figure 1. Diagnostic Genetic Testing Workflow. This flowchart illustrates the technical process from initial patient assessment through genetic testing to result interpretation and counseling.
The American College of Medical Genetics and Genomics (ACMG) has established a tiered approach to carrier screening that guides testing strategy: Tier 1 (cystic fibrosis + spinal muscular atrophy + risk-based screening); Tier 2 (conditions with ≥1/100 carrier frequency, includes Tier 1); Tier 3 (conditions with ≥1/200 carrier frequency, includes Tier 2 and adds X-linked conditions); and Tier 4 (<1/200 carrier frequency) [61]. This structured approach enables systematic risk assessment across populations.
Research Reagent Solutions for Inheritance Pattern Studies
Table 2: Essential Research Reagents and Platforms for Genetic Analysis
| Reagent/Platform | Primary Function | Application in Inheritance Studies |
|---|---|---|
| QIAamp DNA Blood Kits (Qiagen) | Genomic DNA extraction from peripheral blood | High-quality DNA preparation for sequencing across family members to establish inheritance patterns |
| Illumina NextSeq Platform | Next-generation sequencing | High-throughput sequencing for carrier screening panels and trio-based inheritance studies |
| GATK (Genome Analysis Toolkit) | Variant calling and quality control | Standardized identification of inherited variants from sequencing data |
| ANNOVAR & SnpEff | Functional variant annotation | Prediction of variant impact and inheritance pattern correlation |
| CADD, SIFT, PhyloP | In silico pathogenicity prediction | Functional impact assessment for classification of dominant vs. recessive variants |
| GTEx & BrainSpan Datasets | Tissue-specific expression analysis | Expression pattern correlation with inheritance models (brain-specific for neurodevelopmental disorders) |
Laboratory implementation follows standardized protocols: DNA extraction from peripheral venous blood samples using specialized kits (e.g., QIAamp DNA Blood Micro Kit), followed by library preparation, amplification via polymerase chain reaction (PCR), and sequencing on platforms such as the Illumina NextSeq system [61]. Subsequent bioinformatic analysis involves sequence alignment to reference genomes (GRCh37/hg19), variant calling using tools like GATK, and annotation through databases including NCBI, Varsome, and OMIM [61] [31].
Quantitative Population Data and Inheritance Risk Modeling
Carrier Frequency Across Populations
Table 3: Carrier Frequencies of Common Autosomal Recessive and X-Linked Conditions in Vietnamese Population
| Disorder | Gene | Carrier Frequency | Carrier Rate |
|---|---|---|---|
| G6PD Deficiency | G6PD | ~1 in 20 | 5.0% |
| Alpha Thalassemia | HBA1/HBA2 | ~1 in 25 | 4.0% |
| 5-alpha Reductase Deficiency | SRD5A2 | ~1 in 27 | 3.7% |
| Beta Thalassemia | HBB | ~1 in 28 | 3.6% |
| Wilson Disease | ATP7B | ~1 in 40 | 2.5% |
| Phenylketonuria | PAH | ~1 in 40 | 2.5% |
| Citrin Deficiency | SLC25A13 | ~1 in 45 | 2.2% |
Recent large-scale epidemiological research provides crucial quantitative data for evidence-based genetic counseling. A comprehensive study of 8,464 Vietnamese pregnant women revealed that approximately 22.8% carried at least one genetic recessive condition, translating to at least 1 in 5 pregnant women being a carrier for a recessive disorder [61]. This high prevalence underscores the importance of population-specific carrier frequency data in counseling and screening program development.
The clinical significance of these frequencies becomes apparent when calculating disease incidence. For conditions like beta-thalassemia with a carrier rate of 1 in 28 (3.6%), the random mating risk would be approximately 1 in 3,136 births (0.032%), but this risk increases dramatically in consanguineous relationships or within isolated populations [15] [61].
Inheritance Pattern Prediction Using Machine Learning
Advanced computational approaches now augment traditional inheritance pattern analysis. Machine learning models integrating gene expression data with 300 orthogonal features (including intolerance metrics and protein-protein interaction data) can predict neurodevelopmental disorder-associated genes with high accuracy (AUCs: 0.84-0.95) [62]. These inheritance-specific models demonstrate that top-ranked genes were up to 2-fold (monoallelic models) and 6-fold (bi-allelic models) more enriched for high-confidence NDD risk genes compared to genic intolerance metrics alone [62].
These models leverage distinctive molecular features between inheritance patterns: autosomal recessive-inherited genes show enrichments in metabolic processes, muscle organization, and metal ion homeostasis pathways, while displaying less brain-centered expression patterns and fewer protein-protein interactions compared to dominant genes [31]. Additionally, autosomal recessive genes are generally more tolerant of variation, and functional prediction scores of recessively-inherited variants tend to be lower than those of dominantly-inherited variants [31].
Clinical Translation: From Genetic Data to Patient Counseling
Inheritance Pattern Concepts in Clinical Decision-Making
The following diagram illustrates the clinical decision-making pathway when evaluating inheritance patterns and their implications for family risk assessment:
Figure 2. Clinical Decision Pathway for Inheritance Risk Assessment. This flowchart outlines the process of integrating pedigree analysis, molecular assessment, and test selection to guide genetic counseling and management.
Critical concepts in inheritance pattern counseling include pseudodominance, where autosomal recessive conditions appear in multiple generations when an affected individual has children with a carrier [15], and the impact of consanguinity, which significantly increases the risk for autosomal recessive disorders through the inheritance of identical pathogenic variants from a common ancestor [15]. Additionally, the recognition that some disorders traditionally classified as strictly recessive, like DADA2, can demonstrate autosomal dominant inheritance in specific circumstances necessitates careful molecular characterization before counseling [14].
Professional Guidelines and Evidence-Based Practice
The National Society of Genetic Counselors (NSGC) establishes evidence-based clinical practice guidelines that incorporate inheritance pattern knowledge into standardized care pathways. Current practice guidelines address conditions including epilepsy (2022), expanded carrier screening (2023), and telehealth genetic counseling (2022), while practice resources cover topics from consanguinity to specialized conditions like hereditary breast and ovarian cancer [63]. These resources provide the framework for translating inheritance risk information into clinical practice.
The field continues to evolve with advancing technologies and methodologies. As noted in recent research, "understanding the features of genetic variants that cause disease in a recessive inheritance pattern will provide a novel approach for avoiding generation of patients" [31], highlighting the preventive potential of genetic counseling informed by sophisticated inheritance pattern analysis.
The translation of inheritance risks into clinical practice represents a dynamic interface between fundamental genetic research and applied patient care. While autosomal dominant and recessive patterns provide the foundational framework, emerging evidence of dual inheritance genes, conditional dominance, and novel mechanisms like bichromosomal X inheritance continually refine and complicate genetic counseling paradigms. The integration of population-specific carrier frequency data, machine learning prediction tools, and standardized variant interpretation protocols enables increasingly precise risk assessment and communication. As genetic technologies continue to advance, the essential role of genetic counseling in translating complex inheritance information into actionable clinical insights will continue to grow in importance for researchers, clinicians, and patients navigating inherited disease risk.
Navigating Complexity: Addressing Challenges in Inheritance Pattern Analysis and Application
In the classic Mendelian model of inheritance, a specific genotype reliably predicts a corresponding phenotype. However, the reality of genetic expression is often far more complex, particularly in the context of both autosomal dominant and recessive inheritance patterns. Incomplete penetrance represents a fundamental deviation from expected Mendelian ratios, occurring when individuals with a disease-causing genotype do not express the clinical phenotype [64]. This phenomenon presents significant challenges for genetic counseling, disease risk prediction, and therapeutic development.
The proportion of individuals who possess a particular genotype and exhibit the expected clinical symptoms defines the penetrance of that genotype [64]. When everyone with the genotype presents with clinical symptoms by a particular age, the genotype is considered fully penetrant; when this proportion falls below 100%, it exhibits reduced or incomplete penetrance [65]. This differs from variable expressivity, where the same genotype causes a wide range of clinical severity across affected individuals [64]. While penetrance is a binary concept (the phenotype is either present or not), expressivity describes how the phenotype manifests in those who are affected [66].
Understanding incomplete penetrance requires framing it within inheritance patterns. In autosomal dominant disorders, a single altered copy of a gene is sufficient to cause disease, and one would expect every carrier to be affected [2]. Similarly, for autosomal recessive disorders, one would expect all individuals with two mutated alleles to show the disorder [67]. Incomplete penetrance disrupts these expectations in both inheritance patterns, meaning that unaffected individuals can carry and pass on disease-causing variants without showing symptoms themselves [64] [65].
Clinical and Population Evidence of Incomplete Penetrance
Evidence from Population Genomics
Large-scale genomic studies have revolutionized our understanding of variant penetrance. Research analyzing the Genome Aggregation Database (gnomAD), which contains genetic data from over 800,000 individuals, demonstrates that apparently pathogenic variants are much more prevalent in the general population than previously estimated through clinical studies [68]. This suggests that incomplete penetrance is more widespread than initially recognized.
One groundbreaking study investigated clinically relevant variants from ClinVar in 807,162 individuals from gnomAD [68]. The research focused specifically on 734 predicted loss-of-function (pLoF) variants in 77 genes associated with severe, early-onset, highly penetrant haploinsufficient diseases. After a detailed case-by-case assessment, researchers could identify explanations for the presumed lack of disease manifestation in 95% of variants (701 of 734) [68]. This underscores that what might initially appear to be incomplete penetrance often results from limitations in variant annotation, calling artifacts, or the presence of modifying factors.
Table 1: Representation of ClinVar Variants in gnomAD v4 (807,162 individuals)
| ClinVar Classification | Representation in gnomAD | Most Common Variant Type | Allele Frequency Characteristics |
|---|---|---|---|
| Pathogenic/Likely Pathogenic (P/LP) | 30.0% (66,571/221,975 variants) | Protein-truncating (nonsense, frameshift, essential splice) | 97.6% have AF < 0.0001; 29.8% found in only one individual |
| Variants of Uncertain Significance (VUS) | 73.1% | Missense | Not specified |
| Benign/Likely Benign (B/LB) | 83.6% | Intronic and synonymous | Not specified |
| Conflicting Classifications | 88.8% | Not specified | Not specified |
Clinical Manifestations Across Inheritance Patterns
Incomplete penetrance affects both dominant and recessive conditions, though its implications differ. For autosomal dominant disorders, incomplete penetrance explains why apparently unaffected parents can pass pathogenic variants to affected offspring [64] [65]. In autosomal recessive disorders, incomplete penetrance might modify the expected 25% recurrence risk for carrier parents.
Table 2: Examples of Variable Expressivity and Incomplete Penetrance in Monogenic Diseases
| Gene | Disorder | Severe Phenotype | Milder/Subclinical Phenotype |
|---|---|---|---|
| FBN1 | Marfan syndrome | Severe cardiovascular and skeletal manifestations [64] | Mild features (tall stature, slender fingers) [64] |
| KCNQ4 | Deafness | Profound hearing loss [64] | Mild hearing loss [64] |
| FLG | Ichthyosis vulgaris | Severe ichthyosis [64] | Eczema [64] |
| HTT | Huntington disease | ≥40 CAG repeats: High penetrance, full disease [66] | 36-39 CAG repeats: Incomplete penetrance, not all develop symptoms [66] |
| SGCE | Myoclonus-dystonia | Severe myoclonus dystonia [64] | Focal dystonia/writer's cramp [64] |
Molecular Mechanisms Underlying Incomplete Penetrance
The mechanisms behind incomplete penetrance are diverse and often act in combination to modify phenotypic expression.
Genetic Modifiers
- Genetic background effects: Variations elsewhere in the genome can significantly impact the expression of a primary disease allele. These include common variants, variants in regulatory regions, and polygenic background [64]. For example, a 2024 gnomAD study investigated the presence of modifying variants as explanations for incomplete penetrance in a subset of P/LP variants [68].
- Epistasis: Interactions between multiple genes at different loci can mask or suppress the effect of the primary disease variant [6].
- Somatic mosaicism: When a mutation occurs after conception, only a subset of cells carries the variant, potentially resulting in milder or no phenotype [64].
- Repeat expansion disorders: In triplet repeat disorders like Huntington's disease and many hereditary ataxias, the length of nucleotide repeats often dictates penetrance. Intermediate alleles (e.g., 36-39 CAG repeats in Huntington's disease) show incomplete penetrance, whereas longer repeats (≥40) are fully penetrant [66].
Non-Getic Factors
- Environmental influences: External factors such as diet, toxin exposure, and lifestyle can interact with genetic predispositions to either trigger or protect against disease manifestation [64] [65].
- Age-related factors: Some genetic disorders show age-dependent penetrance, where individuals may not manifest symptoms until later in life, or may never develop them [2].
- Stochastic effects: Random molecular events during development and cellular function can contribute to variable phenotypic expression, even in genetically identical organisms under the same environmental conditions [64].
Diagram 1: Factors influencing incomplete penetrance and variable expressivity. Multiple genetic, epigenetic, environmental, and stochastic factors interact to determine whether and how a genotype manifests as a phenotype [64] [65].
Research Methodologies for Studying Incomplete Penetrance
Population-Based Cohort Studies
Protocol 1: Assessing Variant Penetrance Using gnomAD and ClinVar Integration
- Data Extraction: Obtain all putative loss-of-function (pLoF) variants within haploinsufficient disease genes from gnomAD [68].
- Variant Annotation: Cross-reference with ClinVar to identify variants classified as pathogenic (P) or likely pathogenic (LP) for severe, early-onset, highly penetrant disorders [68].
- Case-by-Case Assessment: Apply a structured framework to evaluate each variant:
- Technical Artifacts: Evaluate for sequencing errors, mapping issues, or false-positive variant calls [68].
- Biological Context: Assess the biological relevance of the variant site (e.g., last exon position, non-canonical splice sites) using established pLoF evasion rules [68].
- Rescue Mechanisms: Identify potential local modifying variants in cis (on the same allele) that could restore gene function [68].
- Somatic vs Germline: Distinguish true germline variants from somatic mutations in the dataset [68].
- Penetrance Calculation: For variants confirmed as true positives, calculate penetrance by determining the proportion of carriers with reported disease phenotypes, adjusting for age and ascertainment bias [68].
Family-Based Studies
Protocol 2: Segregation Analysis in Multi-Generational Pedigrees
- Pedigree Construction: Document comprehensive family history across at least three generations, noting the disease status of all relatives [69].
- Genotype Affected Members: Perform targeted sequencing of the candidate gene in all affected family members to confirm the disease-associated variant [69].
- Genotype Unaffected Members: Test apparently unaffected relatives, particularly those at high risk of carrying the variant (e.g., offspring of an affected individual) [69].
- Phenotype Characterization: Conduct detailed phenotyping of asymptomatic variant carriers using specialized clinical assessments to detect subclinical manifestations [64].
- Modifier Analysis: Perform whole-genome or whole-exome sequencing on both penetrant and non-penetrant carriers to identify genetic modifiers that may explain the differential expression [64] [65].
Diagram 2: Research workflow for studying incomplete penetrance in population cohorts. This protocol leverages large datasets like gnomAD to identify and explain cases where disease-causing variants do not result in expected phenotypes [68].
Table 3: Key Research Reagents and Databases for Investigating Incomplete Penetrance
| Resource/Reagent | Type | Primary Function in Research | Key Features |
|---|---|---|---|
| gnomAD (v4) | Population Database | Provides allele frequencies in ~800,000 individuals to assess variant prevalence and penetrance [68] | Includes 76,215 genomes and 730,947 exomes; diverse ancestry representation [68] |
| ClinVar | Clinical Database | Curates clinical interpretations of variants and their disease associations [68] | Contains over 2.4 million unique variants with clinical significance classifications [68] |
| LOEUF (Loss-of-Function Observed/Expected Upper Fraction) | Computational Metric | Estimates gene tolerance to protein-truncating variants; helps prioritize haploinsufficient genes [68] | Lower scores indicate greater constraint against LoF variation [68] |
| pLoF Assessment Framework | Analytical Protocol | Systematically evaluates predicted LoF variants to reduce false-positive classifications [68] | Applies 32 rules to identify technical artifacts and biological contexts that evade LoF [68] |
| UK Biobank | Biobank Resource | Links genetic data with deep phenotypic information to assess genotype-phenotype correlations [68] | Enables association of pathogenic variants with hundreds of phenotypes in ~500,000 individuals [68] |
Clinical Implications and Therapeutic Perspectives
Genetic Counseling and Risk Assessment
Incomplete penetrance creates significant challenges for genetic counseling. While autosomal dominant conditions typically confer a 50% risk to offspring when a parent is affected, this probability becomes nuanced when accounting for penetrance [2]. Counselors must explain that a negative family history does not preclude the existence of a heritable mutation in the family, as unaffected carriers can transmit disease-causing variants [64] [65]. Risk assessment must incorporate family-specific penetrance data when available, rather than relying solely on population averages.
Diagnostic Considerations
The presence of pathogenic variants in unaffected individuals complicates diagnostic interpretation. Variants previously classified as fully penetrant may require re-evaluation using population data [68]. The 2024 gnomAD study demonstrated that after rigorous re-assessment, 95% of presumed disease-causing pLoF variants in haploinsufficient genes had alternative explanations for their presence in unaffected individuals [68]. This highlights the importance of distinguishing true incomplete penetrance from variant misclassification.
Drug Development Opportunities
Understanding the mechanisms behind incomplete penetrance reveals promising therapeutic avenues:
- Modifier gene identification: Discovering genetic variants that suppress disease manifestation in non-penetrant individuals can identify natural protective mechanisms that could be therapeutically mimicked [64] [65].
- Environmental interventions: Research into the environmental factors that prevent disease expression in genetically predisposed individuals can inform preventive strategies and lifestyle recommendations [64].
- Therapeutic targeting: For repeat expansion disorders with incomplete penetrance, such as Huntington's disease, therapies that reduce repeat expansion size or their toxic effects could shift individuals from penetrant to non-penetrant categories [66].
Incomplete penetrance represents a critical frontier in genetics research with far-reaching implications for both basic science and clinical practice. The integration of large-scale population data with detailed clinical and molecular studies has revealed that this phenomenon is more common than traditionally appreciated. Future research must focus on elucidating the precise molecular mechanisms that modify genetic expression, developing more accurate models for predicting phenotype from genotype, and translating these insights into improved risk assessment and therapeutic strategies. As our understanding of these complex genotype-phenotype relationships deepens, we move closer to truly personalized medicine that accounts for the unique genetic and environmental context of each individual.
Genetic heterogeneity presents a formidable challenge in the diagnosis and management of inherited disorders. This phenomenon, where the same or similar phenotypes arise from different genetic mechanisms, significantly complicates genetic testing, clinical decision-making, and therapeutic development. Within the framework of autosomal dominant versus recessive inheritance patterns, genetic heterogeneity manifests through two primary mechanisms: locus heterogeneity, where variants in different genes cause the same disease; and allelic heterogeneity, where different variants within the same gene lead to diverse clinical presentations. This technical review examines the impact of genetic heterogeneity on diagnostic yield, explores experimental methodologies for its characterization, and discusses implications for biomarker-driven drug development in the era of personalized medicine.
Genetic heterogeneity describes the occurrence of the same or similar phenotypes through different genetic mechanisms in different individuals [70]. This heterogeneity presents substantial challenges for pursuing precision medicine goals, discovering novel disease biomarkers, and identifying targets for treatments. The complex relationship between genetic heterogeneity and inheritance patterns is crucial for understanding disease manifestation across autosomal dominant, autosomal recessive, and X-linked disorders.
In clinical genetics, heterogeneity manifests in multiple dimensions. At the inheritance level, autosomal dominant disorders require only a single pathogenic variant from one parent to cause disease, with a 50% chance of transmission to offspring [71]. In contrast, autosomal recessive diseases require pathogenic variants in both alleles of a gene, typically with both parents as carriers and a 25% chance of affected offspring [71] [15]. X-linked disorders follow more complex inheritance patterns based on the sex chromosomes [71].
Beyond these fundamental inheritance patterns, genetic heterogeneity introduces additional complexity through two primary mechanisms: locus heterogeneity (where variants in different genes cause the same disease) and allelic heterogeneity (where different variants within the same gene lead to diverse clinical presentations) [70]. This heterogeneity creates significant obstacles for genetic diagnosis and personalized treatment approaches, particularly in neurodevelopmental disorders, inherited cardiomyopathies, and retinal dystrophies where multiple genetic pathways can converge on similar phenotypic outcomes.
Types and Mechanisms of Genetic Heterogeneity
Categorical Framework of Heterogeneity
Genetic heterogeneity can be systematically categorized into three distinct types based on its manifestation in biomedical data:
- Feature Heterogeneity: This refers to variation in explanatory variables or risk factors, such as age, genetic ancestry, gene expression levels, or epigenetic markers. This type of heterogeneity is often controlled for in study designs to minimize confounding effects [70].
- Outcome Heterogeneity: This reflects variation in outcomes or dependent variables, encompassing clinical, phenotypic, disease, and trait heterogeneity. This manifests as variability in symptoms and clinical presentation among individuals with the same genetic condition, irrespective of the underlying genetic architecture [70].
- Associative Heterogeneity: This category describes heterogeneous patterns of association between genetic variants and phenotypes. Genetic heterogeneity specifically falls within this category, defined as the independent association of more than one locus or allele with the same or similar phenotypic outcome [70].
Locus versus Allelic Heterogeneity
The clinical impact of genetic heterogeneity is most apparent through two distinct mechanisms:
- Locus Heterogeneity: This occurs when pathogenic variants in different genes cause the same disease phenotype. For example, retinitis pigmentosa (RP) can result from mutations in over 40 different genes, including RPGR (X-linked), RHO (autosomal dominant), and USH2A (autosomal recessive) [72]. This heterogeneity complicates genetic testing, as targeted single-gene approaches may miss causative mutations in unexpected genes.
- Allelic Heterogeneity: This describes how different mutations within the same gene can lead to varied clinical presentations. In RPGR-related X-linked retinitis pigmentosa (XlRP), more than 300 different mutations have been identified, with patients demonstrating a wide range of clinical severity even within the same family [72]. The type and location of RPGR mutations significantly influence phenotypic expression, with mutations in exons 1-14 generally causing more severe disease than those in the ORF15 region [72].
Table 1: Comparative Analysis of Heterogeneity Types in Genetic Disorders
| Heterogeneity Type | Definition | Clinical Impact | Example Disorders |
|---|---|---|---|
| Locus Heterogeneity | Different genes cause similar phenotype | Reduces diagnostic yield in single-gene tests; requires broad testing approaches | Retinitis pigmentosa (>40 genes), Cardiomyopathy, Neurodevelopmental disorders |
| Allelic Heterogeneity | Different variants in same gene cause variable expression | Predicts disease severity and progression; influences genetic counseling | RPGR-related retinopathy, CFTR in cystic fibrosis, LMNA-related disorders |
| Clinical Heterogeneity | Variable symptoms with same genetic variant | Complicates prognosis and management; requires personalized monitoring | LMNA variants causing dilated cardiomyopathy vs. progeria |
| Associative Heterogeneity | Different genetic associations across populations | Affects generalizability of genetic findings; requires diverse cohorts | Varying penetrance of BRCA mutations across ethnic groups |
Methodological Approaches for Characterizing Genetic Heterogeneity
Genomic Technologies and Sequencing Strategies
Multiple molecular approaches have been developed to address the challenges posed by genetic heterogeneity in diagnostic and research settings:
- Single Gene Testing: This method uses fluorescent probes to precisely identify the nucleotide sequence of one gene. While highly accurate for well-defined monogenic diseases, its limited scope may miss diagnoses when the causative gene is unknown or when the disease has a multigenic etiology [71].
- Multigene Panels: These panels consist of curated sets of genes associated with a specific disease phenotype. The diagnostic yield of multigene panel testing is generally higher than single-gene methods due to broader coverage. However, this approach increases the likelihood of identifying variants of unknown significance (VUS), creating interpretation challenges [71].
- Whole-Exome Sequencing (WES): WES analyzes all protein-coding regions (exons) and their adjacent intronic boundaries across the genome. This method is particularly valuable when the genetic basis of the disease is unknown or when prior targeted testing has been inconclusive [71]. WES has enhanced the diagnostic yield for neurodevelopmental disorders in clinical practice, though interpretation challenges remain [31].
- Whole Genome Sequencing (WGS): WGS provides the most comprehensive analysis by sequencing both coding and non-coding regions of the genome, offering potential insights into regulatory elements that may contribute to heterogeneous presentations.
Computational and Analytical Frameworks
Advanced computational methods are essential for interpreting the complex data generated by genomic technologies:
- Genome-Wide Association Studies (GWAS): These traditional analyses identify quantitative trait loci in specific populations, providing insights into disease mechanisms. More recently, GWAS has been combined with functional genomic strategies to better understand disease pathology [73].
- Machine Learning Approaches: Semi-supervised machine learning frameworks (e.g., mantis-ml) integrate expression data with diverse features including intolerance metrics and protein-protein interaction data. These models have demonstrated high predictive power (AUCs: 0.84-0.95) for identifying risk genes for neurodevelopmental disorders and can distinguish between monoallelic and biallelic inheritance patterns [62].
- Network and Systems Biology Approaches: Quantitative systems pharmacology (QSP) integrates pharmacokinetic and pharmacodynamic data with the "system" being studied. This paradigm shift from a single-gene to a multi-modal approach provides a quantitative framework for integrating diverse omics data sources and translating molecular data to clinical outcomes [73].
The Scientist's Toolkit: Essential Research Reagents and Solutions
Table 2: Essential Research Materials for Genetic Heterogeneity Studies
| Research Tool | Specific Application | Function in Heterogeneity Research |
|---|---|---|
| Patient-derived iPSC Models | In vitro disease modeling | Recapitulates patient-specific genetic backgrounds for functional studies |
| Whole Exome/Genome Sequencing Kits | Comprehensive variant detection | Identifies coding and non-coding variants across the entire genome |
| Multigene Panels | Targeted mutation screening | Simultaneously examines multiple genes associated with a specific phenotype |
| Protein-Protein Interaction Assays | Network biology studies | Maps molecular interactions to understand pleiotropy and modifier effects |
| CRISPR-Cas9 Gene Editing Systems | Functional validation | Creates isogenic cell lines to study specific variant effects in controlled backgrounds |
| Population-Specific Biobanks | Association studies | Provides diverse genetic backgrounds for assessing variant frequency and penetrance |
| Bioinformatic Annotation Tools | Variant interpretation | Predicts functional impact of variants using combined computational algorithms |
Differential Impact on Dominant and Recessive Disorders
Molecular and Systems-Level Distinctions
Recent research has revealed fundamental differences between genes associated with dominant versus recessive inheritance patterns. A systematic analysis of neurodevelopmental disorders demonstrated that autosomal recessive-inherited genes show distinct characteristics compared to dominant genes [31]. These differences include:
- Functional Tolerance: Autosomal recessive genes are generally more tolerant of genetic variation, with higher population allele frequencies for pathogenic variants [31]. This suggests they are less critical for developmental processes, consistent with the requirement for biallelic inactivation to cause disease.
- Expression Patterns: Recessive genes demonstrate less brain-centered expression compared to dominant genes, which are more likely to be highly expressed in neural tissues [31].
- Protein Interactions: Recessive genes participate in fewer protein-protein interactions than dominant genes, suggesting they may operate in more specialized, limited pathways rather than central biological networks [31].
- Pathway Enrichment: Autosomal recessive genes are significantly enriched in metabolic processes, muscle organization, and metal ion homeostasis pathways, while dominant genes are more associated with transcriptional regulation and chromatin organization [31].
Inheritance-Specific Predictive Modeling
Machine learning approaches have demonstrated the importance of developing inheritance-specific models for gene discovery. Research on neurodevelopmental disorders shows that models trained specifically on monoallelic (dominant) and biallelic (recessive) patterns perform significantly better than generic models [62]. These inheritance-aware models showed 2-fold (monoallelic) to 6-fold (bi-allelic) enrichment for high-confidence risk genes compared to genic intolerance metrics alone [62].
Table 3: Inheritance-Specific Characteristics in Neurodevelopmental Disorder Genes
| Molecular Characteristic | Autosomal Dominant Pattern | Autosomal Recessive Pattern |
|---|---|---|
| Constraint Metrics | Highly constrained (low pLI) | More tolerant of variation (higher pLI) |
| Variant Effect Prediction | Higher CADD/phyloP scores | Lower functional prediction scores |
| Tissue Expression | Brain-centered expression patterns | More generalized tissue expression |
| Protein-Protein Interactions | More interaction partners | Fewer protein-protein interactions |
| Functional Enrichment | Transcriptional regulation, chromatin organization | Metabolic processes, mitochondrial function |
| Network Centrality | Hub positions in molecular networks | Peripheral positions in molecular networks |
Clinical Implications and Diagnostic Challenges
Diagnostic Yield and Interpretation Complexities
Genetic heterogeneity directly impacts diagnostic outcomes in clinical genetics. Studies of neurodevelopmental disorders demonstrate a diagnostic yield of approximately 50% through whole exome sequencing, with inherited variants accounting for 33.4% of diagnoses [31]. The challenges introduced by heterogeneity include:
- Variants of Unknown Significance (VUS): The identification of genetic variants with uncertain clinical significance represents a major challenge in heterogeneous conditions. Multigene panels increase the likelihood of VUS findings, creating counseling and management dilemmas [71].
- Incomplete Penetrance and Variable Expressivity: Not all individuals with a pathogenic variant develop disease (incomplete penetrance), and there can be significant variation in disease severity among individuals with the same variant (variable expressivity) [71]. This variability is particularly pronounced in autosomal dominant disorders.
- Pleiotropy: Single pathogenic variants can cause multiple different diseases, further complicating genotype-phenotype correlations. For example, variants in the LMNA gene can lead to dilated cardiomyopathy, arrhythmias, conduction abnormalities, or non-cardiac diseases including progeria and neuropathies [71].
Genetic Modifier Effects
Modifier genes significantly contribute to phenotypic heterogeneity by influencing the expression of primary disease-causing mutations. In X-linked retinitis pigmentosa due to RPGR mutations, common variants in two interacting proteins (IQCB1 and RPGRIP1L) are associated with severe disease, accounting for some of the clinical variation observed between patients with identical primary mutations [72]. This modifier effect illustrates how genetic background can significantly alter disease expression, even in monogenic disorders.
Implications for Drug Development and Personalized Medicine
Biomarker-Driven Therapeutic Development
The pharmaceutical industry is undergoing a transformation from "one-drug-fits-all" to personalized approaches, with biomarkers at the core of this paradigm shift [73]. Genetic heterogeneity directly impacts drug development strategies through:
- Patient Stratification: Understanding genetic heterogeneity enables the identification of biomarker-defined patient subgroups most likely to respond to targeted therapies. The 2017 FDA approval of pembrolizumab for microsatellite instability-high (MSI-H) solid tumors—regardless of tissue origin—exemplifies this biomarker-driven approach [73].
- Clinical Trial Design: Innovative trial designs that incorporate genetic heterogeneity, such as basket and umbrella trials, are essential for realizing biomarker-driven drug development. These designs allow for the evaluation of targeted therapies across multiple genetic subtypes simultaneously [73].
- Comprehensive Biomarker Profiles: The concept of a "disease blueprint"—defined as the true omni-level etiology of an individual's disease state—emphasizes the need for integrated biomarker assessments that capture the full spectrum of genetic heterogeneity [73].
Real-World Data and Personalized Therapy Ecosystems
The growing availability of real-world genomic data creates opportunities to better understand and address genetic heterogeneity in therapeutic development. A personalized therapy ecosystem (PTE) comprising multiple stakeholders—drug makers, diagnostic companies, regulatory agencies, academia, and patients—is emerging to address these challenges [73]. This ecosystem approach leverages real-world evidence to:
- Identify Novel Gene-Disease Associations: Large-scale genomic initiatives (e.g., 100,000 Genomes Project, Tohoku Medical Megabank Project) provide valuable data sources for discovering new genetic associations and understanding heterogeneity [73].
- Inform Drug Repurposing: Understanding shared molecular pathways across genetically heterogeneous disorders can identify new therapeutic applications for existing drugs [73].
- Develop Multi-Omics Signatures: Integrating genomic data with transcriptomic, proteomic, and metabolomic information can identify biomarker signatures that transcend single-gene effects, potentially leading to more effective stratification approaches [73].
Genetic heterogeneity, manifested through locus and allelic diversity, represents a fundamental challenge in modern genetics that significantly complicates diagnosis, prognosis, and treatment selection. The distinct characteristics of genes following dominant versus recessive inheritance patterns highlight the importance of inheritance-aware analytical approaches. Advances in genomic technologies, computational methods, and biomarker-driven strategies are gradually unraveling this complexity, enabling more precise diagnostic approaches and targeted therapeutic development. As our understanding of genetic heterogeneity deepens, integrated approaches that account for the full spectrum of molecular diversity will be essential for realizing the promise of personalized medicine across a broad range of genetic disorders.
Autosomal dominant (AD) disorders have traditionally been understood through the lens of Mendelian inheritance, where a single mutated allele passed from an affected parent to offspring is sufficient to cause disease. However, the phenomenon of de novo mutations (DNMs)—genetic alterations present for the first time in an affected individual that are absent in both parents' genomes—complicates this straightforward pattern and accounts for a substantial proportion of AD disorder cases [2] [74]. These spontaneous, non-inherited mutations are not subject to evolutionary selective pressure and often have pronounced disruptive effects on biological function, providing a genetic explanation for the persistence of severe, early-onset neurodevelopmental disorders that significantly reduce reproductive fitness [75] [74]. This technical review examines the mechanisms, detection methodologies, and clinical implications of DNMs, framing them within the broader context of AD inheritance patterns and their growing significance in therapeutic development.
Biological Mechanisms and Origins of De Novo Mutations
Molecular Mechanisms and Mutational Timing
DNMs arise from errors in DNA replication or from inefficient repair of spontaneous DNA lesions. The majority originate from erroneous nucleotide incorporation by DNA polymerases ε and δ during replication, with subsequent inefficiencies in the mismatch repair (MMR) pathway allowing these errors to become fixed in the genome [74]. Exogenous and endogenous mutagens, including UV radiation and reactive oxygen species, also contribute to DNA lesions that may evade nucleotide and base excision repair systems, particularly when short cell cycle times limit available repair windows [74].
The timing of a DNM determines its distribution within an individual's tissues and its potential for transmission to subsequent generations:
- Prezygotic mutations occur during gametogenesis in a parent's germ cell (sperm or egg) and are present in every cell of the resulting offspring [76] [77]. These are heritable.
- Postzygotic mutations occur after fertilization during embryonic development, leading to mosaicism—the presence of genetically distinct cell populations within a single individual [76]. The distribution and burden of the mutation depend on the developmental stage at which it occurs, with earlier mutations affecting more tissue lineages.
Germline mosaicism (or gonadal mosaicism), where a mutation is present only in a parent's germ cells and not in their somatic tissues, presents a particular challenge for genetic counseling, as unaffected parents can have multiple affected offspring despite testing negative for the mutation in their blood [76] [2].
Parental Origin and Influencing Factors
A pronounced paternal age effect is a hallmark of DNMs, with advanced paternal age strongly correlating with increased mutation burden in offspring [75] [74] [78]. Whole-genome sequencing studies estimate that approximately 80% of DNMs are paternal in origin [78], a bias attributed to the continuous cell divisions occurring in spermatogenesis throughout a man's life, which accumulate replication errors over time. One study calculated a paternal contribution of 1.53 DNMs per year of paternal age, alongside a weaker but significant maternal contribution of 0.86 DNMs per year [75].
Table 1: Factors Influencing De Novo Mutation Rates
| Factor | Effect | Underlying Mechanism |
|---|---|---|
| Paternal Age | Strong positive correlation (+1.53 DNMs/year) [75] | Continuous spermatogenesis; cumulative replication errors |
| Maternal Age | Weaker positive correlation (+0.86 DNMs/year) [75] | Primarily DNA lesion accumulation in arrested oocytes |
| Genomic Context | Variation in mutation rates across the genome [74] | CpG methylation, replication timing, recombination rate, chromatin state |
| Parental Consanguinity | No significant correlation with DNM rate [78] | Does not affect spontaneous mutation generation mechanisms |
The mutation rate across the genome is not uniform. Specific genomic contexts are more prone to mutation, including regions with high CpG dinucleotide content (where methylation and subsequent deamination cause C>T transitions), areas replicating late in the S-phase, and regions with specific chromatin states [74] [78]. Notably, consanguinity between parents does not appear to significantly alter the DNM rate in offspring, though it dramatically increases the burden of recessive disorders due to autozygosity [75] [78].
Figure 1: Parental Origin and Influencing Factors for De Novo Mutations. The majority of DNMs are paternal in origin, driven by continuous spermatogenesis and strongly influenced by advanced paternal age [75] [74] [78].
Detection and Analysis Methodologies
Experimental Workflow for DNM Discovery
The standard approach for identifying DNMs involves trio-based whole-exome or whole-genome sequencing (WES/WGS), where the affected proband and both unaffected parents are sequenced. This design enables the direct identification of novel variants present in the child but absent in both parental genomes [79] [75]. The typical bioinformatic workflow involves:
- Sequencing and Alignment: High-coverage (typically >30x) WGS or WES is performed on all trio members. Reads are aligned to a reference genome (e.g., GRCh37) using aligners like BWA [78].
- Variant Calling: A combinatorial approach using multiple variant callers—such as FreeBayes, VarScan, and RUFUS—increases sensitivity and specificity. This multi-tool strategy helps mitigate the limitations and biases of any single caller [78].
- Variant Filtration and Annotation: Called variants undergo stringent filtering based on genotype quality, read depth, and allele frequency in population databases (e.g., gnomAD). Variants are then annotated for predicted functional impact using tools like SnpEff [79] [78].
- Validation and Phasing: Putative DNMs, particularly those deemed likely pathogenic, are typically validated by an independent method such as Sanger sequencing. Read-based phasing tools (e.g., Unfazed) can determine the parental origin of the mutation by identifying inherited heterozygous variants on the same sequencing read [78].
Figure 2: Experimental Workflow for De Novo Mutation Discovery. The process relies on trio sequencing, combinatorial bioinformatics, and stringent validation to identify high-confidence DNMs [79] [78].
The Scientist's Toolkit: Key Research Reagents and Solutions
Table 2: Essential Research Reagents for DNM Studies
| Reagent / Tool | Primary Function | Technical Notes |
|---|---|---|
| TruSeq DNA Nano Kit (Illumina) | Library preparation for WGS | Ensures high-quality, representative sequencing libraries [78] |
| BWA-MEM | Alignment of sequencing reads to reference genome | Standard for accurate short-read alignment [78] |
| FreeBayes | Variant calling from VCF files | Identifies SNVs and indels; filtered by genotype/allele ratio [78] |
| VarScan | Variant calling from mpileup | Calls de novo variants with 'DENOVO' tag; uses p-value filter [78] |
| RUFUS | k-mer based variant calling from BAM files | Reference-independent approach; high sensitivity for DNMs [78] |
| SnpEff | Functional annotation of genetic variants | Predicts consequences (e.g., missense, nonsense), conservation, etc. [78] |
| Integrative Genomics Viewer (IGV) | Visual validation of candidate variants | Critical for manual inspection of aligned reads [78] |
Clinical and Therapeutic Implications
Spectrum of Disorders and Diagnostic Criteria
DNMs are a major cause of severe, early-onset neurodevelopmental and psychiatric disorders. The Deciphering Developmental Disorders (DDD) study, which sequenced 4,293 parent-offspring trios, estimated that ~42% of individuals with severe undiagnosed developmental disorders carry a pathogenic DNM in a coding sequence [75]. These mutations are enriched in genes crucial for brain development and function.
DNMs contribute to AD disorders through two primary molecular mechanisms: loss-of-function (haploinsufficiency) and altered-function (dominant-negative or gain-of-function) effects. The DDD study estimated that roughly half of pathogenic DNMs disrupt gene function entirely, while the remainder result in an altered-function protein product [75].
The American College of Medical Genetics and Genomics (ACMG) guidelines provide a framework for classifying the pathogenicity of identified variants. For example, in a case of MYT1L-related neurodevelopmental disorder, a de novo missense variant was classified as "Likely Pathogenic" based on the PM6 (confirmed de novo status) and PM2 (absence in population databases) criteria [79]. This systematic classification is essential for moving from variant discovery to clinical diagnosis.
Table 3: Neurodevelopmental Disorders with Prominent DNM Etiology
| Disorder | Key Associated Genes with DNMs | Prevalence Estimate |
|---|---|---|
| Intellectual Disability | MYT1L, SCN2A, SYNGAP1, DYRK1A [79] [75] | 1 in 213 to 1 in 448 births (for DNM-based disorders) [75] |
| Autism Spectrum Disorder (ASD) | GRIN2B, MYT1L, ARID1B, CHD8 [79] [75] [80] | 2-5% of children (major malformations/NDDs overall) [75] |
| Epilepsy | SCN1A, SCN2A, SCN8A, KCNQ2 [79] [75] | -- |
| Schizophrenia | SETD1A, LAMA2, TRIO [75] [77] | -- |
Implications for Drug Discovery and Development
The identification of DNMs provides powerful insights for therapeutic development by highlighting specific genes and biological pathways causally linked to disease. Gene-set analyses have revealed that existing drug classes for neuropsychiatric disorders, such as antipsychotics and antiepileptics, show significant enrichment for targeting gene sets that overlap with those hit by DNMs, validating these pathways therapeutically [81]. Furthermore, this approach can uncover unexpected drug classes for repurposing, such as lipid-lowering agents for schizophrenia and anti-neoplastic agents for neurodevelopmental conditions, potentially through mechanisms involving histone deacetylase inhibition or retinoid signaling [81].
Because DNMs are not confounded by the compensatory evolutionary changes that can occur with inherited variants, they often point more directly to core pathogenic mechanisms. This makes the proteins they encode highly attractive drug targets. The systematic identification of DNMs in large cohorts thus provides a robust foundation for target discovery and the development of novel, mechanism-based therapies for previously untreatable disorders.
De novo mutations represent a critical mechanism underlying sporadic cases of autosomal dominant disorders, profoundly reshaping our understanding of genetic inheritance. While AD disorders follow Mendelian principles within families, the de novo origin of a significant proportion of cases explains their occurrence in families with no prior history. The integration of trio-based sequencing, advanced bioinformatics, and systematic clinical correlation is essential for unraveling this complexity. For researchers and drug development professionals, the study of DNMs offers a powerful strategy for pinpointing biologically validated therapeutic targets and pathways, bridging the gap between genetic discovery and innovative treatment strategies for neurodevelopmental disorders. As sequencing technologies advance and cohort sizes grow, the precision with which we can interpret and target the consequences of these spontaneous mutations will undoubtedly accelerate.
Within the rigorous framework of Mendelian genetics, the patterns of autosomal dominant and autosomal recessive inheritance represent foundational concepts for researchers and clinicians. Autosomal dominant disorders manifest when a single copy of a pathogenic variant is sufficient to cause disease, while autosomal recessive conditions require biallelic mutations [82]. Pseudodominance describes a genetic phenomenon that challenges this clear dichotomy, occurring when a trait known to be recessive manifests in a pedigree with a pattern that visually mimics dominant inheritance [83] [84]. This occurrence represents a critical pitfall in genetic diagnosis and can significantly impact the accuracy of variant interpretation, disease gene discovery, and counseling within families. Understanding pseudodominance is therefore essential for research into complex inheritance patterns and the development of robust diagnostic protocols for monogenic diseases.
Core Mechanisms of Pseudodominance
Pseudodominance arises through several distinct biological mechanisms. A common thread is the presence of a recessive allele that, due to specific genetic circumstances, is expressed in individuals with only a single copy, thereby creating the illusion of a dominant trait in a pedigree.
Primary Biological Mechanisms
- Hemizygosity in Sex-Linked Inheritance: For genes located on the X chromosome, males (with their single X chromosome) will express a recessive allele because they lack a second, potentially dominant, allele. This is not pseudodominance in the strictest autosomal sense but is a classic example of a recessive trait appearing dominant in a pedigree. Conditions such as haemophilia and red-green colour blindness are expressed mainly in males for this reason, creating a pattern where an unaffected mother can pass the trait to her sons [84].
- Loss of the Dominant Allele: In autosomal contexts, pseudodominance can occur in a heterozygote if the wild-type (dominant) allele is lost. This can happen through a deletion event or a deficiency mutation that inactivates the dominant allele. The individual, now functionally homozygous for the recessive allele at that locus, expresses the recessive phenotype [84] [85]. For example, if an individual inherits a recessive mutant allele from one parent and a chromosomal deletion encompassing the corresponding gene from the other, they have no functional dominant allele and the recessive trait is revealed.
- High Allele Frequency in Consanguineous Populations: In populations with high rates of consanguinity, the frequency of a specific recessive allele can become elevated. This increases the probability that an individual who marries into the family, even distantly, is also a carrier of the same allele. Consequently, an affected offspring can be born to parents where only one has an obvious family history of the condition, making the inheritance appear dominant across generations [84]. A study on ectrodactyly noted that 23 affected individuals in a large consanguineous family suggested pseudodominance due to the high frequency of the mutant allele [84].
- Genomic Imprinting: Epigenetic silencing of one allele, based on parental origin, can also produce pseudodominant inheritance patterns. If the active allele from one parent carries a recessive mutation, and the allele from the other parent is imprinted (and thus silenced), the recessive phenotype will be expressed [84].
A Case Study: MIRAS Mimicking Dominant Ataxia
A compelling real-world example of pseudodominance is found in a family presenting with spinocerebellar ataxia (SCA) showing apparent dominant inheritance and anticipation. Molecular analysis revealed that both affected mother and son were actually homozygous for a recessive mutation in the POLG1 gene, which causes mitochondrial recessive ataxia syndrome (MIRAS). The healthy father was a heterozygous carrier. The high carrier frequency of this specific MIRAS mutation in the population led to its independent introduction from both sides of the family, perfectly mimicking a dominant inheritance pattern [86]. This case underscores the necessity of considering recessive models even in pedigrees with a dominant appearance.
Quantitative Analysis and Research Data
The challenge of pseudodominance and other diagnostic pitfalls is not a rare occurrence in large-scale genetic studies. Recent research quantifies the impact of these challenges on diagnostic yield.
Table 1: Diagnostic Challenges in a Large Mendelian Cohort
| Challenge Category | Description | Impact on Cohort (n=4577 families) |
|---|---|---|
| Phenotype-Related | Includes phenotypic heterogeneity, expansion, and novel allelic disorders. | 5.3% of challenged families (83 families) exhibited novel allelic disorders [87]. |
| Pedigree Structure | Includes pseudodominance and other patterns masquerading as different inheritance. | A specific subset of the 34.3% of families facing any challenge; exact figure not specified [87]. |
| Overall Challenge Prevalence | Families encountering ≥1 pitfall in causal variant identification. | 34.3% (1570 families) [87]. |
| Potential Diagnostic Yield Increase | Addressing non-sequencing-based challenges. | Up to 71% increase in diagnostic yield [87]. |
Table 2: Consequences of Ignoring Genetic Effects in Genomic Evaluation
| Metric | Impact of Ignoring Dominance Effects | Magnitude of Change |
|---|---|---|
| Prediction Accuracy | Decrease in accuracy of Genomic Estimated Breeding Values (GEBVs) | 14% to 31% decrease [88]. |
| Mean Square Error | Increase in error of GEBVs | 19% to 47% increase [88]. |
| Bias | Increase in bias of GEBVs | 20% to 42% increase [88]. |
| Dispersion | Increase in dispersion of GEBVs | Up to 50% increase [88]. |
Experimental and Diagnostic Methodologies
Accurately identifying pseudodominance requires a multi-faceted approach that moves beyond standard single-gene or exome sequencing analysis.
Comprehensive Genomic Workflow
A recommended diagnostic and research workflow to uncover pseudodominance includes:
- Detailed Pedigree Analysis: Documenting family history over multiple generations, with specific attention to parental relatedness (consanguinity) [87].
- High-Density Genotyping or Sequencing: Utilizing whole-genome sequencing (WGS) to capture a broad spectrum of variant types, including single nucleotide variants (SNVs), insertions/deletions (indels), and copy number variants (CNVs) [87]. This is crucial for detecting deletions that cause hemizygosity.
- Autozygosity Mapping: For consanguineous families, identifying runs of homozygosity (ROH) can pinpoint candidate regions for recessive disorders. A deviation from this expected pattern—such as a supposedly dominant trait appearing in these regions—can be a red flag for pseudodominance [87].
- Segregation Analysis: Testing available family members to confirm the co-segregation of the candidate variant with the disease phenotype. This helps confirm the mode of inheritance and can reveal if a supposedly dominant variant is actually present in a homozygous state in affected individuals [87].
- Variant Interpretation and Phenotype Correlation: Rigorously assessing the identified variant(s) against population frequency databases, in silico prediction tools, and the established literature. This includes considering the possibility of novel allelic disorders where the phenotype differs from the known gene-disease association [87].
Diagram 1: Diagnostic workflow for pseudodominance. This flowchart outlines the key steps, from initial patient presentation to final diagnosis, highlighting the critical analyses that differentiate pseudodominance from true dominant inheritance.
The Scientist's Toolkit: Research Reagent Solutions
Table 3: Essential Reagents and Tools for Investigating Pseudodominance
| Research Reagent / Tool | Function / Application |
|---|---|
| Whole Genome Sequencing (WGS) | Provides comprehensive coverage for detecting SNVs, indels, CNVs, and structural variants that may cause hemizygosity [87]. |
| High-Density SNP Microarrays | Enables autozygosity mapping to identify ROH and copy number variation analysis [88] [87]. |
| PCR and Sanger Sequencing | Gold standard for validating putative pathogenic variants and performing segregation analysis within families [87]. |
| Bidirectional Allele-Specific PCR | A specific technique to confirm the phase of variants (cis/trans) in compound heterozygotes, clarifying recessiveness. |
| Multiplex Ligation-dependent Probe Amplification (MLPA) | A technique used to detect exon-level deletions or duplications that may be missed by sequencing [87]. |
| Genetic Analysis Software (e.g., for GBLUP, Bayesian methods) | Statistical packages for genomic evaluation that can model dominance effects to improve prediction accuracy [88]. |
Implications for Research and Drug Development
The phenomenon of pseudodominance has profound implications that extend from basic research to clinical trials.
- Variant Interpretation and Disease Gene Discovery: Misclassifying a recessive disorder as dominant can lead to the incorrect assertion of a gene-disease relationship, suggesting a dominant model for a gene that actually causes disease recessively. This can misdirect future research and clinical testing [87]. Accurate classification is vital for building reliable genomic databases.
- Clinical Trial Design and Patient Stratification: In the era of personalized medicine, clinical trials for genetic disorders often target specific mutations or inheritance patterns. Misunderstanding the true inheritance mechanism could lead to the inclusion of inappropriate patients, potentially diluting the therapeutic signal and leading to trial failure. Correctly identifying pseudodominance ensures that patient cohorts are accurately stratified.
- Genomic Selection in Agriculture: In animal and plant breeding, ignoring dominance effects when they are present leads to inaccurate, biased, and dispersed estimates of Genomic Estimated Breeding Values (GEBVs). This reduces the efficiency of genomic selection programs, as detailed in Table 2 [88]. Incorporating these effects into models is crucial for maximizing genetic gain.
- Genetic Counseling and Risk Assessment: The recurrence risk for a recessive disorder exhibiting pseudodominance is entirely different from that of a true dominant disorder. Providing accurate counseling depends on a correct diagnosis. For example, the offspring of an individual with a recessive disorder due to pseudodominance are not at 50% risk of being affected (as in dominant inheritance) but are far more likely to be carriers, unless the other parent is also a carrier [82] [13].
Pseudodominance serves as a critical reminder that the expression of genetic information is complex and influenced by context—including the other alleles in a genotype and the structure of the pedigree. For researchers and drug development professionals, a deep understanding of this phenomenon is not merely academic. It is a practical necessity for ensuring accurate molecular diagnoses, validating gene-disease relationships, designing effective clinical trials, and providing precise genetic counseling. As genomic medicine continues to evolve, recognizing and accounting for exceptions like pseudodominance will be fundamental to translating genetic data into meaningful health outcomes.
Within the broader research on autosomal inheritance patterns, a critical distinction exists between autosomal dominant and autosomal recessive disorders. Autosomal dominant (AD) conditions require only a single mutant allele for expression, occur in every generation, and have a 50% recurrence risk for offspring of an affected individual [89]. In contrast, autosomal recessive (AR) disorders require two mutant alleles, often appear suddenly in siblings without affected parents, and typically have a 25% recurrence risk for carrier parents [89]. This fundamental biological difference explains why AR disorders are particularly susceptible to population-specific forces such as consanguinity and founder effects, resulting in dramatically variable prevalence rates across different ethnic and geographic populations [90] [91] [92].
Consanguinity, defined as marriage between individuals related as second cousins or closer, increases the probability that offspring will inherit identical recessive mutations from both parents [91] [93]. Founder effects occur when a population originates from a small group of ancestors, some of whom carried specific AR mutations that then drift to higher frequencies in the descendant population [94] [95]. Together, these factors create unique genetic landscapes that disproportionately increase the prevalence of certain AR disorders, presenting both challenges and opportunities for researchers and drug development professionals.
Quantitative Epidemiology of AR Disorders
Global Burden and Population-Specific Prevalence
Autosomal recessive disorders collectively represent a significant disease burden, affecting approximately 1.7–5 in 1000 neonates, compared to 1.4 in 1000 for autosomal dominant disorders [90]. However, this burden is not uniformly distributed across populations. A comprehensive 2021 analysis of 508 AR genes across seven ethnogeographic groups revealed that 27% of 406 AR diseases were limited to specific populations, while 68% showed more than tenfold prevalence differences across major population groups [90].
Table 1: Comparative Prevalence of Selected Autosomal Recessive Disorders Across Populations
| Disorder | Gene | Population | Prevalence/Carrier Frequency | Reference |
|---|---|---|---|---|
| Tay-Sachs disease | HEXA | Ashkenazi Jews | 1 in 3,600 live births | [90] |
| Other populations | 1 in 320,000 live births | [90] | ||
| Sickle cell anemia | HBB | African populations | 1 in 475 (carrier freq: >30-fold higher) | [90] |
| Cystic fibrosis | CFTR | Europeans | 248 carriers per 10,000 | [90] |
| East Asians | 0 carriers per 10,000 | [90] | ||
| Medium-chain acyl-CoA dehydrogenase deficiency | ACADM | Ethnic Danes | 58% of detected IEM cases | [93] |
| Ethnic minorities in Denmark | 36.8% of detected IEM cases | [93] |
Consanguinity Rates and Associated Disease Risk
Consanguinity rates show dramatic global variation, directly influencing the prevalence of AR disorders. In Western nations, consanguineous marriages account for less than 1.5% of unions, compared to 20-50% in many Arab countries and up to 60% in parts of Pakistan [91] [92]. In Saudi Arabia, consanguinity rates between 29.7% and 56% have been reported, with first-cousin marriages constituting the most common form [91] [92].
Table 2: Global Consanguinity Rates and Impact on AR Disorders
| Region/Population | Consanguinity Rate | Measured Impact on AR Disorders | Reference |
|---|---|---|---|
| Arab countries (general) | 20-50% of all marriages | Not quantified but clinically significant | [92] |
| Saudi Arabia | 29.7-56% | High burden of rare AR diseases | [91] [92] |
| Pakistan | >60% of marriages | 30% of severe childhood obesity explained by monogenic variants | [92] |
| Ethnic minorities in Denmark | 60.6% among families with IEM | 25.5x higher IEM prevalence vs. ethnic Danes | [93] |
| Ethnic Danes | 2.15% among families with IEM | Baseline rate (0.21/10,000) | [93] |
| Hutterite population (North America) | Founder population with limited founders | >28 AR diseases identified, high carrier frequencies for multiple mutations | [94] |
The relationship between consanguinity and AR disorder prevalence is quantifiable. In Denmark, the frequency of inborn errors of metabolism (IEM) with AR inheritance was 25.5 times higher among children of Pakistani, Turkish, Afghan, and Arab origin compared to ethnic Danes, directly correlated with a 28.2-fold higher consanguinity rate in these communities [93].
Methodological Approaches for Studying Genetic Architecture
Genomic Sequencing and Variant Annotation
Contemporary research on AR disorders utilizes comprehensive sequencing approaches combined with rigorous variant annotation pipelines. The 2021 study by et al. analyzed 508 AR genes using sequencing data from 141,456 individuals across seven ethnogeographic groups [90]. Their methodology integrated:
- Documented pathogenic variants from ClinVar with stringent functionality predictions
- Computational algorithms for variants with unknown or conflicting pathogenicity
- Validation against 85 diseases with established prevalence data (r = 0.68; p < 0.0001)
This approach identified 46,935 putatively pathogenic variations out of 574,524 total variants, with missense (59.4%), frameshift (16.2%), and stop gain (12%) variations being most prevalent among pathogenic variants [90].
Diagram 1: Experimental workflow for AR disorder gene identification. The core pathway shows the traditional research pipeline, while supplementary methods provide additional validation. Adapted from methodology in [96].
Autozygosity Mapping in Consanguineous Populations
Autozygosity mapping leverages the fact that offspring of consanguineous unions inherit identical chromosomal segments from common ancestors. This approach is particularly powerful for gene discovery in populations with high consanguinity rates [91] [96]. The standard protocol includes:
- Identification of homozygous segments shared among affected individuals
- STR marker analysis or SNP-based homozygosity mapping
- Sequencing of candidate genes within homozygous regions
- Segregation analysis in families and unrelated controls
A 2020 study of Limb-girdle muscular dystrophies in Iran demonstrated this approach, where 40 of 60 families showed homozygous haplotypes in CAPN3, DYSF, SGCA, and SGCB genes, leading to identification of 38 mutations, including five novel variants [96]. The study confirmed founder effects for specific DYSF and SGCB mutations in Iranian subpopulations [96].
Molecular Genetics and Founder Effect Mechanisms
Founder Mutation Characterization
Founder effects occur when a specific mutation present in a population's founding members becomes prevalent due to genetic drift in isolated communities [94]. The Hutterite population of North America, descended from fewer than 90 founders, demonstrates this phenomenon with carrier frequencies for certain AR mutations reaching remarkably high levels [94]. Molecular characterization of founder mutations involves:
- Haplotype analysis to confirm common ancestry
- Dating mutations based on recombination events
- Population frequency studies across different ethnogeographic groups
For example, cystic fibrosis mutations show distinct founder patterns: p.Phe508del predominates in Europeans (248 carriers per 10,000) while p.Trp1282Ter is most prevalent in Ashkenazim (46% of cystic fibrosis cases) [90]. Similarly, Wilson disease is primarily attributed to p.His1069Gln in Ashkenazim and Europeans but to p.Arg778Leu in East Asians [90].
Diagram 2: Genetic and cultural pathways to increased AR disorder prevalence. Founder effects (top pathway) and consanguinity (bottom pathway) represent distinct but sometimes overlapping mechanisms that increase disease incidence.
Genetic Complexity and Allelic Heterogeneity
Despite population-specific founder mutations, AR diseases often display significant genetic complexity. Some genes harbor hundreds of pathogenic variants—ABCA4 (Stargardt disease) leads with 528 pathogenic variants, followed by SI (sucrase-isomaltase deficiency) with 494 variants, and CFTR with 408 variants [90]. This heterogeneity presents challenges for genetic screening programs that must account for population-specific variations in mutation spectra.
The highest aggregate frequency of pathogenic variants occurs in PRODH (7.4%) associated with hyperprolinemia, BTD (3.5%) linked to biotinidase deficiency, and HFE (3.4%) associated with type I hemochromatosis [90]. This indicates that even within outbred populations, some AR disorders maintain substantial prevalence due to high carrier frequencies of multiple alleles.
Table 3: Essential Research Reagents and Solutions for AR Disorder Studies
| Resource Category | Specific Examples | Application/Function | Reference |
|---|---|---|---|
| Sequencing Technologies | Whole exome sequencing, Whole genome sequencing, Targeted panel sequencing | Comprehensive variant detection, novel gene discovery | [92] [97] |
| Pathogenicity Prediction Tools | DANN, FATHMM, GERP, Mutation Taster, Human Splicing Finder | In silico assessment of variant deleteriousness | [96] |
| Population Genetics Databases | ClinVar, gnomAD, population-specific biobanks | Pathogenicity annotation, allele frequency comparison | [90] |
| Molecular Validation Tools | Sanger sequencing, MLPA for large deletions, Immunohistochemistry | Variant confirmation, copy number variation analysis, protein expression studies | [96] |
| Homozygosity Mapping Tools | STR markers, SNP arrays, Autozygosity mapping algorithms | Identification of regions of homozygosity in consanguineous families | [91] [96] |
Consanguinity and founder effects dramatically reshape the landscape of autosomal recessive disorders across human populations. The interplay between cultural practices, population genetics, and molecular mechanisms creates distinct ethnic profiles of AR disease prevalence that must be accounted for in both clinical practice and research contexts. The methodologies outlined here—from autozygosity mapping in consanguineous families to population-genetic analyses of founder mutations—provide powerful approaches for dissecting these complex patterns. For drug development professionals and researchers, understanding these population-specific dynamics is essential for designing targeted screening programs, developing ethnically appropriate therapies, and advancing personalized medicine approaches for autosomal recessive disorders.
The relationship between an individual's genetic makeup (genotype) and its observable clinical manifestations (phenotype) forms the cornerstone of modern genetic medicine. Within this framework, inheritance patterns—particularly autosomal dominant (AD) and autosomal recessive (AR) transmission—provide critical predictive frameworks for understanding disease susceptibility, severity, and clinical progression. These patterns fundamentally influence how genetic variants manifest across populations and individuals, creating distinct correlations that researchers and clinicians can decipher to improve diagnosis, prognosis, and therapeutic development [13] [98].
In autosomal dominant disorders, a single copy of a variant allele is sufficient to cause disease, often resulting from haploinsufficiency or dominant-negative effects that disrupt normal protein function. In contrast, autosomal recessive conditions typically require two pathogenic variants—one inherited from each parent—to manifest clinically, as the remaining functional copy from one parent often provides sufficient protein activity to prevent disease in heterozygous carriers [13]. This fundamental biological difference creates divergent landscapes for genotype-phenotype correlation studies, with implications for everything from molecular diagnostics to targeted drug development.
Fundamental Inheritance Patterns and Their Molecular Mechanisms
Autosomal Dominant Inheritance Characteristics
Autosomal dominant disorders exhibit several distinguishing features that shape their genotype-phenotype relationships. These conditions typically appear in multiple generations with vertical transmission, affect both males and females equally, and confer a 50% risk of transmission from an affected parent to each offspring [13]. The molecular mechanisms underlying AD disorders often involve:
- Haploinsufficiency: Where a single functional copy of a gene cannot produce sufficient protein to maintain normal function
- Dominant-negative effects: Where the mutant gene product interferes with the function of the wild-type allele
- Gain-of-function mutations: Where the mutation confers new or enhanced activity on the gene product
Autosomal Recessive Inheritance Characteristics
Autosomal recessive disorders display fundamentally different inheritance characteristics, typically appearing only in a single generation (usually siblings) with unaffected parents who are heterozygous carriers. The recurrence risk for carrier parents is 25% for each pregnancy, with males and females equally affected [13]. The molecular basis of AR disorders frequently involves:
- Loss-of-function mutations: Where both alleles contain variants that abolish or significantly reduce gene function
- Enzyme deficiencies: Particularly relevant for metabolic disorders where partial enzyme activity may modify disease severity
- Hypomorphic alleles: Variants that reduce but do not completely eliminate gene function, which can significantly influence phenotypic expression [98]
Table 1: Comparative Features of Autosomal Dominant and Recessive Inheritance
| Feature | Autosomal Dominant | Autosomal Recessive |
|---|---|---|
| Variant copies required | One | Two |
| Transmission pattern | Vertical across generations | Horizontal within single generation |
| Reproductive risk | 50% from affected parent | 25% from carrier parents |
| Carrier phenotype | Affected | Unaffected |
| Common molecular mechanisms | Haploinsufficiency, dominant-negative, gain-of-function | Loss-of-function, enzyme deficiencies |
| Examples | Huntington's disease, Neurofibromatosis, Achondroplasia | Cystic fibrosis, Sickle cell disease, Tay-Sachs |
Quantitative Models for Predicting Disease Risk Genes
Advancements in computational biology have enabled the development of sophisticated models that predict disease-risk genes based on inheritance patterns, significantly accelerating gene discovery and validation efforts.
Machine Learning Approaches for Neurodevelopmental Disorders
For neurodevelopmental disorders (NDDs) including autism spectrum disorder (ASD), developmental and epileptic encephalopathy (DEE), and developmental delay (DD), inheritance-specific machine learning models have demonstrated remarkable predictive power. These models integrate single-cell RNA sequencing data with hundreds of orthogonal features including:
- Genic intolerance metrics quantifying purifying selection against functional variation
- Protein-protein interaction data mapping biological network connectivity
- Evolutionary conservation scores indicating functional constraint
- Gene ontology annotations providing biological context [7]
These models achieve exceptional performance, with area under the receiver operator curves (AUCs) ranging from 0.84 to 0.95 across different NDDs and inheritance patterns. The top-ranked genes from these models show substantial enrichment for high-confidence NDD risk genes—up to 2-fold for monoallelic models and 6-fold for bi-allelic models compared to genic intolerance metrics alone. Furthermore, genes ranking in the top decile were 45 to 180 times more likely to have literature support than those in the bottom decile, validating their predictive utility [7].
Experimental Protocol: Inheritance-Specific Risk Gene Prediction
The standard methodology for predicting inheritance-specific risk genes involves a multi-stage computational pipeline:
Seed Gene Curation: High-confidence disease-associated genes are compiled from authoritative databases (SFARI for ASD, DDG2P for developmental disorders, OMIM for DEE) and stratified by molecular mechanism and inheritance pattern.
Feature Engineering: Hundreds of gene-level features are calculated, including:
- Expression patterns from single-cell RNA-seq data across developmental timepoints
- Genic intolerance scores (pLI, LOEUF) from population sequencing data
- Protein interaction network properties and pathway membership
- Evolutionary constraint metrics across mammalian lineages
Model Training: Semi-supervised machine learning frameworks (e.g., mantis-ml) are employed to train inheritance-specific classifiers using the curated seed genes as positive examples.
Validation and Prioritization: Model predictions are validated against independent datasets from large-scale sequencing studies, with top candidates prioritized for functional validation [7].
Diagram 1: Inheritance-specific risk gene prediction workflow.
Clinical Applications: From Correlation to Prediction
Ocular Disorders: Nanophthalmos with Secondary Angle-Closure Glaucoma
In nanophthalmos with secondary angle-closure glaucoma (NSACG), distinct genotype-phenotype correlations emerge based on inheritance patterns. A prospective study of 88 Chinese patients revealed that PRSS56 and MFRP variants followed autosomal recessive inheritance, while MYRF and TMEM98 variants exhibited autosomal dominant transmission [99]. The clinical implications of these genetic differences are substantial:
- Patients with AD mutations presented with younger age of glaucoma onset
- AD cases demonstrated more severe visual field defects and thinner macular retinal thickness
- Individuals with genetic diagnoses (regardless of inheritance pattern) showed shorter axial length, more crowded anterior segments, and accelerated glaucoma progression [99]
These correlations enable clinicians to predict disease course based on molecular diagnosis and implement earlier, more aggressive interventions for patients with AD forms of NSACG.
RASopathies: Signaling Pathway Disorders
RASopathies represent a genetically heterogeneous group of developmental disorders caused by germline variants in genes regulating the RAS/MAPK signaling pathway. In a North Indian cohort of 46 patients with confirmed pathogenic variants, all mutations were heterozygous missense changes consistent with autosomal dominant inheritance [100]. The genotype-phenotype correlations revealed:
- PTPN11 and SOS1 variants showed a trend toward association with pulmonary stenosis
- The most common clinical features across genotypes included short stature (64.7%), downslanting palpebral fissures (38.23%), and chest wall deformities (35.29%)
- Each gene demonstrated unique phenotypic fingerprints despite pathway overlap [100]
These findings underscore how different mutations within the same functional pathway can produce distinct yet overlapping clinical features, creating challenges and opportunities for targeted therapeutic interventions.
Table 2: Genotype-Phenotype Correlations in RASopathies and Ocular Disorders
| Disorder Category | Genes | Inheritance Pattern | Key Phenotypic Correlations |
|---|---|---|---|
| RASopathies | PTPN11, SOS1 | Autosomal Dominant | Short stature, facial dysmorphism, cardiac defects |
| RASopathies | BRAF, MAP2K2 | Autosomal Dominant | Similar features with potential malignancy risk |
| NSACG | PRSS56, MFRP | Autosomal Recessive | Later onset, less severe visual field loss |
| NSACG | MYRF, TMEM98 | Autosomal Dominant | Younger onset, severe field defects, thinner retinas |
Emerging Technologies and Computational Approaches
Drug Toxicity Prediction Using Genotype-Phenotype Differences
A major challenge in pharmaceutical development is the poor translatability of preclinical toxicity findings to human outcomes. To address this, researchers have developed a machine learning framework that incorporates genotype-phenotype differences (GPD) between preclinical models (cell lines and mice) and humans to improve prediction of human drug toxicity [101].
The GPD framework assesses differences across three biological contexts:
- Gene essentiality: Differing requirements for specific genes across species
- Tissue expression profiles: Divergent expression patterns of drug targets
- Network connectivity: Species-specific variations in biological network architecture [101]
When applied to 434 risky and 790 approved drugs, GPD features significantly associated with drug failures due to severe adverse events. A Random Forest model integrating GPD with chemical features demonstrated enhanced predictive accuracy (AUPRC = 0.63 vs. baseline 0.35; AUROC = 0.75 vs. baseline 0.50), particularly for neurotoxicity and cardiovascular toxicity—major causes of clinical failures that were previously overlooked using chemical properties alone [101].
Experimental Protocol: Genotype-Phenotype Difference Assessment
The standard methodology for GPD-based toxicity prediction involves:
Drug Dataset Curation: Compiling drugs with known toxicity profiles, including:
- Drugs that failed clinical trials due to safety issues
- Drugs withdrawn from market due to adverse events
- Drugs carrying boxed warnings for life-threatening events
- Approved drugs with no reported severe adverse events as controls
GPD Feature Calculation: Quantifying differences between preclinical models and humans for:
- Gene essentiality scores from CRISPR screening data
- Tissue-specific expression profiles from transcriptomic datasets
- Protein-protein interaction network properties and pathway context
Model Training and Validation: Implementing machine learning algorithms (e.g., Random Forest) using GPD features alongside traditional chemical descriptors, with rigorous cross-validation and chronological testing to simulate real-world performance [101].
Generative AI for Genotype-Tailored Therapeutics
The Genotype-to-Drug Diffusion (G2D-Diff) model represents a cutting-edge approach that uses generative artificial intelligence to create small molecule structures tailored to specific cancer genotypes. This method leverages:
- Somatic alteration genotypes from clinically relevant genes rather than gene expression data
- Desired drug response stratified into sensitivity classes
- Diffusion-based generative modeling to create novel compound structures optimized for specific genetic contexts [102]
This approach directly addresses the challenge of tumor heterogeneity and limited drug targets by generating hit-like candidates conditioned on complex genomic features, demonstrating exceptional performance in generating diverse, feasible, and condition-matching compounds [102].
Diagram 2: Genotype-phenotype differences in toxicity prediction.
The Scientist's Toolkit: Essential Research Reagents and Solutions
Table 3: Essential Research Reagents for Genotype-Phenotype Correlation Studies
| Research Tool | Specific Application | Function in Experimental Protocol |
|---|---|---|
| Whole Exome Sequencing (WES) | Variant identification in Mendelian disorders | Captures coding regions of genome; identifies pathogenic variants in known and novel disease genes |
| Single-cell RNA Sequencing (scRNA-seq) | Cell-type-specific expression analysis | Maps gene expression patterns in developing and mature tissues; identifies cell-type-specific risk genes |
| CRISPR Screening Libraries | Functional genomics and essentiality mapping | Identifies genes essential for cell survival in specific contexts; quantifies genotype-phenotype relationships |
| Drug-Gene Interaction Database (DGIdb) | Therapeutic target identification | Catalogs known and predicted drug-gene interactions; prioritizes repurposing candidates |
| Genome Analysis Toolkit (GATK) | Variant discovery and genotyping | Standardized processing of sequencing data; variant quality recalibration and filtering |
| Molecular Dynamics Simulation | Protein structure-function analysis | Models structural consequences of genetic variants; predicts disruptive vs. benign mutations |
Genotype-phenotype correlations rooted in inheritance patterns provide a powerful framework for predicting disease severity, progression, and therapeutic response. The contrasting landscapes of autosomal dominant and recessive disorders create distinct correlation patterns that inform clinical management and drug development. As computational approaches become increasingly sophisticated—from inheritance-specific machine learning models to generative AI for drug discovery—researchers are better equipped than ever to decipher the complex relationship between genetic variation and clinical outcomes. These advances promise to accelerate the development of targeted therapies and personalize interventions based on an individual's unique genetic blueprint, ultimately improving outcomes across a broad spectrum of genetic disorders.
Comparative Analysis and Validation: Distinguishing Inheritance Patterns in Research and Therapy
The study of inheritance patterns constitutes a cornerstone of genetic research, providing the fundamental framework for understanding how traits and disorders are transmitted across generations. Within this framework, autosomal inheritance patterns—specifically autosomal dominant and autosomal recessive—represent two primary mechanisms by which genetic information is passed via the 22 paired autosomes (non-sex chromosomes) [82] [13]. These patterns follow the basic laws of inheritance first elucidated by Gregor Mendel in the 19th century, which describe how discrete units (now known as genes) segregate and assort during gamete formation [15] [2].
For researchers and drug development professionals, a precise understanding of these patterns is not merely academic; it is critical for diagnosing genetic disorders, calculating recurrence risks, understanding disease mechanisms, and developing targeted therapeutic strategies. This whitepaper provides a comprehensive technical comparison of autosomal dominant and recessive inheritance, integrating classic Mendelian principles with contemporary molecular insights and research methodologies relevant to the scientific community.
Core Principles and Comparative Analysis
Foundational Genetic Concepts
Autosomal inheritance involves genes located on autosomes, which are chromosomes numbered 1 through 22. Both males and females inherit two copies of each autosome (and thus each autosomal gene), one from each biological parent [82] [13]. The specific combination of alleles (gene variants) an individual possesses for a given gene is their genotype, while the observable expression of that genotype is their phenotype.
A dominant allele is one that expresses its phenotype even when just a single copy is present (heterozygous state) [10] [2]. A recessive allele, in contrast, requires two copies (homozygous state) to be expressed phenotypically [15] [103]. The terms "dominant" and "recessive" describe the phenotypic expression pattern, not the allele itself or its inherent properties.
Side-by-Side Mechanistic Comparison
The following table summarizes the key differentiating features of autosomal dominant and recessive inheritance patterns, essential for genetic counseling and pedigree analysis.
Table 1: Comparative Overview of Autosomal Dominant and Recessive Inheritance
| Feature | Autosomal Dominant (AD) | Autosomal Recessive (AR) |
|---|---|---|
| Genotype for Expression | Heterozygous (single mutant allele) is sufficient [10] [2] | Homozygous (two mutant alleles) required [15] [103] |
| Typical Pedigree Pattern | Vertical transmission (multiple affected generations) [15] [9] | Horizontal transmission (often a single affected generation, e.g., siblings) [15] |
| Parental Genotype | One affected parent (typically heterozygous) [82] | Both parents are typically asymptomatic carriers (heterozygous) [82] [103] |
| Recurrence Risk for Offspring | 50% per pregnancy when one parent is affected [82] [10] | 25% per pregnancy when both parents are carriers [82] [15] |
| Sex Distribution | Affects males and females equally [10] [2] | Affects males and females equally [15] [103] |
| Carrier Status | Not applicable; heterozygous individuals are affected. | Heterozygous individuals are typically unaffected carriers [15] [103] |
| Influence of Consanguinity | No strong association | Significantly increases risk [15] |
| Common Molecular Mechanisms | Haploinsufficiency, Gain-of-function, Dominant negative [2] [9] | Loss-of-function (both alleles inactivated) [15] |
Key Genetic Concepts in Research and Clinical Expression
Penetrance and Expressivity in AD Disorders: Penetrance refers to the proportion of individuals with a pathogenic variant who exhibit any clinical signs of the disorder. Complete penetrance means all carriers express the phenotype, while incomplete or reduced penetrance occurs when some individuals with the mutant genotype show no symptoms [10] [2] [9]. Variable expressivity describes the range in severity and specific manifestations of the disorder among individuals with the same pathogenic variant, even within the same family [104] [9]. These concepts are critical in disorders like hereditary breast and ovarian cancer (BRCA1/2), where penetrance is incomplete, and in neurofibromatosis, where expressivity is highly variable [10].
De Novo Mutations: A significant number of autosomal dominant disorders arise from de novo mutations, which are new mutations occurring in the germline (sperm or egg) of a parent or in the developing fetus [10] [2]. In these cases, the affected individual has no family history of the disorder, but they subsequently have a 50% chance of passing the mutation to their offspring [2].
Pseudodominance in AR Disorders: This phenomenon occurs when an individual with an autosomal recessive disorder (homozygous) has a child with a carrier (heterozygous). Their offspring have a 50% chance of being affected, creating a pattern that mimics dominant inheritance (vertical transmission) within a single generation of a pedigree that otherwise shows recessive characteristics [15].
Research Methodologies and Experimental Protocols
Accurate identification and characterization of inheritance patterns require a combination of classical and molecular techniques.
Pedigree Analysis and Interpretation
The initial and crucial step in determining a mode of inheritance is the construction and analysis of a detailed family pedigree.
Table 2: Key "Research Reagent Solutions" for Genetic Studies
| Research Reagent / Material | Primary Function in Inheritance Pattern Research |
|---|---|
| PCR Reagents | Amplifies specific DNA regions of interest for subsequent analysis like sequencing [105]. |
| Sanger Sequencing Kits | The gold standard for validating mutations and identifying specific nucleotide changes in candidate genes. |
| Next-Generation Sequencing (NGS) Panels | Allows simultaneous screening of multiple genes associated with a phenotypic spectrum (e.g., cardiomyopathy panels). |
| Whole Exome/Genome Sequencing | Hypothesis-free approach to identify novel pathogenic variants in affected individuals, particularly in sporadic or atypical cases. |
| Cryo-Electron Microscopy (Cryo-EM) | Visualizes the 3D structure of proteins, elucidating the molecular pathophysiology of mutations, as in the PKD2 ion channel study [105]. |
| Cell Lines (e.g., Patient Fibroblasts, IPSCs) | Provides a model for in vitro functional studies of protein trafficking, ion channel function, and gene expression. |
Protocol 1: Standardized Pedigree Construction and Analysis
- Data Collection: Gather comprehensive medical and family history across at least three generations. Record the health status, age/age of onset, and cause of death for all relatives.
- Symbolization: Use standard pedigree symbols: squares for males, circles for females, shaded shapes for affected individuals, and a dot within a shape for carriers (particularly relevant for AR disorders).
- Pattern Identification:
- For suspected AD: Look for vertical transmission, male-to-male transmission, and approximately 50% of offspring affected when one parent is affected.
- For suspected AR: Identify horizontal clusters of affected individuals within one sibship, with unaffected parents. Note any consanguinity between parents.
- Confounding Factor Assessment: Evaluate for reduced penetrance (an unaffected individual with an affected offspring) and variable expressivity (differing severity among affected relatives) in AD. Assess for pseudodominance in AR.
Molecular Genetic Testing Protocols
Confirming a suspected inheritance pattern requires identifying the pathogenic variant(s) at the DNA level.
Protocol 2: Targeted Genetic Testing for a Known Familial Variant
- DNA Extraction: Isolate genomic DNA from a patient's sample, typically peripheral blood leukocytes or saliva.
- PCR Amplification: Design primers flanking the known familial mutation. Perform PCR to amplify the specific genomic region.
- Variant Detection: Utilize Sanger sequencing to sequence the PCR amplicon. Compare the chromatogram to a reference genome sequence to confirm the presence or absence of the specific mutation.
- Segregation Analysis: Test other family members to confirm the variant co-segregates with the disease phenotype, fulfilling the expected inheritance pattern.
Protocol 3: Exome Sequencing for Novel Gene Discovery in Atypical Cases
- Sample Selection: Identify a proband (index case) and select family members (e.g., affected siblings, unaffected parents) for trio-based analysis to identify de novo or inherited variants.
- Library Preparation & Sequencing: Fragment genomic DNA, capture the exonic regions, and perform high-throughput sequencing on an NGS platform.
- Bioinformatic Analysis: Align sequences to a reference genome, call variants (SNVs, Indels), and filter against population databases to remove common polymorphisms.
- Variant Prioritization:
- For AR models: Filter for rare, protein-altering variants that are homozygous or compound heterozygous in the affected individual and present in a heterozygous state in the unaffected parents.
- For AD models: Filter for rare, protein-altering heterozygous variants not found in the unaffected parents (de novo) or shared among affected relatives in a dominant pattern.
The following diagram illustrates the logical workflow for genetic analysis, from pedigree assessment to molecular confirmation.
Clinical and Therapeutic Implications in Research and Drug Development
Representative Disorders and Associated Molecular Pathways
Table 3: Examples of Autosomal Dominant and Recessive Disorders
| Disorder | Inheritance | Gene(s) | Salient Pathophysiological Features |
|---|---|---|---|
| Marfan Syndrome [2] | Dominant | FBN1 | Defective fibrillin-1 in extracellular matrix, leading to connective tissue defects in skeleton, eyes, and aorta. |
| Neurofibromatosis Type 1 [10] | Dominant | NF1 | Loss of neurofibromin, a tumor suppressor, leading to benign neurofibromas and other tumors. |
| Autosomal Dominant Polycystic Kidney Disease (ADPKD) [10] [105] | Dominant | PKD1, PKD2 | Dysfunction of polycystin-1 and -2 in renal cilia, leading to abnormal cell proliferation and cyst formation. |
| Familial Hypercholesterolemia [10] | Dominant | LDLR, APOB, PCSK9 | Impaired LDL receptor function, causing severely elevated serum cholesterol and premature coronary artery disease. |
| Cystic Fibrosis [15] [103] | Recessive | CFTR | Defective chloride channel causes thick mucus in lungs, pancreatic insufficiency, and male infertility. |
| Sickle Cell Disease [15] [103] | Recessive | HBB | Polymerization of abnormal hemoglobin S leads to sickle-shaped red blood cells, hemolysis, and vaso-occlusion. |
| Tay-Sachs Disease [15] [103] | Recessive | HEXA | Deficiency of hexosaminidase A causes accumulation of GM2 ganglioside in neurons, leading to neurodegeneration. |
Insights from a Current Research Model: ADPKD
Recent research on Autosomal Dominant Polycystic Kidney Disease (ADPKD) provides a powerful model of how understanding inheritance and molecular mechanism informs targeted therapy. ADPKD is caused by mutations in PKD1 or PKD2, with the latter encoding an ion channel (PKD2) localized to the primary cilia of kidney cells [105].
A 2025 study by DeCaen et al. used a multi-modal approach—including direct cilia electrophysiology, cryo-EM, and super-resolution imaging—to characterize specific PKD2 missense mutations [105]. They found that different mutations in the same structural domain (the pore helix) caused distinct functional defects: some (e.g., F629S, R638C) impaired ion conduction, while another (C632R) caused complete protein misfolding and trafficking defects [105]. This research directly informs drug development: patients with misfolding mutations might benefit from "corrector" molecules that restore proper protein folding, whereas those with conduction defects might require "modulator" molecules to reinstate channel function [105]. This exemplifies genotype-driven therapeutic strategy in a dominant disorder.
The experimental workflow for such a detailed molecular investigation is complex and integrative, as shown below.
Implications for Drug Development
The inheritance pattern of a disease directly impacts therapeutic strategy. For autosomal recessive disorders caused by loss-of-function (e.g., Cystic Fibrosis, Tay-Sachs), the goal is often to replace the missing protein or enzyme, or to use gene therapy to introduce a functional copy of the gene. In contrast, strategies for autosomal dominant disorders are more varied and must overcome the effects of the dominant mutant allele. These include:
- Inhibition of a Toxic Gain-of-Function: Using small molecules or monoclonal antibodies to neutralize a pathogenic protein.
- Suppression of the Mutant Allele: Utilizing techniques like RNA interference (RNAi) or antisense oligonucleotides (ASOs) to selectively degrade the mRNA transcribed from the mutant allele.
- Correcting Haploinsufficiency: Augmenting the function of the remaining wild-type allele.
- Gene Editing: Using technologies like CRISPR/Cas9 to directly correct the pathogenic variant in the genome, a strategy that could theoretically be applied to both dominant and recessive disorders.
The distinction between autosomal dominant and recessive inheritance is a fundamental paradigm in genetics with profound implications for basic research and clinical application. While the patterns are defined by classic Mendelian principles, their modern interpretation requires an integrated understanding of molecular mechanisms, pedigree analysis, and advanced genomic technologies. For drug development professionals, this knowledge is the bedrock upon which rational, targeted therapies are built. The ongoing elucidation of specific molecular pathologies, as exemplified by recent research in ADPKD, continues to refine our understanding and opens new avenues for precise, mechanism-based interventions for both dominant and recessive genetic disorders.
The accurate prediction of whether a genetic disorder follows an autosomal dominant or recessive inheritance pattern is a cornerstone of clinical genetics, with profound implications for diagnosis, prognostic assessment, and family genetic counseling. While traditional pedigree analysis remains a fundamental tool, the growing availability of genomic sequencing data now enables a more nuanced approach: identifying molecular signatures at the gene and variant level that are intrinsically predictive of inheritance mode. Framed within a broader thesis on autosomal inheritance patterns research, this technical guide delineates the characteristic features that differentiate dominant from recessive disease genes. It further provides validated experimental frameworks for confirming both the pathogenicity of variants and the proposed biological mechanisms underpinning their inheritance patterns. For clinical geneticists and drug development scientists, mastering these molecular signatures is essential for interpreting variants of uncertain significance, understanding disease pathogenesis, and selecting appropriate cellular and animal models for therapeutic development.
The clinical presentation of genetic disorders is directly governed by their underlying molecular inheritance pattern. Autosomal dominant (AD) disorders typically manifest when a single mutated allele exerts a pathological effect, either through haploinsufficiency (where one functional copy of a gene is insufficient) or a dominant-negative mechanism (where the mutant gene product disrupts the function of the wild-type product). In contrast, autosomal recessive (AR) disorders require biallelic loss-of-function, where both gene copies are compromised, often leading to a complete loss of a specific biochemical function [106] [69]. These fundamental biological differences are reflected in discrete, measurable characteristics at the DNA, protein, and functional levels.
Molecular Signatures Differentiating Dominant and Recessive Disorders
The inheritance pattern of a monogenic disorder is not arbitrary but is determined by the functional nature of the gene product and the specific mutational mechanisms involved. The table below summarizes the key molecular characteristics that serve as predictive biomarkers for each inheritance pattern.
Table 1: Molecular Signatures Predictive of Autosomal Dominant vs. Autosomal Recessive Inheritance
| Characteristic | Autosomal Dominant (AD) Disorders | Autosomal Recessive (AR) Disorders |
|---|---|---|
| Primary Molecular Mechanism | Haploinsufficiency or Dominant-Negative/Gain-of-Function [69] [107] | Biallelic Loss-of-Function [69] [107] |
| Variant Types | Frequently missense, splice-site, or in-frame indels that alter protein function; promotor mutations affecting expression [108] | Often nonsense, frameshift, canonical splice-site mutations leading to truncated proteins; some missense causing complete loss of function |
| Genotype-Phenotype Correlation | Often variable expressivity and/or reduced penetrance [107] | Typically more consistent, predictable phenotype |
| Tolerance to Heterozygote Loss | Intolerant (haploinsufficiency) or negatively affected by altered protein (dominant-negative) | Tolerant; single functional allele is sufficient for normal physiology |
| Example Genes/Conditions | KIF1A (neurodevelopmental disorders) [108], Huntington's Disease, Marfan Syndrome [109] | Cystic Fibrosis, Sickle Cell Anemia, Tay-Sachs Disease [109] |
Signature 1: Gene Dosage Sensitivity and Haploinsufficiency
A primary molecular signature of autosomal dominant inheritance is a high sensitivity to gene dosage. Genes where a 50% reduction in protein output (haploinsufficiency) leads to a pathological state are strong AD candidates. These are often genes encoding regulatory proteins, such as transcription factors or key signaling molecules, where precise expression levels are critical. In a clinical genetics setting, the observation of de novo heterozygous loss-of-function variants in multiple unrelated affected individuals is a powerful indicator of a haploinsufficient, dominant gene [108].
Signature 2: Dominant-Negative and Gain-of-Function Mechanisms
Many AD disorders are caused by variants where the mutant allele actively interferes with the function of the wild-type allele product (a dominant-negative effect) or confers a new, harmful function (a toxic gain-of-function). This is commonly observed in genes encoding subunits of multimetric complexes, such as structural proteins or receptors. For instance, a mutated polypeptide can incorporate into a complex and disrupt the function of the entire structure. The prevalence of heterozygous missense mutations in AD disorders, as seen in the KIF1A gene where specific substitutions (e.g., p.T99M, p.G109V) disrupt protein stability and function, is a classic signature of this mechanism [108].
Signature 3: Biallelic Inactivation in Recessive Disorders
Autosomal recessive disorders are characterized by the requirement for biallelic inactivation. The molecular signature is the presence of two loss-of-function variants (e.g., nonsense, frameshift, splice-site) in trans. These genes are typically tolerant to heterozygote loss; carriers with one functional allele are asymptomatic because the 50% protein level produced is sufficient for normal cellular function. The condition only manifests when both alleles are compromised, leading to a complete or near-complete absence of functional protein, as seen in enzymatic deficiencies like Tay-Sachs disease [109] [107].
The following diagram illustrates the logical decision process for validating the inheritance pattern of a gene based on genetic and functional evidence.
Experimental Protocols for Validating Inheritance Patterns
Predictive molecular signatures derived from genomic data require functional validation to confirm pathogenicity and elucidate biological mechanism. The following section details key experimental workflows.
Protocol 1: Validating Variant Pathogenicity and de novo Origin
Objective: To confirm that an identified sequence variant is a de novo mutation and to assess its impact on protein function and stability. This is a critical first step in analyzing candidate dominant disorders [108].
Materials & Workflow:
- Proband Identification & Trio Sequencing: Identify an affected individual (proband) and perform Whole Exome Sequencing (WES) or Whole Genome Sequencing (WGS) on the proband and both biological parents.
- Variant Calling & Filtering: Use bioinformatics pipelines (e.g., NextGENe, TGex) to call variants against a reference genome (e.g., GRCh37/38). Filter for rare, protein-altering variants not present in population frequency databases (e.g., gnomAD).
- Sanger Sequencing Validation: Design primers flanking the candidate variant. Amplify the target region via PCR from proband and parental DNA. Sequence the products on a platform like an ABI 3500 sequencer to confirm the variant and its de novo status.
- In silico Pathogenicity Prediction:
- Missense Variants: Use tools like REVEL to aggregate scores from multiple prediction algorithms.
- Splice Variants: Use SpliceAI to predict the impact on splicing.
- Protein Stability: Utilize mCSM, SAAFEC-SEQ, or MUpro to compute the change in Gibbs free energy (ΔΔG), predicting the effect of the variant on protein folding stability.
- 3D Protein Modeling: For missense variants, use the wild-type protein structure from the PDB database (e.g., 2ZFI for KIF1A). Model the mutant structure using SwissModel and visualize with PyMOL to analyze disruptions to hydrogen bonding, van der Waals forces, or salt bridges [108].
Table 2: Research Reagent Solutions for Genetic Analysis
| Reagent / Tool | Function / Application |
|---|---|
| SureSelect XT Human All Exon V6 Kit (Agilent) | Library preparation and exome capture for WES [108] |
| NovaSeq 6000 System (Illumina) | High-throughput sequencing [108] |
| ABI 3500 Genetic Analyzer | Capillary electrophoresis for Sanger sequencing validation [108] |
| PDB Database | Repository for 3D structural data of proteins for modeling [108] |
| PyMOL Molecular Visualization System | Software for visualizing and analyzing protein structures [108] |
Protocol 2: Functional Assays for Haploinsufficiency vs. Dominant-Negative Effects
Objective: To distinguish whether a dominant disorder arises from haploinsufficiency (loss-of-function) or a dominant-negative (alteration-of-function) mechanism.
Materials & Workflow:
- Expression Constructs: Clone the wild-type (WT) and mutant (MUT) cDNA sequences into mammalian expression vectors.
- Cell Line Models: Use a relevant cell line (e.g., HEK293, patient-derived iPSCs, or neuronal cell lines for neurological disorders).
- Experimental Transfection Conditions:
- Condition A: Express WT allele only.
- Condition B: Express MUT allele only.
- Condition C: Co-express WT and MUT alleles (1:1 ratio) to mimic the heterozygous state.
- Condition D: Control (empty vector).
- Functional Readouts:
- For Haploinsufficiency: Condition B (MUT only) and Condition C (WT+MUT) will show a ~50% reduction in the measured function/protein activity compared to Condition A (WT only). The MUT allele is functionally null.
- For Dominant-Negative Effect: Condition C (WT+MUT) will show a greater than 50% reduction in function compared to Condition A. The MUT allele actively inhibits the WT allele. Condition B (MUT only) may also show no residual function.
- Protein Stability Assay: Treat transfected cells with cycloheximide to inhibit new protein synthesis. Harvest cells at time points (e.g., 0, 2, 4, 8 hours) and perform Western blotting to measure the half-life of the WT and MUT proteins. A significantly shortened half-life in the MUT protein supports a mechanism involving destabilization [108].
The experimental workflow for this functional characterization is outlined below.
The systematic validation of molecular signatures predictive of inheritance patterns moves medical genetics beyond correlative observation to a mechanistic understanding of disease. For researchers, this framework aids in the definitive classification of novel disease genes and variants. For drug development professionals, this knowledge is pivotal. Understanding whether a disorder stems from haploinsufficiency versus a dominant-negative mechanism directly informs therapeutic strategy. Haploinsufficiency may be addressed by gene replacement or upregulation of the healthy allele, while dominant-negative disorders may require allele-specific silencing followed by gene replacement. As genomic sequencing becomes ubiquitous, the integration of these molecular signatures with functional validation protocols will be essential for accelerating the development of targeted genetic therapies.
The strategic selection of therapeutic targets, specifically determining whether to activate or inhibit a target's activity, is a cornerstone of successful drug development. This decision, known as the Direction of Effect (DOE), is critically informed by the underlying genetic architecture of diseases, particularly the patterns of autosomal dominant and autosomal recessive inheritance. These inheritance patterns provide fundamental insights into the functional consequences of gene dosage and mutational mechanisms, which directly dictate the required pharmacological intervention. A target implicated by a loss-of-function mechanism in an autosomal recessive disorder will typically require therapeutic activation to restore function, whereas a target harboring a toxic gain-of-function mutation in an autosomal dominant disorder will likely necessitate inhibition.
The high failure rate in clinical drug development can often be traced to an incorrect understanding of this required DOE [3]. While human genetic evidence supporting gene-disease causality is associated with a 2.6-fold increase in drug development success, approaches to systematically predict the correct DOE have been lacking [3]. This whitepaper provides an in-depth analysis of the distinct molecular and functional characteristics that differentiate targets for activator versus inhibitor drugs, framed within the context of autosomal dominant and recessive inheritance patterns. It further delivers a technical guide for experimentally determining DOE and profiling target pharmacology, equipping researchers with the frameworks and tools to de-risk this critical aspect of therapeutic development.
Genetic Inheritance Patterns Inform Therapeutic Direction of Effect
The mode of inheritance provides a powerful initial heuristic for predicting the required direction of therapeutic effect. Autosomal dominant and recessive disorders arise from distinct mutational mechanisms that have direct implications for target modulation.
Autosomal Dominant Disorders
In autosomal dominant disorders, a single mutated allele is sufficient to cause disease, often through a gain-of-function (GOF) mechanism or haploinsufficiency. The enrichment of both activator and inhibitor mechanisms in dominant disorders reflects this dual etiology [3].
- GOF Mechanisms: Diseases caused by a toxic GOF mutation (e.g., many neurodegenerative disorders caused by protein aggregation) typically require inhibitor drugs to suppress the aberrant activity of the mutant protein.
- Haploinsufficiency Mechanisms: Diseases resulting from insufficient expression of a functional protein from a single wild-type allele (e.g., some metabolic disorders) may be treated with activator drugs to boost the activity of the remaining functional protein.
Autosomal Recessive Disorders
Autosomal recessive disorders require mutations in both alleles and are predominantly caused by loss-of-function (LOF) mechanisms. Consequently, these disorders are primarily candidates for therapeutic activation.
- LOF Mechanisms: The functional absence of a protein necessitates its restoration or enhancement. Therefore, autosomal recessive disorders are strongly enriched for activator drugs and depleted for inhibitor mechanisms [3]. Gene augmentation therapies, a form of activation, are a common strategy for recessive conditions, as seen in inherited retinal diseases [110].
Table 1: Inheritance Patterns and Associated Drug Mechanisms
| Inheritance Pattern | Primary Mutational Mechanism | Indicated Therapeutic Direction of Effect (DOE) | Observed Enrichment in Drug Targets |
|---|---|---|---|
| Autosomal Dominant | Gain-of-Function (GOF) / Haploinsufficiency | Inhibitor (for GOF) / Activator (for haploinsufficiency) | Enriched for both activator and inhibitor drugs [3] |
| Autosomal Recessive | Loss-of-Function (LOF) | Activator (to restore function) | Depleted for inhibitor mechanisms [3] |
Distinct Molecular Characteristics of Activator and Inhibitor Targets
Beyond inheritance patterns, activator and inhibitor drug targets exhibit distinct and quantifiable differences in their genetic, functional, and structural characteristics. A large-scale analysis of 2,533 druggable genes revealed systematic biases in their properties [3].
Genetic Constraint and Dosage Sensitivity
A counterintuitive but critical finding is that inhibitor targets display significantly greater intolerance to loss-of-function (LOF) variants (lower LOEUF scores) compared to activator targets [3]. This higher selective constraint suggests that these genes are more essential and that their inhibition is more likely to produce on-target adverse effects. This pattern is likely confounded by several factors:
- Many inhibitor targets are essential genes, such as those targeted by chemotherapies.
- Inhibitors can be used to treat GOF or overexpression-related phenotypes associated with these highly constrained genes.
- Consistent with this, constrained inhibitor targets are enriched for genes predicted to be triplosensitive (sensitive to increased dosage) [3].
Furthermore, inhibitor targets have higher predicted dosage sensitivity compared to activator targets, indicating a narrower therapeutic window for modulation [3].
Protein Localization and Class
The subcellular localization and protein class of a target are strong predictors of DOE.
- Membrane proteins, particularly G protein-coupled receptors (GPCRs), are significantly enriched for activator drugs [3]. GPCRs are naturally tuned to respond to exogenous ligands, making them ideal for agonist/activator development. In fact, approximately one-third of FDA-approved drugs target GPCRs [111].
- Intracellular enzymes, such as kinases, are more frequently targeted by inhibitors, which can block their catalytic activity.
Table 2: Molecular and Functional Characteristics of Drug Targets
| Characteristic | Activator Targets | Inhibitor Targets | Notes & Implications |
|---|---|---|---|
| LOF Intolerance (LOEUF) | Lower constraint | Higher constraint [3] | Inhibitor targets are more essential; higher potential for toxicity. |
| Dosage Sensitivity | Lower predictions | Higher predictions [3] | Inhibitor targets have a narrower therapeutic window. |
| Enriched Protein Class | G Protein-Coupled Receptors [3] | Kinases, Intracellular Enzymes | GPCRs are amenable to activation; enzymes are often inhibited. |
| Association with GOF Disease | Depleted | Enriched [3] | Supports use of inhibitors to counteract toxic GOF mechanisms. |
| Association with Recessive Disorders | Neutral | Depleted [3] | Recessive diseases from LOF are not treated by inhibition. |
Diagram 1: A logical workflow for inferring the Direction of Effect (DOE) for a therapeutic target by integrating evidence from genetic inheritance patterns, genetic constraint, and protein biochemistry.
Experimental and Computational Protocols for DOE Determination
A Framework for Genetics-Informed DOE Prediction
A robust computational framework for predicting DOE at the gene and gene-disease level incorporates multi-modal data [3]. The model leverages:
- Input Features:
- Tabular features (n=41): Genetic constraint (LOEUF), dosage sensitivity predictions, essentiality, mode of inheritance associations, and protein class.
- Embeddings: GenePT (256-dimensional embeddings of NCBI gene summaries) and ProtT5 (128-dimensional embeddings of amino acid sequences) to capture functional and structural information.
- Genetic Associations: For gene-disease models, an allelic series of genetic associations across the allele frequency spectrum (common, rare, ultrarare) is used to model dose-response relationships.
- Model Outputs:
- DOE-specific druggability for 19,450 protein-coding genes (Macro-AUROC: 0.95).
- Isolated DOE among 2,553 druggable genes (Macro-AUROC: 0.85).
- Gene-disease-specific DOE for 47,822 gene-disease pairs (Macro-AUROC: 0.59, improving with genetic evidence availability) [3].
High-Throughput Screening for Target-Deconvolution and DOE
For traditional medicines or compound libraries with unknown mechanisms, high-throughput screening (HTS) platforms can identify targets and DOE.
- Genome-wide pan-GPCR Platform: This platform systematically tests compounds against a library of human GPCRs to identify ligands and their direction of effect (agonist/antagonist) [111].
- Ligand Binding-Based Assays:
- Competitive Ligand-Binding Assay (CLBA): A classic method to quantify the interaction between a GPCR and a radiolabeled ligand by titrating with the molecule of interest. It determines binding affinity and can indicate whether a compound is a competitive antagonist [111].
- Scintillation Proximity Assay: A non-separation alternative to CLBA that relies on radioactive scintillation for signal detection [111].
- Functional Assays (Cell-Based):
- Second Messenger Assays: Measure downstream signaling outputs like cAMP, Ca²⁺, or IP3 accumulation to determine if a compound is an agonist (increases signaling) or antagonist (blocks native agonist signaling).
- Transcriptional Reporter Assays: Utilize engineered cells with a reporter gene (e.g., luciferase) under the control of a pathway-responsive promoter to assess functional activation or inhibition.
Diagram 2: An experimental workflow for deconvoluting the protein target and Direction of Effect (DOE) for bioactive compounds, such as those derived from traditional medicines, using a combination of high-throughput binding and functional assays.
The Scientist's Toolkit: Essential Research Reagents and Solutions
Table 3: Key Research Reagent Solutions for Target and DOE Profiling
| Reagent / Solution | Function / Application | Technical Notes |
|---|---|---|
| GPCR-Expressing Cell Lines | Engineered cell lines (e.g., CHO, HEK293) stably overexpressing a specific GPCR for functional assays. | Critical for isolating signal in HTS; allows study in a defined genetic background [111]. |
| Radiolabeled Ligands (e.g., [³H], [¹²⁵I]) | Tracer molecules for competitive ligand-binding assays (CLBA) to determine compound affinity (Ki). | Require specific handling and disposal due to radioactivity; non-radioactive alternatives (e.g., fluorescent) are emerging [111]. |
| Fluorescent Dyes for Ca²⁺ / cAMP | Cell-permeable dyes or biosensors to quantify intracellular second messenger levels in real-time. | Enables kinetic readouts of GPCR activation/inhibition; compatible with HTS formats. |
| Transcriptional Reporter Systems | Engineered cells with a reporter gene (Luciferase, GFP) under a response element (e.g., CRE, SRE). | Provides an amplified, sensitive readout of pathway activity downstream of target engagement. |
| GenePT & ProtT5 Embeddings | Pre-computed numerical representations of gene function and protein structure from AI models. | Used as input features for machine learning models predicting druggability and DOE [3]. |
| AAV/Lentiviral Vectors | Viral vectors for delivering genetic material (e.g., wild-type genes for augmentation, shRNA for knockdown). | Used in vitro and in vivo to validate target biology and therapeutic DOE via gene manipulation [110]. |
The strategic differentiation between activator and inhibitor targets is a critical determinant of clinical success in drug development. This profile is deeply rooted in the genetic etiology of disease, with autosomal dominant and recessive inheritance patterns providing a foundational framework for hypothesis generation. The integration of computational predictions, based on genetic constraint, protein class, and advanced AI-powered embeddings, with rigorous experimental validation through high-throughput screening and functional assays, provides a powerful, multi-faceted approach to de-risking the critical decision of Direction of Effect. As the field advances, particularly with the growth of AI in drug discovery [112] and the systematic exploration of challenging target classes like intrinsically disordered proteins [113] and GPCRs [111], a refined understanding of these differential enrichment profiles will accelerate the development of precision therapies tailored to the underlying genetic dysfunction.
Clinical validation is the critical process of establishing that a genetic variant or biomarker consistently and reliably predicts a specific clinical phenotype. In the context of monogenic disorders, this process is fundamentally intertwined with the understanding of autosomal dominant (AD) and autosomal recessive (AR) inheritance patterns. Autosomal dominant inheritance often arises through haploinsufficiency, dominant-negative, or gain-of-function (GoF) effects, where a single mutated allele is sufficient to cause disease. In contrast, autosomal recessive inheritance typically results from a complete loss-of-function (LoF) requiring biallelic mutations [12].
The growing discovery of genes that exhibit both AD and AR inheritance patterns ("AD/AR genes") for different sets of variants or even for the same variant, depending on genetic context, presents a significant challenge for clinical validation. These genes possess distinctive bioinformatic properties, including intermediate constraint scores, a greater average number of exons, and an elevated propensity to form homomeric or heteromeric proteins [12]. This whitepaper explores the framework for clinical validation through case studies primarily in neurodevelopmental disorders (NDDs), leveraging recent genetic discoveries and advanced computational approaches to illustrate the evolving landscape of diagnostic rigor.
Genetic Discovery and Inheritance Patterns in NDDs
The Evolving Spectrum of Neurodevelopmental Disorder Genes
Neurodevelopmental disorders represent a genetically heterogeneous group of conditions affecting brain development and function. Recent research has dramatically expanded the known genetic landscape of NDDs, moving beyond traditional protein-coding genes to include non-coding regions and complex inheritance patterns.
Table 1: Key Genetic Discoveries in Neurodevelopmental Disorders
| Gene/Discovery | Inheritance Pattern | Key Phenotypic Features | Prevalence Estimate | Biological Mechanism |
|---|---|---|---|---|
| RNU4-2 [114] | Monallelic (AD) | Intellectual disability, autism spectrum disorder, motor disorders | One of the most common monogenic NDDs | Non-coding snRNA gene; spontaneous mutations affecting splicing |
| RNU2-2 [114] | Monallelic (AD) | Severe NDD with prominent epilepsy | ~20% that of RNU4-2 | Non-coding snRNA gene; spontaneous mutations |
| AD/AR Genes [12] | Dual inheritance | Phenotypes vary by mechanism | Subset of all genetic disorders | Haploinsufficiency (AD) vs. complete LoF (AR); unique gene properties |
Machine Learning Approaches for Inheritance-Specific Gene Prediction
The identification of NDD risk genes has been accelerated through sophisticated computational approaches. Dhindsa et al. (2025) developed a semi-supervised machine learning framework (mantis-ml) that integrates single-cell RNA sequencing data with 300 orthogonal features, including genetic intolerance metrics and protein-protein interaction data, to train inheritance-specific models for NDDs [32] [62].
These models demonstrate high predictive power with area under the receiver operator curves (AUCs) of 0.84-0.95. Notably, genes ranking in the top decile were 45 to 180 times more likely to have literature support than those in the bottom decile. The research revealed fundamental differences in gene expression patterns between monoallelic and biallelic inheritance patterns in the developing human cortex, providing biological validation for the computational predictions [32].
Diagram 1: Machine learning workflow for NDD gene discovery. The mantis-ml framework integrates multiple data types to train inheritance-specific models that significantly enrich for genuine NDD risk genes.
Experimental Protocol: Inheritance-Specific Gene Discovery
Methodology for Genome-Wide Prediction of NDD-Associated Genes [32] [62]
Data Curation and Feature Engineering
- Collect and harmonize 300+ features including:
- Single-cell RNA sequencing data from developing human cortex
- Genic intolerance metrics (e.g., pLI, LOEUF)
- Protein-protein interaction network data
- Evolutionary conservation scores
- Gene ontology and pathway annotations
- Collect and harmonize 300+ features including:
Model Training and Validation
- Implement semi-supervised learning using mantis-ml framework
- Train separate models for monoallelic (dominant) and bi-allelic (recessive) inheritance patterns
- Validate models using 10-fold cross-validation
- Calculate performance metrics (AUC, precision-recall)
Gene Prioritization and Biological Interpretation
- Rank genes by predicted pathogenicity score
- Perform enrichment analysis for top-decile genes
- Validate predictions against existing literature and clinical databases
Clinical Validation Frameworks and Case Studies
Early Recognition and Red Flag Identification
The clinical validation of NDDs begins with early recognition of warning signs. A systematic review of 54 studies identified consistent early markers across developmental domains [115]:
- Motor Domain: Delay to sit (≥9 months), absence of independent walking (18 months), absence of pincer grasp (10 months), and asymmetrical motor patterns (12 months)
- Language Domain: Absence of babbling at 9-12 months, lack of words until 15-18 months, and absence of two-word combinations by 24 months
- Social Domain: Absence of social smile, poor eye contact, deficits in shared attention, and lack of communicative gestures
Standardized instruments such as M-CHAT-R/F (for autism), ASQ (Ages and Stages Questionnaire), Bayley Scales, and HINE (Hammersmith Infant Neurological Examination) significantly increase the accuracy of early screening and reduce referral delays [115].
Clinical Validation Through Multi-Omics Integration
The comprehensive clinical validation of autosomal recessive Parkinson's disease (PD) genes exemplifies a modern multi-platform approach. Zhao et al. (2025) investigated 162 AR-PD families using:
- Next-Generation Sequencing (NGS) and homozygous mapping to identify candidate regions
- Whole-exome sequencing (WES) for variant discovery across 25 core families
- Long-read sequencing (LRS) to detect structural variants in 38 families
- Population-based prioritization using the GenoPriori-WeightSchem approach
- Independent replication in 3,947 PD cases from in-house WGS data and 3,100 cases from UK Biobank [116]
This integrated methodology identified eight promising candidate genes (ROBO1, LMBR1L, SORL1, COL24A1, and others) that expand the autosomal recessive gene spectrum for Parkinson's disease, demonstrating how clinical validation requires concordance across multiple analytical platforms and independent cohorts [116].
Table 2: Comparison of Genetic Validation Approaches Across Disorders
| Validation Metric | Neurodevelopmental Disorders | Parkinson's Disease (AR) | Alzheimer's (ADAD) |
|---|---|---|---|
| Primary Technologies | WES, WGS, scRNA-seq, machine learning | NGS, WES, LRS, homozygous mapping | WES, biomarker studies, longitudinal imaging |
| Sample Size Considerations | Large cohorts (10,000+ individuals) | Multi-family studies (162 families) | Multi-generational families (DIAN network) |
| Key Analytical Challenges | Incomplete penetrance, dual inheritance patterns | Locus heterogeneity, structural variants | Age-dependent penetrance, resilience factors |
| Clinical Translation Timeline | 2-5 years from discovery to clinical testing | 3-6 years for diagnostic inclusion | 5-10 years for predictive testing |
Diagram 2: Clinical validation pathway incorporating inheritance pattern analysis. The interpretation of genetic findings and subsequent validation strategies differ significantly based on the established or suspected inheritance pattern of the causative gene.
The Scientist's Toolkit: Essential Research Reagents
Table 3: Key Research Reagent Solutions for Clinical Validation Studies
| Reagent/Resource | Primary Function | Application Examples |
|---|---|---|
| Whole-Genome Sequencing (WGS) | Comprehensive variant detection across entire genome | Discovery of non-coding variants in RNU4-2/RNU2-2 [114] |
| Long-Read Sequencing (LRS) | Detection of structural variants and complex genomic rearrangements | Identification of 6.3 kb deletion in COL24A1 in AR-PD [116] |
| Single-Cell RNA Sequencing (scRNA-seq) | Cell-type specific expression profiling in developing brain | Differentiation of monoallelic vs. biallelic gene expression patterns [32] |
| Machine Learning Frameworks (e.g., mantis-ml) | Integration of multi-omics data for gene prioritization | Inheritance-specific prediction of NDD risk genes [32] [62] |
| Population Biobanks (e.g., UK Biobank) | Control frequencies and association replication | Validation of novel AR-PD genes in 3,100 cases [116] |
| International Consortia (e.g., DIAN) | Longitudinal data collection on rare familial disorders | Study of ADAD natural history and resilience factors [117] [118] |
The clinical validation of genetic findings requires careful consideration of inheritance patterns, as exemplified by the growing recognition of genes with dual AD/AR inheritance. The discovery of non-coding genes like RNU4-2 and RNU2-2 as causes of relatively common NDDs further expands the complexity of clinical validation, requiring updated diagnostic approaches that look beyond traditional exome sequencing [114]. These advances, coupled with machine learning frameworks that can predict inheritance-specific pathogenicity, are transforming the landscape of clinical genetics.
As research continues, clinical validation frameworks must evolve to incorporate multi-omics data, consider the possibility of dual inheritance patterns for individual genes, and account for protective genetic factors that may modify disease expression. The case of Doug Whitney, who escaped symptom onset despite carrying an ADAD mutation with nearly 100% penetrance, highlights the importance of investigating genetic resilience as part of comprehensive clinical validation [118]. Through the integration of these diverse approaches, clinical validation will continue to advance, providing more accurate diagnoses and personalized prognostic information for patients and families affected by genetic disorders.
The foundation of clinical genetics rests upon understanding inheritance patterns, such as autosomal dominant and autosomal recessive transmission, which dictate how genetic diseases propagate through families [71]. An autosomal dominant disorder occurs when a single pathogenic variant from one parent is sufficient to cause disease, presenting a 50% transmission risk to offspring. In contrast, autosomal recessive diseases require pathogenic variants in both alleles of a gene, typically resulting in a 25% disease risk for children of carrier parents [71]. These patterns not only inform diagnostic pathways but also provide the foundational logic for leveraging human genetic variation in therapeutic development.
Increasingly, geneticists recognize that these classical inheritance patterns represent endpoints on a spectrum of gene-disease relationships. Many genes exhibit allelic series—collections of variants where increasingly deleterious mutations lead to progressively severe phenotypic effects [119]. This dose-response relationship between gene functionality and phenotypic severity provides a powerful framework for therapeutic target identification. If natural genetic variation produces graded phenotypic effects, then pharmacological modulation of the gene product may achieve similarly predictable, dose-dependent therapeutic outcomes [119] [3]. This review presents a comprehensive technical framework for identifying allelic series and translating these natural genetic experiments into validated therapeutic directions, with particular emphasis on the context of autosomal dominant and recessive inheritance patterns.
Genetic Inheritance Foundations: From Mendelian Patterns to Dose-Response Relationships
Classical Inheritance Patterns and Their Molecular Basis
The five primary modes of genetic inheritance each imply distinct relationships between gene dosage and phenotypic expression, with direct relevance for therapeutic targeting strategies [71]:
- Autosomal Dominant: Haploinsufficiency (where a single functional copy is insufficient) or dominant-negative mechanisms (where the mutant protein disrupts the function of the wild-type protein) often underlie these disorders. Examples include dilated cardiomyopathy caused by pathogenic variants in LMNA [71].
- Autosomal Recessive: Typically caused by loss-of-function variants requiring biallelic inactivation, as seen in hypertrophic cardiomyopathy caused by pathogenic variants in ALPK3 [71].
- X-linked: Patterns differ by sex due to X-chromosome inheritance. X-linked dominant disorders (e.g., Danon disease) affect both males and females, while X-linked recessive disorders (e.g., muscular dystrophy) primarily affect males [71].
- Mitochondrial: Exhibits maternal inheritance with phenotypic expression dependent on heteroplasmy levels (the percentage of mutant mitochondrial DNA) [71].
Table 1: Classical Inheritance Patterns and Therapeutic Implications
| Inheritance Pattern | Molecular Mechanism | Variant Impact | Therapeutic Approach |
|---|---|---|---|
| Autosomal Dominant | Haploinsufficiency, dominant-negative | Reduced protein function or toxic gain | Protein restoration, mutant silencing |
| Autosomal Recessive | Complete loss-of-function | Absent or non-functional protein | Gene replacement, enzyme replacement |
| X-linked | Varies by gene and sex | Partial to complete loss depending on lyonization | Gene supplementation, protein therapy |
| Mitochondrial | Oxidative phosphorylation defect | Energy deficiency | Metabolic bypass, heteroplasmy shifting |
Beyond Mendelian Patterns: Incomplete Penetrance and Variable Expressivity
While inheritance patterns provide diagnostic guidance, several non-Mendelian complexities impact clinical expression and therapeutic development. Incomplete penetrance occurs when not all individuals with a pathogenic variant develop the disease, while variable expressivity describes differences in disease severity among affected individuals with the same variant [71]. These phenomena likely result from combinations of genetic predisposition, environmental factors, disease modifiers, and comorbidities [71]. Additionally, pleiotropy—where a single variant causes multiple seemingly unrelated diseases—further complicates genotype-phenotype relationships [71].
These complexities highlight the limitations of binary classifications of variant effects and underscore the need for frameworks that capture graded relationships between genetic variation and phenotypic outcomes.
Allelic Series: Conceptual Framework and Detection Methodologies
Defining Allelic Series in a Therapeutic Context
An allelic series refers specifically to "a collection of variants wherein increasingly deleterious mutations have increasingly large phenotypic effects" [119]. From a therapeutic development perspective, genes demonstrating allelic series are particularly compelling targets because they provide natural human evidence of a dose-response relationship between gene function and phenotype [119] [3]. This relationship substantially de-risks drug development by providing genetic validation that pharmacological modulation of the target will likely produce clinically meaningful effects.
Seminal examples demonstrate the power of this approach. The discovery of an allelic series in PCSK9, where loss-of-function variants associated with reduced LDL cholesterol and coronary artery disease risk, validated PCSK9 inhibition as a therapeutic strategy for cardiovascular risk reduction [119]. Similarly, an allelic series in TYK2 informed the development of deucravacitinib, a selective inhibitor for psoriasis treatment [119].
The COAST Framework: Technical Methodology
The Coding-Variant Allelic-Series Test (COAST) represents a specialized rare-variant association test specifically designed to identify genes containing allelic series [119]. Unlike general gene-based association tests, COAST incorporates variant functional annotations to test specifically for monotonic increases in phenotypic effect with increasing variant severity.
COAST Statistical Framework
COAST builds upon established rare-variant association tests—specifically burden tests and sequence kernel association tests (SKAT)—but incorporates allelic-series weights to prioritize genes where effect sizes increase with variant severity [119]. The method operates on three classes of coding variants as annotated by the Ensembl Variant Effect Predictor (VEP):
- Benign Missense Variants (BMVs)
- Deleterious Missense Variants (DMVs)
- Protein-Truncating Variants (PTVs)
For a given subject, let ( Nl ) count the total number of category ( l ) alleles present in the gene: [ Nl = \sum{j=1}^J I(Aj = l) Gj ] where ( Aj ) represents the functional category of variant ( j ), and ( G_j ) represents the additively coded genotype [119].
COAST defines a variety of association models targeting different genetic architectures and aggregates these into an omnibus test. Through extensive simulations, COAST maintains appropriate type I error rates while improving power to detect allelic series compared to existing methods like SKAT-O [119]. The COAST framework has been extended to work with summary statistics (COAST-SS), enabling application to large-scale meta-analyzed cohorts of up to 840,000 subjects [120].
Experimental Workflow for Allelic Series Detection
Diagram 1: Experimental workflow for allelic series identification, spanning from sample collection to therapeutic direction prediction.
Research Reagent Solutions for Allelic Series Studies
Table 2: Essential Research Reagents and Resources for Allelic Series Investigation
| Resource Category | Specific Examples | Function in Allelic Series Research |
|---|---|---|
| Variant Annotation | Ensembl VEP [119], ClinVar [121] | Functional consequence prediction, clinical interpretation |
| Genomic Databases | UK Biobank [119], gnomAD, PharmGKB [122] | Population frequency data, phenotype correlations, drug response annotations |
| Statistical Packages | COAST R Package [119] [120], STAAR [119] | Specialized rare-variant association testing |
| Gene-Disease Resources | ClinGen [121], GWAS Catalog [119] | Gene-disease validity assessments, common variant associations |
| Druggability Predictors | DrugnomeAI [3], GPS [3] | Target prioritization, direction-of-effect prediction |
Translating Allelic Series to Therapeutic Direction
Predicting Direction of Effect (DOE) for Therapeutic Modulation
Determining the correct direction of effect—whether to activate or inhibit a target—represents a critical challenge in therapeutic development [3]. Genes demonstrating allelic series provide natural human experiments that inform DOE decisions. For example, if loss-of-function variants are associated with reduced disease risk, this suggests that pharmacological inhibition may be therapeutic. Conversely, if gain-of-function variants associate with reduced risk, activation may be indicated [3].
Recent computational frameworks integrate genetic associations across the allele frequency spectrum with gene and protein embeddings to predict DOE at both gene and gene-disease levels [3]. These models demonstrate that activator and inhibitor drug targets have distinct characteristics:
- Inhibitor targets show greater intolerance to loss-of-function variation (lower LOEUF scores)
- Activator targets are enriched among specific protein classes like G protein-coupled receptors
- Genes involved in autosomal dominant disorders are enriched for both activator and inhibitor mechanisms
- Genes involved in autosomal recessive disorders are depleted of inhibitor mechanisms [3]
Diagram 2: Logical framework for deriving therapeutic direction from allelic series data, showing how different genetic evidence types inform specific therapeutic decisions.
Integration with Inheritance Pattern Knowledge
Inheritance patterns provide crucial contextual information for interpreting allelic series and predicting therapeutic direction. Autosomal dominant disorders frequently arise from haploinsufficiency or gain-of-function mechanisms, suggesting different therapeutic approaches based on the underlying molecular pathology [71] [3]. In haploinsufficiency, increasing activity from the remaining allele may be beneficial, while gain-of-function mechanisms typically require inhibition or silencing of the mutant allele.
In contrast, autosomal recessive disorders typically result from complete loss-of-function, suggesting gene replacement or protein supplementation as potentially beneficial strategies [71]. The allelic series concept extends beyond these binary classifications to capture continuous relationships between gene dosage and phenotype, enabling more nuanced therapeutic predictions.
Validation and Evidence Framework
Evidence Hierarchies for Genetic Test Validation
The evidence base for genetic findings, including allelic series associations, must be evaluated across multiple domains [121]:
- Analytic validity: Accuracy in detecting true genetic variation
- Clinical validity: Ability to accurately predict phenotype
- Clinical utility: Ability to improve patient outcomes
For allelic series specifically, clinical validity is supported by demonstration of a dose-response relationship between variant severity and phenotypic effect, while clinical utility requires evidence that targeting the gene leads to therapeutic benefit [121] [3].
Quantitative Assessment of Allelic Series Associations
Table 3: Performance Metrics for Allelic Series Detection Methods
| Method | Genetic Architecture | Power Advantage | Limitations |
|---|---|---|---|
| COAST | Monotonic effect increase with variant severity | 29% more lipid trait associations vs SKAT-O [119] | Requires individual-level data |
| COAST-SS | Works from summary statistics | Equivalent to COAST with correct LD [120] | LD misspecification affects power |
| SKAT-O | Mixed directional effects | Robust to non-monotonic effects | Lower power for allelic series [119] |
| Burden Test | Consistent direction effects | High power when assumptions met | Sensitive to inclusion of non-causal variants [119] |
The integration of classical inheritance pattern knowledge with modern allelic series detection frameworks represents a powerful approach for therapeutic target identification and validation. By recognizing that genes exist not as binary functional units but as loci with quantifiable dose-response relationships to phenotype, researchers can more accurately predict which targets will respond to pharmacological modulation and in which direction.
Future developments in this field will likely include:
- Expanded integration of multi-omics data to refine variant functional impact predictions
- Improved representation of diverse ancestral backgrounds in allelic series studies [122]
- Development of dynamic models capturing how allelic series effects vary across tissue types and developmental stages
- Direct incorporation of allelic series evidence into drug development decision pipelines
As genetic datasets continue to expand in both size and diversity, the allelic series framework will play an increasingly central role in translating human genetic evidence into successful therapeutic strategies across the spectrum of autosomal dominant, recessive, and complex diseases.
The genetic architecture of a disease, particularly its mode of inheritance, provides fundamental insights for therapeutic development. Autosomal dominant (AD) and autosomal recessive (AR) disorders originate from distinct molecular mechanisms—typically haploinsufficiency, dominant-negative, or gain-of-function (GOF) effects in AD disorders versus complete loss-of-function (LOF) in AR disorders. These underlying mechanisms directly influence a target's "druggability," defined as the ability to modulate a target with a therapeutic compound to elicit a clinical effect [123] [12]. Understanding this relationship is crucial for selecting viable drug targets and determining the correct direction of effect (DOE)—whether to activate or inhibit the target—early in the drug development process [123].
Despite human genetic evidence supporting a 2.6-fold increase in drug development success, a systematic framework for leveraging inheritance patterns to predict druggability and DOE has been lacking [123]. This review integrates recent advances in genetics and bioinformatics to establish how autosomal dominant versus recessive inheritance patterns can inform therapeutic strategy, experimental design, and candidate prioritization.
Molecular Mechanisms and Inheritance Patterns
Genetic Foundations of Inheritance
Monogenic disorders follow specific inheritance patterns based on the nature and dosage of the pathogenic variant. Autosomal dominant (AD) disorders manifest when a single mutated allele is sufficient to cause disease. This occurs through several distinct mechanisms:
- Haploinsufficiency: Where a 50% reduction in protein production is insufficient to maintain normal function [12].
- Dominant-Negative Effect: Where the mutant protein product disrupts the function of the wild-type protein produced by the healthy allele [12].
- Gain-of-Function (GOF): Where the mutant protein acquires a new, often toxic, function [12].
In contrast, autosomal recessive (AR) disorders require pathogenic variants in both alleles of a gene. The disease manifests due to a complete or near-complete loss of protein function, as seen in conditions like cystic fibrosis and many inherited retinal dystrophies [71] [124].
A subset of genes demonstrates dual AD/AR inheritance, where variants can cause disease through either pattern, often leading to distinct or overlapping phenotypes depending on the specific molecular mechanism and residual protein function [12].
From Genetic Mechanism to Therapeutic Strategy
The therapeutic strategy for a genetic disorder is fundamentally guided by its inheritance pattern and molecular mechanism, which dictates the required pharmacological intervention.
Table 1: Inheritance Patterns, Molecular Mechanisms, and Corresponding Therapeutic Strategies
| Inheritance Pattern | Primary Molecular Mechanism | Exemplary Condition | Implied Therapeutic Strategy |
|---|---|---|---|
| Autosomal Dominant (AD) | Gain-of-Function (GOF) / Toxic Function | Huntington's Disease [125] | Inhibition of mutant protein or gene product (e.g., ASOs, siRNA) |
| Autosomal Dominant (AD) | Haploinsufficiency | TBC | Activation or augmentation of the remaining wild-type allele's function |
| Autosomal Dominant (AD) | Dominant-Negative | TBC | Inhibition of mutant allele and/or replacement of gene function |
| Autosomal Recessive (AR) | Complete Loss-of-Function (LOF) | RPE65-related Retinal Dystrophy [126] [124] | Gene replacement or protein augmentation (e.g., AAV-based gene therapy) |
| Dual AD/AR | Mechanism-dependent (LOF for AR, GOF/DN for AD) | Variants in genes like TBC [12] | Phenotype-specific strategy: Inhibition for AD presentation, Augmentation for AR presentation |
For example, Huntington's disease, an AD disorder caused by a CAG trinucleotide repeat expansion in the HTT gene, leads to a toxic GOF mutant protein [125]. This mechanism directly suggests an inhibitory therapeutic strategy, such as using antisense oligonucleotides (ASOs) to suppress mutant HTT expression [127]. Conversely, AR disorders like RPE65-related retinal dystrophy stem from a complete LOF, making gene augmentation—delivering a functional copy of the gene via AAV vectors—the logical therapeutic approach, as successfully implemented in voretigene neparvovec (Luxturna) [126] [124].
Quantitative Assessment of Inheritance-Based Druggability
Distinct Characteristics of Activator and Inhibitor Targets
Bioinformatic analyses reveal that genes targeted by drugs, and specifically those with a predisposition for activation or inhibition, possess distinct genetic profiles. A large-scale study of 2,553 druggable genes found that inhibitor targets are significantly more intolerant to LOF variants (lower LOEUF score) compared to activator targets (prank-sum = 8.5 × 10⁻⁸) [123]. This is counterintuitive, as inhibitor drugs aim to mimic LOF; however, this finding can be explained by confounding biological factors. Constrained inhibitor targets are enriched for genes essential for cell viability (e.g., chemotherapeutic targets) and for genes where GOF or overexpression drives disease, necessitating inhibition [123].
Furthermore, genes involved in autosomal dominant disorders are enriched among both activator and inhibitor targets. In contrast, genes involved in autosomal recessive disorders are depleted specifically for inhibitor mechanisms, consistent with the LOF nature of most recessive diseases [123]. These quantifiable differences enable the prediction of a gene's suitability as a target for activation or inhibition.
Table 2: Bioinformatic Profile of Druggable Genes by Modulation Type
| Feature | Activator Targets | Inhibitor Targets | All Protein-Coding Genes (Baseline) |
|---|---|---|---|
| LOF Intolerance (LOEUF) | Less constrained | More constrained [123] | Baseline constraint |
| Association with AD Disorders | Enriched | Enriched [123] | No enrichment |
| Association with AR Disorders | No significant depletion | Depleted [123] | No depletion |
| Association with GOF Mechanisms | Less enriched | More enriched [123] | No association |
| Protein Class Enrichment | e.g., G protein-coupled receptors [123] | e.g., Kinases [123] | N/A |
Machine Learning Models for Prediction
The distinct features of drug targets allow for the development of predictive machine learning models. One framework incorporating 41 tabular features, gene embeddings, and protein embeddings achieved high performance in predicting DOE-specific druggability across 19,450 protein-coding genes, with a macro-averaged area under the receiver operating characteristic curve (AUROC) of 0.95 [123]. These models can predict:
- Overall druggability: Whether a gene is a viable drug target.
- DOE-specific druggability: Whether a gene is more suitable for therapeutic activation or inhibition.
- Gene-disease-specific DOE: The required direction of effect for a specific gene-disease pair, using genetic association data [123].
Experimental Protocols for Validation
Protocol 1: In Silico Prediction of DOE-Specific Druggability
Objective: To computationally assess a target gene's predisposition for activation or inhibition therapy. Materials: Gene list, bioinformatic databases (gnomAD for constraint scores, GoFCards for GOF associations, DepMap for essentiality), and machine learning platforms. Methodology:
- Feature Extraction: For each candidate gene, compile a feature vector including:
- Intolerance scores: LOEUF from gomAD [123].
- Dosage sensitivity: Haploinsufficiency and triplosensitivity probability scores [123].
- Inheritance data: Association with AD or AR disorders from OMIM.
- Functional annotations: Protein class, subcellular localization, and Gene Ontology terms [123] [12].
- Embeddings: Gene and protein sequence embeddings from models like GenePT and ProtT5 [123].
- Model Application: Input the feature vector into a pre-trained machine learning model (e.g., an optimized stacked autoencoder with hierarchically self-adaptive particle swarm optimization) for classification [123] [128].
- Output Interpretation: The model generates a probabilistic score for the gene being an "activator," "inhibitor," or "other" target. A threshold (e.g., 0.27 for activators and 0.30 for inhibitors) can be applied for classification [123].
Protocol 2: Functional Validation of DOE Using Allelic Series
Objective: To experimentally confirm the predicted direction of effect by modeling a genetic dose-response relationship. Materials: Cell lines (primary or iPSC-derived), gene editing tools (CRISPR-Cas9), compounds (activator/inhibitor candidates), functional assays. Methodology:
- Generate Allelic Series: Use CRISPR-Cas9 to create isogenic cell lines with varying functional doses of the target gene (e.g., wild-type, heterozygous LOF, homozygous LOF, and GOF variants) [123].
- Phenotypic Screening: Subject each genotype to a disease-relevant phenotypic assay (e.g., cell viability, tau phosphorylation, or synaptic activity).
- Compound Testing: Treat the panel of cell lines with candidate activator and inhibitor compounds.
- Data Analysis: The correct DOE is confirmed if the compound shifts the pathological phenotype towards the wild-type state. For example, a beneficial effect of an inhibitor in GOF models, but not in LOF models, validates an inhibitory strategy [123].
Diagram 1: DOE Assessment Workflow. An integrated in silico and experimental pipeline for determining the therapeutic direction of effect for a given target gene.
The Scientist's Toolkit: Essential Research Reagents and Solutions
Table 3: Key Research Reagents for Inheritance-Based Druggability Assessment
| Reagent / Solution | Primary Function | Application Context |
|---|---|---|
| Whole Exome/Genome Sequencing | Comprehensive identification of pathogenic variants and inheritance patterns [71] [124]. | Establishing genetic etiology and mode of inheritance in patient cohorts. |
| Curated Genetic Databases (gnomAD, OMIM) | Provide essential gene-level metrics (e.g., LOEUF) and phenotype associations [123] [12]. | Feature extraction for in silico druggability prediction models. |
| Induced Pluripotent Stem Cells (iPSCs) | Patient-derived cells that can be differentiated into disease-relevant cell types. | Ex vivo modeling of genetic disorders for functional validation. |
| CRISPR-Cas9 Gene Editing System | Precise generation of isogenic cell lines with specific pathogenic variants [123]. | Creating allelic series for functional dose-response studies. |
| Adeno-Associated Virus (AAV) Vectors | In vivo delivery of therapeutic genes for augmentation or gene editing [126]. | Preclinical testing of gene augmentation strategies for AR disorders. |
| Antisense Oligonucleotides (ASOs) | Transiently bind RNA to modulate splicing or suppress expression of mutant genes [126] [127]. | Preclinical testing of inhibitory strategies for AD disorders. |
| Stacked Autoencoder (SAE) with HSAPSO | Deep learning framework for robust feature extraction and hyperparameter optimization [128]. | High-accuracy classification of druggable targets and their DOE. |
Decision Framework and Clinical Translation
The integration of inheritance patterns and molecular mechanisms leads to a logical decision framework for therapeutic development. This framework is critical for reducing the high failure rates in clinical trials, which often stem from an incorrect understanding of the required direction of effect [123].
Diagram 2: Therapeutic Strategy Decision Framework. A flowchart for selecting a therapeutic modality based on the established inheritance pattern and molecular mechanism of a disease.
This framework directly informs clinical trial design. For example, in AR disorders where gene augmentation is the strategy, patient selection hinges on confirming biallelic LOF variants, as seen in trials for RPE65- and CEP290-related retinal dystrophies [126] [124]. In AD disorders driven by a GOF mechanism, such as Huntington's disease, trials focus on suppressing the mutant allele using ASOs or other silencing technologies [125] [127]. Furthermore, the recognition of dual AD/AR genes necessitates careful patient genotyping, as the same gene may require opposite therapeutic strategies depending on the specific variant's mechanism [12].
Inheritance patterns are powerful, clinically accessible predictors of therapeutic potential. The systematic integration of this information with modern bioinformatic profiling and functional validation creates a robust pipeline for target identification and prioritization. As genetic databases expand and machine learning models become more sophisticated, the ability to preemptively design therapies with the correct direction of effect will be crucial for realizing the promise of precision medicine and improving the success rate of drug development for genetic disorders.
Conclusion
Understanding autosomal dominant and recessive inheritance patterns provides crucial insights that extend far beyond basic Mendelian genetics into sophisticated drug development strategies. The distinct molecular signatures, gene constraint profiles, and disease mechanisms associated with each pattern offer valuable predictive power for therapeutic target selection. Inheritance patterns directly inform the critical direction of therapeutic effect—whether activation or inhibition is required—with autosomal dominant disorders showing particular relevance for inhibitor development. As genetic technologies advance, integrating inheritance pattern knowledge with functional genomics and clinical data will enable more precise target prioritization, improved clinical trial design, and personalized therapeutic approaches. Future directions should focus on expanding DOE prediction frameworks, understanding modifier genes that influence penetrance, and developing pattern-specific therapeutic modalities to address the full spectrum of monogenic disorders.
References
- 1. Mendel's Law - Biology Online Dictionary of Segregation [https://www.biologyonline.com/dictionary/law-of-segregation]
- 2. Genetics, Autosomal Dominant - StatPearls - NCBI Bookshelf [https://www.ncbi.nlm.nih.gov/books/NBK557512/]
- 3. Genetic evidence informs the direction of therapeutic ... [https://www.nature.com/articles/s44386-025-00027-0]
- 4. & Dominance Explained with Examples Law of Segregation [https://www.vedantu.com/biology/law-of-segregation-law-of-dominance]
- 5. / principle ; Mendel's second of segregation law of segregation law [https://www.nature.com/scitable/definition/principle-of-segregation-301/?error=cookies_not_supported&code=4044cb60-91a9-42d9-8b29-ab8540bc7dda]
- 6. Dominance (genetics) [https://en.wikipedia.org/wiki/Dominance_(genetics)]
- 7. Genome-wide prediction of dominant and recessive ... [https://pmc.ncbi.nlm.nih.gov/articles/PMC11947176/]
- 8. Federated analysis of autosomal recessive coding variants ... [https://www.nature.com/articles/s41588-024-01910-8]
- 9. Autosomal Dominant Inheritance - an overview [https://www.sciencedirect.com/topics/medicine-and-dentistry/autosomal-dominant-inheritance]
- 10. Autosomal dominant inheritance — Knowledge Hub [https://www.genomicseducation.hee.nhs.uk/genotes/knowledge-hub/autosomal-dominant-inheritance/]
- 11. Autosomal Dominant Inheritance [https://migrc.org/teaching-tools/genetic-inheritance-patterns/autosomal-dominant/]
- 12. Exploring the unique characteristics of genes with dual ... [https://pubmed.ncbi.nlm.nih.gov/40769572/]
- 13. Autosomal inheritance: Dominant vs. recessive disorders [https://www.medicalnewstoday.com/articles/autosomal-inheritance]
- 14. DADA2 as an autosomal dominant disease [https://www.nature.com/articles/s41584-025-01312-y]
- 15. Genetics, Autosomal Recessive - StatPearls - NCBI Bookshelf [https://www.ncbi.nlm.nih.gov/books/NBK546620/]
- 16. INHERITANCE PATTERNS - Understanding Genetics - NCBI [https://www.ncbi.nlm.nih.gov/books/NBK115561/]
- 17. A robust pipeline for ranking carrier frequencies of ... [https://www.nature.com/articles/s41525-022-00344-7]
- 18. What are the different ways a genetic condition can be ... [https://medlineplus.gov/genetics/understanding/inheritance/inheritancepatterns/]
- 19. Catalogue of inherited autosomal recessive disorders ... [https://www.sciencedirect.com/science/article/pii/S1769721224000818]
- 20. Prevalence of common autosomal recessive and X-linked ... [https://pmc.ncbi.nlm.nih.gov/articles/PMC12125286/]
- 21. Loss-of-function, gain-of-function and dominant-negative mutations have profoundly different effects on protein structure | Nature Communications [https://www.nature.com/articles/s41467-022-31686-6]
- 22. Autosomal Recessive Inheritance - an overview [https://www.sciencedirect.com/topics/biochemistry-genetics-and-molecular-biology/autosomal-recessive-inheritance]
- 23. Prevalence of loss-of-function, gain-of-function and ... [https://www.nature.com/articles/s41467-025-63234-3]
- 24. Loss-of-function, gain-of-function and dominant-negative ... [https://pmc.ncbi.nlm.nih.gov/articles/PMC9259657/]
- 25. Genome-wide prediction of pathogenic gain- and loss-of-function variants from ensemble learning of a diverse feature set | Genome Medicine | Full Text [https://genomemedicine.biomedcentral.com/articles/10.1186/s13073-023-01261-9]
- 26. How to Draw a Pedigree - Iowa Institute of Human Genetics [https://humangenetics.medicine.uiowa.edu/resources/how-draw-pedigree]
- 27. Autosomal recessive inheritance — Knowledge Hub [https://www.genomicseducation.hee.nhs.uk/genotes/knowledge-hub/autosomal-recessive-inheritance/]
- 28. 20.3 Pedigree Analysis – College Biology I [https://slcc.pressbooks.pub/collegebiology1/chapter/pedigree-analysis/]
- 29. The prevalence, genetic complexity and population ... [https://www.nature.com/articles/s41525-021-00203-x]
- 30. Comprehensive Analysis of Tissue-wide Gene Expression ... [https://www.sciencedirect.com/science/article/pii/S2405471217302909]
- 31. Systematic analysis of inheritance pattern determination in ... [https://www.frontiersin.org/journals/genetics/articles/10.3389/fgene.2022.990015/full]
- 32. Genome-wide prediction of dominant and recessive ... - PubMed [https://pubmed.ncbi.nlm.nih.gov/40015282/]
- 33. Novel differentially expressed genes and multiple ... [https://pmc.ncbi.nlm.nih.gov/articles/PMC12505200/]
- 34. Spatial gene expression at single-cell resolution from ... [https://www.nature.com/articles/s41592-025-02795-z]
- 35. Empowering Families through Carrier Screening: A Guide ... [https://geneyx.com/publications/empowering-families-through-carrier-screening-a-guide-to-genetic-testing-for-inherited-diseases/]
- 36. Carrier Screening | Washington State Department of Health [https://doh.wa.gov/you-and-your-family/genetic-services/health-care-providers/carrier-screening]
- 37. Screening for autosomal recessive and X-linked conditions ... [https://pmc.ncbi.nlm.nih.gov/articles/PMC8488021/]
- 38. Y Linked – Michigan Genetics Resource Center [https://migrc.org/teaching-tools/genetic-inheritance-patterns/y-linked/]
- 39. Preconception carrier screening in 2025: what's next? A ... [https://pmc.ncbi.nlm.nih.gov/articles/PMC11950571/]
- 40. Regional patterns of genetic variants in expanded carrier ... [https://www.frontiersin.org/journals/genetics/articles/10.3389/fgene.2025.1527228/full]
- 41. Carrier Screening in the Reproductive Setting 2025-09-20 [https://guidelines.carelonmedicalbenefitsmanagement.com/carrier-screening-in-the-reproductive-setting-2025-09-20/]
- 42. Prenatal diagnosis of rare genetic disorders: fourteen years ... [https://pmc.ncbi.nlm.nih.gov/articles/PMC12403508/]
- 43. Carrier Screening for Genetic Conditions [https://www.acog.org/clinical/clinical-guidance/committee-opinion/articles/2017/03/carrier-screening-for-genetic-conditions]
- 44. Advancing precision care in pregnancy through a treatable ... [https://www.sciencedirect.com/science/article/pii/S0002929725001107]
- 45. CRISPR/Cas therapeutic strategies for autosomal dominant ... [https://pmc.ncbi.nlm.nih.gov/articles/PMC9057583/]
- 46. Target Product Profiles: How genetic stratification shapes ... [https://www.healthlumen.com/target-product-profiles-why-genetic-stratification-matters-for-rare-disease-drug-development/]
- 47. RNA-editing drugs advance into clinical trials [https://www.nature.com/articles/d41573-024-00070-y]
- 48. target identification and genetically stratified clinical trials [https://www.sciencedirect.com/science/article/pii/S1359644618300400]
- 49. Ensemble and consensus approaches to prediction of ... [https://www.sciencedirect.com/science/article/pii/S2667237524003047]
- 50. Prospective Cohort Study in Alport Syndrome Patients Under ... [https://pmc.ncbi.nlm.nih.gov/articles/PMC12142643/]
- 51. Unlocking the DOOR—how to design, apply, analyse, and ... [https://www.sciencedirect.com/science/article/pii/S1198743X23002069]
- 52. State‐of‐the‐Art on Model‐Informed Drug Development ... [https://pmc.ncbi.nlm.nih.gov/articles/PMC12625129/]
- 53. The Potential of Mesenchymal Stem Cells in Treating ... [https://pmc.ncbi.nlm.nih.gov/articles/PMC11591855/]
- 54. Treatment of Spinocerebellar Ataxia with Mesenchymal Stem Cells: A Phase I/IIa Clinical Study - PMC [https://pmc.ncbi.nlm.nih.gov/articles/PMC5657707/]
- 55. Clinical Pipeline - Stemchymal® therapy [https://www.reprocell.com/clinical-pipelines/stemchymal-therapy]
- 56. Steminent Stands Ready to Showcase Novel MSC-based ... [https://www.biospace.com/steminent-stands-ready-to-showcase-novel-msc-based-therapy-for-spinocerebellar-ataxia-at-global-stage]
- 57. Notice Regarding Announcement by Partner Steminent Biotherapeutics Inc. of Phase II Clinical Trial Results in Taiwan for Spinocerebellar Ataxia Treatment "Stemchymal®" [https://www.reprocell.com/news/announcement-by-steminent-biotherapeutics-phase-ii-clinical-trial-results-in-taiwan-for-spinocerebellar-ataxia-treatment-stemchymal]
- 58. [PRESS RELEASE] Announcement of Results of Phase II Clinical Trial in Japan for Stemchymal®, a Regenerative Medicine Product for Spinocerebellar Ataxia [https://www.reprocell.com/news/announcement-results-phase-ii-clinical-trial-in-japan-stemchymal]
- 59. Autosomal Recessive [https://ufhealth.org/conditions-and-treatments/autosomal-recessive]
- 60. a proposed new model of inheritance in genetic conditions [https://www.sciencedirect.com/science/article/pii/S0306987725001537]
- 61. Prevalence of common autosomal recessive and X-linked ... [https://www.nature.com/articles/s41598-025-03399-5]
- 62. Article Genome-wide prediction of dominant and recessive ... [https://www.sciencedirect.com/science/article/pii/S0002929725000485]
- 63. NSGC Practice Guidelines [https://www.nsgc.org/Research-and-Publications/Practice-Guidelines]
- 64. Incomplete Penetrance and Variable Expressivity [https://pmc.ncbi.nlm.nih.gov/articles/PMC9380816/]
- 65. Incomplete Penetrance and Variable Expressivity [https://www.frontiersin.org/journals/genetics/articles/10.3389/fgene.2022.920390/full]
- 66. Snapshot: What Does Incomplete Penetrance Mean? [https://www.ataxia.org/scasourceposts/snapshot-what-does-incomplete-penetrance-mean/]
- 67. Inheritance of Single-Gene Disorders - Fundamentals [https://www.merckmanuals.com/home/fundamentals/genetics/inheritance-of-single-gene-disorders]
- 68. Exploring penetrance of clinically relevant variants in over ... [https://pmc.ncbi.nlm.nih.gov/articles/PMC12579199/]
- 69. 4.3 Modes of Inheritance - Introduction to Genetics [https://opengenetics.pressbooks.tru.ca/chapter/modes-of-inheritance/]
- 70. Genetic heterogeneity: Challenges, impacts, and methods ... [https://pmc.ncbi.nlm.nih.gov/articles/PMC9669229/]
- 71. Basic principles of genetics and genetic counselling - PMC [https://pmc.ncbi.nlm.nih.gov/articles/PMC12266215/]
- 72. Allelic Heterogeneity and Genetic Modifier Loci Contribute to ... [https://journals.plos.org/plosone/article?id=10.1371/journal.pone.0023021]
- 73. A State-of-the-Art Roadmap for Biomarker-Driven Drug ... [https://pmc.ncbi.nlm.nih.gov/articles/PMC9143954/]
- 74. New insights into the generation and role of de novo ... [https://genomebiology.biomedcentral.com/articles/10.1186/s13059-016-1110-1]
- 75. Prevalence and architecture of de novo mutations in ... [https://pmc.ncbi.nlm.nih.gov/articles/PMC6016744/]
- 76. De novo mutations, genetic mosaicism and human disease [https://pmc.ncbi.nlm.nih.gov/articles/PMC9550265/]
- 77. De novo mutation [https://en.wikipedia.org/wiki/De_novo_mutation]
- 78. Patterns and distribution of de novo mutations in multiplex ... [https://www.nature.com/articles/s10038-022-01054-9]
- 79. De novo missense mutation in MYT1l leading to autosomal ... [https://pmc.ncbi.nlm.nih.gov/articles/PMC12588991/]
- 80. Understanding De Novo and Germline Mutations [https://www.stridesaba.com/understanding-de-novo-and-germline-mutations/]
- 81. Implications of De Novo Mutations in Guiding Drug Discovery [https://pubmed.ncbi.nlm.nih.gov/30597425/]
- 82. Autosomal Dominant & Autosomal Recessive Disorders [https://my.clevelandclinic.org/health/body/23078-autosomal-dominant--autosomal-recessive]
- 83. Pseudodominance – Knowledge and References [https://taylorandfrancis.com/knowledge/Medicine_and_healthcare/Medical_genetics/Pseudodominance/]
- 84. Pseudodominance [https://en.wikipedia.org/wiki/Pseudodominance]
- 85. pseudodominance definition [https://groups.molbiosci.northwestern.edu/holmgren/Glossary/Definitions/Def-P/pseudodominance.html]
- 86. Mitochondrial recessive ataxia syndrome mimicking ... [https://pubmed.ncbi.nlm.nih.gov/22166854/]
- 87. Diagnostic implications of pitfalls in causal variant ... [https://www.nature.com/articles/s41467-023-40909-3]
- 88. Consequences of ignoring dominance genetic effects from ... [https://pmc.ncbi.nlm.nih.gov/articles/PMC12350741/]
- 89. Autosomal Dominant Inheritance - an overview [https://www.sciencedirect.com/topics/biochemistry-genetics-and-molecular-biology/autosomal-dominant-inheritance]
- 90. The prevalence , genetic complexity and population-specific founder ... [https://www.nature.com/articles/s41525-021-00203-x?error=cookies_not_supported&code=c53c609f-572f-466d-b8e1-12cc343a7deb]
- 91. Consanguineous Marriage and Its Association With ... [https://pmc.ncbi.nlm.nih.gov/articles/PMC10924896/]
- 92. The impact of consanguinity on human health and disease with an... [https://link.springer.com/article/10.1007/s44162-022-00004-5]
- 93. The impact of consanguinity on the frequency of... | Ugeskriftet.dk [https://ugeskriftet.dk/dmj/impact-consanguinity-frequency-inborn-errors-metabolism]
- 94. A Population-Based Study of Autosomal-Recessive Disease ... [https://pmc.ncbi.nlm.nih.gov/articles/PMC3484657/]
- 95. Founder effect and genetic disease in Sottunga, Finland [https://pubmed.ncbi.nlm.nih.gov/3067585/]
- 96. Mutational spectrum of autosomal limb-girdle muscular... recessive [https://ojrd.biomedcentral.com/articles/10.1186/s13023-020-1296-x]
- 97. Frontiers | Editorial: Consanguinity and rare genetic neurological... [https://www.frontiersin.org/journals/neurology/articles/10.3389/fneur.2025.1494253/full]
- 98. - Genotype in phenotype and... correlations autosomal dominant [https://pubmed.ncbi.nlm.nih.gov/17429049/]
- 99. Genetic Spectrum and Genotype-Phenotype Correlations in a ... [https://pmc.ncbi.nlm.nih.gov/articles/PMC12136104/]
- 100. Frontiers | Germline activating sequence variations in RASopathy... [https://www.frontiersin.org/journals/genetics/articles/10.3389/fgene.2025.1677143/full]
- 101. Drug toxicity prediction based on genotype-phenotype ... [https://pmc.ncbi.nlm.nih.gov/articles/PMC12597050/]
- 102. A genotype-to-drug diffusion model for generation of ... [https://www.nature.com/articles/s41467-025-60763-9]
- 103. Autosomal Recessive Inheritance [https://massivebio.com/autosomal-recessive-inheritance/]
- 104. Autosomal Dominant Inheritance [https://www.urmc.rochester.edu/encyclopedia/content?contenttypeid=85&contentid=p07104]
- 105. Novel Molecular Mechanisms Inform Targeted Therapies for ... [https://news.feinberg.northwestern.edu/2025/07/14/novel-molecular-mechanisms-inform-targeted-therapies-for-chronic-kidney-disease/]
- 106. Patterns of Inheritance | Anatomy and Physiology II [https://courses.lumenlearning.com/suny-ap2/chapter/patterns-of-inheritance/]
- 107. Decoding Autosomal Patterns Inheritance [https://www.numberanalytics.com/blog/decoding-autosomal-inheritance-patterns-genetics]
- 108. PMC - PubMed Central [https://pmc.ncbi.nlm.nih.gov/articles/PMC10764188/]
- 109. DNA Testing: Costs, Insights, and 2025 ... Autosomal Genetic [https://www.inliber.com/en/posts/2024-autosomal-dna-testing-costs-insights-and-genetic-inheritance-explainedU2an]
- 110. Gene Therapies for Inherited Diseases [https://www.reviewofophthalmology.com/article/gene-therapies-for-inherited-diseases]
- 111. Emerging paradigms for target discovery of traditional medicines [https://pmc.ncbi.nlm.nih.gov/articles/PMC11910885/]
- 112. Leading AI-Driven Drug Discovery Platforms [https://www.sciencedirect.com/science/article/abs/pii/S0031699725075118]
- 113. Current perspectives in drug targeting intrinsically disordered ... [https://bmcbiol.biomedcentral.com/articles/10.1186/s12915-025-02214-x]
- 114. Landmark Study Identifies New Genetic Cause of ... [https://www.mountsinai.org/about/newsroom/2025/landmark-study-identifies-new-genetic-cause-of-neurodevelopmental-disorders-bringing-long-awaited-answers-to-families]
- 115. Warning signs for identifying neurodevelopmental disorders [https://www.jped.com.br/en-warning-signs-for-identifying-neurodevelopmental-articulo-S0021755725001664]
- 116. Expanding the Autosomal Recessive Gene Spectrum of ... [https://pubmed.ncbi.nlm.nih.gov/40959972/]
- 117. The landscape of autosomal-dominant Alzheimer's disease [https://pubmed.ncbi.nlm.nih.gov/39903689/]
- 118. Escaping Autosomal-Dominant Alzheimer's Disease [https://sites.wustl.edu/centerforaging/escaping-adad/]
- 119. An allelic-series rare-variant association test for candidate- ... [https://pmc.ncbi.nlm.nih.gov/articles/PMC10432147/]
- 120. Article A scalable framework for identifying allelic series ... [https://www.sciencedirect.com/science/article/pii/S0002929725003684]
- 121. Evidence - An Evidence Framework for Genetic Testing - NCBI [https://www.ncbi.nlm.nih.gov/books/NBK425809/]
- 122. Translational Pharmacogenomics: Discovery, Evidence ... [https://pmc.ncbi.nlm.nih.gov/articles/PMC8662715/]
- 123. Genetic evidence informs the direction of therapeutic ... [https://pmc.ncbi.nlm.nih.gov/articles/PMC12488494/]
- 124. Diagnostic whole exome sequencing in presumably ... [https://www.nature.com/articles/s41598-025-08272-z]
- 125. AI-Enhanced Transcriptomic Discovery of Druggable ... [https://www.mdpi.com/2076-3425/15/8/865]
- 126. Addressing Challenges in Developing Treatments for ... [https://pmc.ncbi.nlm.nih.gov/articles/PMC12395841/]
- 127. Decoding the genetic blueprints of neurological disorders [https://www.frontiersin.org/journals/neurology/articles/10.3389/fneur.2025.1422707/full]
- 128. Automated drug design for druggable target identification ... [https://www.nature.com/articles/s41598-025-18091-x]