Beyond the Framework: A Critical Examination of ACMG-AMP Variant Interpretation Guidelines in Modern Genomic Medicine
This article provides a comprehensive, critical analysis of the influential ACMG-AMP guidelines for variant interpretation, intended for researchers, scientists, and drug development professionals.
Beyond the Framework: A Critical Examination of ACMG-AMP Variant Interpretation Guidelines in Modern Genomic Medicine
Abstract
This article provides a comprehensive, critical analysis of the influential ACMG-AMP guidelines for variant interpretation, intended for researchers, scientists, and drug development professionals. It explores the foundational principles and inherent challenges of the framework (Intent 1), details methodological hurdles and clinical implementation issues (Intent 2), examines strategies for troubleshooting ambiguous results and optimizing workflows (Intent 3), and compares the guidelines to emerging standards and validation approaches (Intent 4). The synthesis identifies key limitations in scalability, consistency, and adaptation to new evidence, offering actionable insights for refining variant classification and its application in both research and therapeutic development.
Decoding the ACMG-AMP Blueprint: Foundational Principles and Inherent Tensions
The American College of Medical Genetics and Genomics (ACMG) and the Association for Molecular Pathology (AMP) jointly published the first systematic guidelines for the interpretation of sequence variants in 2015. This seminal work, "Standards and guidelines for the interpretation of sequence variants," was born from a critical need to standardize the clinical reporting of findings from next-generation sequencing, which was rapidly transitioning from research to clinical diagnostics. Prior to 2015, laboratories and individual clinicians used heterogeneous, often in-house criteria, leading to inconsistent variant classification and potential patient harm. The guidelines provided a structured, evidence-based framework centered on 28 criteria for classifying variants as Pathogenic, Likely Pathogenic, Uncertain Significance, Likely Benign, or Benign.
Core Framework and Iterative Evolution
The 2015 framework established a binary scoring system based on pathogenic (PVS1, PS1-PS4, PM1-PM6, PP1-PP5) and benign (BA1, BS1-BS3, BP1-BP7) criteria. Variant classification was determined by combining the strength and number of met criteria. This framework was not static; it evolved through ongoing curation and expert feedback.
Key milestones in its evolution include:
- 2015: Initial publication of the 28-criteria framework.
- 2018: Publication of the ACMG/AMP clinical pharmacogenetics (CPIC) guidelines, extending the framework to pharmacogenomic variants.
- 2020: Refinement of the PVS1 (null variant in a gene where loss-of-function is a known mechanism of disease) criterion through a standalone publication to prevent its overapplication.
- 2021-2023: Emergence of disease- and gene-specific specifications (e.g., for hearing loss, cancer predisposition genes like TP53, cardiology, etc.), where the general criteria are tailored to the unique molecular and clinical characteristics of specific conditions. This period also saw increased focus on copy number variants (CNVs) and structural variants.
The table below summarizes the quantitative growth and specialization of the guidelines.
Table 1: Evolution of ACMG-AMP Guideline Publications and Scope
| Year | Key Publication/Specification | Primary Focus | Number of New/Modified Criteria |
|---|---|---|---|
| 2015 | Standards and guidelines for the interpretation of sequence variants | General Framework | 28 original criteria established |
| 2018 | Clinical Pharmacogenetics (CPIC) Implementation | Pharmacogenomic Variants | Adaptation of general criteria |
| 2020 | Recommendation for refining the PVS1 criterion | LOF Variant Interpretation | 1 major criterion refined |
| 2021 | ACMG/AMP Hearing Loss Variant Curation Expert Panel Specifications | Disease-Specific (HL) | Full set specified for multiple genes |
| 2022 | TP53 Variant Curation Guidelines | Gene-Specific (Cancer) | Full set specified for TP53 |
| 2023 | Technical Standards for Constitutional CNVs | Copy Number Variants | Framework adaptation for CNVs |
Detailed Methodologies for Key Guideline Development Experiments
The guidelines are based on collective evidence from decades of genetic research. The development and specification process itself follows a rigorous methodological protocol.
Protocol 1: Development of Disease-Specific Specifications by a Variant Curation Expert Panel (VCEP)
- Panel Constitution: The ClinGen FDA Recognition Program oversees the formation of a VCEP comprising clinical geneticists, molecular pathologists, genetic counselors, and biocurators with expertise in the target disease.
- Pilot Curation: The VCEP selects a pilot set of ~40 well-characterized variants (known pathogenic and benign) from the disease gene(s).
- Criteria Application & Discordance Analysis: Panelists independently apply the 2015 ACMG-AMP criteria to each pilot variant. Results are compared, and discordances are identified.
- Specification Iteration: The VCEP discusses discordant cases to reach consensus on how general criteria should be specified, modified, or weighted for their specific disease context (e.g., defining "null variant" for the gene, setting allele frequency thresholds for BA1/BS1, defining functional assay thresholds for PS3/BS3).
- Validation: The finalized specification rules are validated on a separate set of variants. The specifications are then submitted for public comment and official approval by ClinGen/ACMG.
- Publication & Implementation: Approved specifications are published and integrated into clinical variant assessment pipelines and databases like ClinVar.
Protocol 2: Functional Assay Validation for PS3/BS3 Criterion The PS3 (well-established in vitro or in vivo functional studies supportive of a damaging effect) and BS3 (functional studies show no damaging effect) criteria are critical. A typical experimental protocol for a TP53 functional assay is outlined below.
- Cloning: The wild-type and variant TP53 cDNA sequences are cloned into an expression vector.
- Cell Transfection: Plasmids are transfected into a TP53-null cell line (e.g., H1299).
- Expression Analysis: Western blot is performed to confirm equal protein expression levels between wild-type and variant constructs.
- Functional Readout: a. Transcriptional Activity Assay: Co-transfect with a reporter plasmid containing a p53-responsive element (e.g., from p21 gene) driving luciferase expression. b. Cell-Based Assay: Measure apoptosis (via flow cytometry for Annexin V) or cell cycle arrest (via FACS analysis) in transfected cells after DNA damage.
- Data Normalization & Threshold Setting: Activity of the variant is normalized to wild-type (set at 100%). Based on historical control data from known pathogenic and benign variants, thresholds are set (e.g., <20% activity supports PS3, >80% activity supports BS3). Results are statistically analyzed (e.g., t-test, n≥3 replicates).
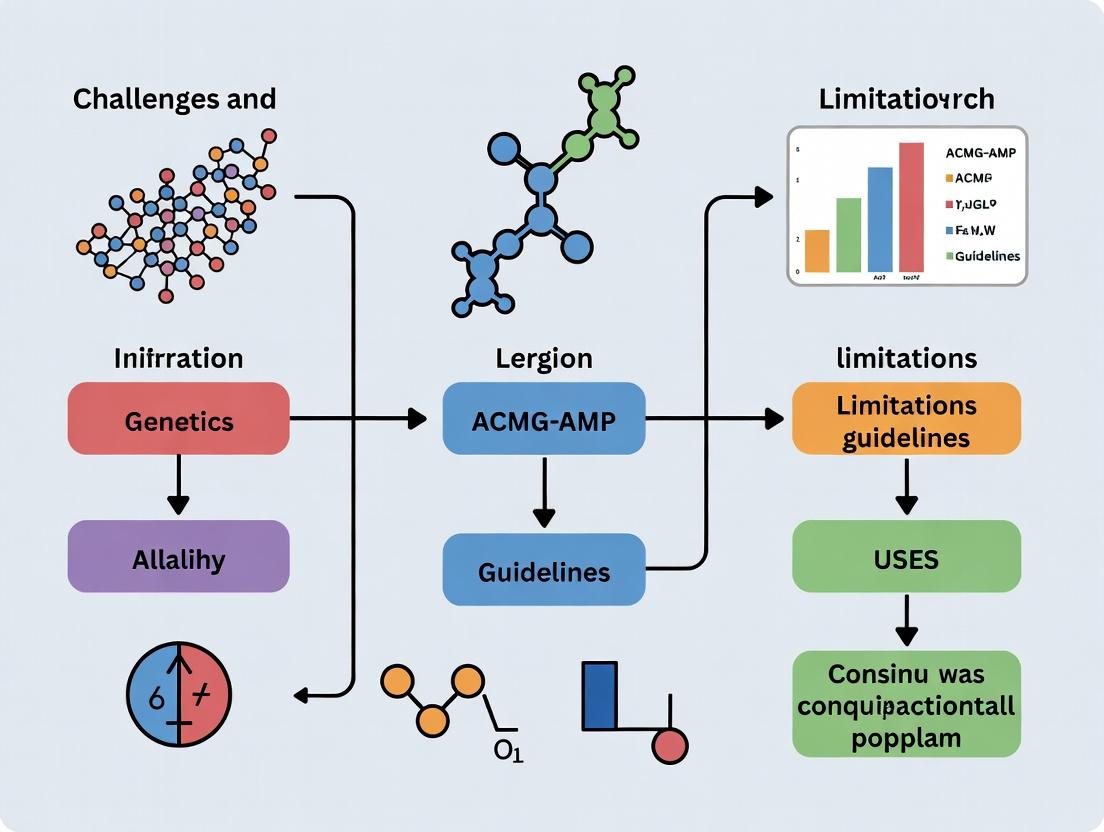
Visualization: The ACMG-AMP Guideline Development and Application Ecosystem
Title: Evolution and Specification of ACMG-AMP Guidelines
The Scientist's Toolkit: Key Reagent Solutions for Variant Assessment
Table 2: Essential Research Reagents and Tools for Experimental ACMG-AMP Criterion Fulfillment
| Item/Category | Example/Supplier | Function in Guideline Context |
|---|---|---|
| Functional Assay Kits | Luciferase Reporter Assay Kit (Promega), Annexin V Apoptosis Kit (BioLegend) | Provides standardized reagents to generate evidence for PS3/BS3 (functional studies). |
| Cell Lines | TP53-null H1299, BRCA1-deficient HCC1937 (ATCC) | Essential isogenic backgrounds for functional characterization of variants without interference from endogenous protein. |
| Cloning & Mutagenesis Kits | Q5 Site-Directed Mutagenesis Kit (NEB), Gibson Assembly Master Mix (NEB) | Enables construction of expression vectors for wild-type and variant alleles for functional assays. |
| Population Databases | gnomAD (Broad), 1000 Genomes | Primary source for allele frequency data to apply BA1/BS1/PM2 criteria. |
| Variant/Disease Databases | ClinVar (NCBI), LOVD, HGMD | Critical for PS4/PM5/PP5 (previous reports) and gathering case-level data (PS4/PP4). |
| In Silico Prediction Tools | SIFT, PolyPhen-2, REVEL, CADD | Provides computational evidence for PP3 (supporting pathogenic) or BP4 (supporting benign). |
| Sanger Sequencing Kits | BigDye Terminator v3.1 (Thermo Fisher) | Required for PS6 (de novo) confirmation through segregation analysis in a proband-parent trio. |
| Reference Materials | Genome in a Bottle (GIAB) reference genomes (NIST) | Provides benchmark variants for validating sequencing pipelines and variant calling, underpinning all analytical evidence. |
This historical analysis of the ACMG-AMP guidelines reveals a trajectory from a unifying general framework to an increasingly complex ecosystem of disease-specific specifications. While this evolution addresses initial oversimplifications and improves accuracy within defined domains, it also introduces new challenges central to ongoing research. These include the potential for inconsistencies between different VCEP specifications, the significant resource burden of expert panel formation and maintenance, and the inadequate guidance for variants in genes without a dedicated VCEP. Furthermore, the rapid accumulation of functional data from high-throughput assays presents a challenge for the manual, criterion-counting framework. Future research, therefore, must focus on computational approaches to integrate diverse evidence types, formalize specification logic for scalable application, and develop continuous learning systems that can incorporate real-world evidence while maintaining the structured rigor established by the ACMG-AMP's foundational genesis.
Within contemporary research into the challenges and limitations of the ACMG-AMP variant interpretation guidelines, a fundamental area of focus is the 28 criteria used for classifying evidence. These criteria are partitioned into pathogenic (PP) and benign (BP) supporting evidence, and pathogenic (PM) and benign (BS) moderate evidence. This whitepaper provides a technical deconstruction of these criteria, the associated evidence-based framework, and experimental methodologies pertinent to their application in clinical diagnostics and drug development.
The 28 Criteria: Structure and Classification
The ACMG-AMP framework standardizes variant interpretation by categorizing evidence across multiple domains. Quantitative data on the distribution and application of these criteria are synthesized from current literature and reporting databases.
| Category | Code | Number of Criteria | Typical Evidence Type | Common Application Context |
|---|---|---|---|---|
| Pathogenic Very Strong | PVS1 | 1 | Null variant in a gene where LOF is a known disease mechanism. | Predicted protein-truncating variants. |
| Pathogenic Strong | PS1-PS4 | 4 | Functional studies, de novo occurrence, segregation data. | Missense variants, novel amino acid changes. |
| Pathogenic Moderate | PM1-PM6 | 6 | Located in a critical functional domain, population data, computational evidence. | In-frame deletions, splicing variants. |
| Pathogenic Supporting | PP1-PP5 | 5 | Multiple lines of mild supporting evidence. | Co-segregation data, phenotype specificity. |
| Benign Standalone | BA1 | 1 | High allele frequency in general populations. | Common population variants. |
| Benign Strong | BS1-BS4 | 4 | Observed in healthy adults, mismatch with phenotype. | Allele frequency above disease prevalence. |
| Benign Supporting | BP1-BP7 | 7 | Silent variants, lack of segregation, reputable source. | In-frame variants in non-critical regions. |
Table 2: Quantitative Application Analysis of Key Criteria (Based on ClinVar Data Sampling)
| Criterion | Approx. % of Pathogenic/Benign Classifications Utilizing Criterion | Most Frequent Variant Type | Reported Inter-Laboratory Concordance Challenge |
|---|---|---|---|
| PM2 (Absent from controls) | ~85% (Pathogenic) | Missense, Frameshift | High - Dependent on reference database breadth. |
| PP3/BP4 (Computational evidence) | ~78% (Pathogenic) / ~65% (Benign) | Missense | Moderate - Algorithm and threshold variability. |
| PS3/BS3 (Functional studies) | ~22% (Pathogenic) | Missense, Splicing | Low - Protocol standardization is a major limitation. |
| PM1 (Hotspot domain) | ~40% (Pathogenic) | Missense | Moderate - Domain definition consistency. |
| BA1 (High allele frequency) | ~70% (Benign) | All | Low - Generally straightforward application. |
Evidence-Based Framework and Integration
The framework involves combining criteria using a semi-quantitative Bayesian-like approach. Points from different evidence categories are aggregated to reach a final classification (Pathogenic, Likely Pathogenic, Uncertain Significance, Likely Benign, Benign).
Diagram 1: ACMG-AMP Variant Interpretation Workflow (77 chars)
Detailed Experimental Protocols for Key Evidence Types
Protocol 1: Functional Assays for PS3/BS3 Criterion
Objective: To determine the functional impact of a missense variant on protein activity. Methodology:
- Construct Generation: Generate wild-type (WT) and variant expression constructs via site-directed mutagenesis (e.g., using Q5 High-Fidelity DNA Polymerase).
- Cell Culture & Transfection: Use a relevant cell line (e.g., HEK293T). Transfect constructs using a lipid-based reagent (e.g., Lipofectamine 3000). Include empty vector control.
- Protein Analysis:
- Harvest cells 48h post-transfection.
- Perform Western blotting to assess expression levels (primary antibody against protein of interest, β-actin loading control).
- Quantify band intensity using software (e.g., ImageLab).
- Functional Readout: Perform a gene-specific activity assay (e.g., luciferase reporter for a transcription factor, enzyme activity assay).
- Data Analysis: Normalize activity to protein expression. Compare variant activity to WT (set at 100%). Statistically significant reduction (<20% activity) supports PS3. Activity comparable to WT (>80%) supports BS3. Results between 20-80% are considered inconclusive.
Protocol 2: Segregation Analysis for PP1 Criterion
Objective: To assess co-segregation of the variant with disease phenotype in a family. Methodology:
- Pedigree & Sample Collection: Construct a detailed pedigree. Obtain informed consent and DNA samples from affected and unaffected family members.
- Genotyping: Perform targeted sequencing (Sanger or NGS panel) for the variant of interest in all available samples.
- Statistical Evaluation: Calculate the LOD (Logarithm of Odds) score under a defined genetic model (autosomal dominant/recessive). The strength of PP1 evidence (Supporting vs. Strong) depends on the number of meioses and observed segregation consistency.
- Documentation: Document any instances of non-penetrance or phenocopies, which reduce evidence strength.
Diagram 2: Segregation Analysis in a Dominant Pedigree (82 chars)
The Scientist's Toolkit: Key Research Reagent Solutions
Table 3: Essential Materials for Variant Interpretation Research
| Item/Category | Example Product/Source | Primary Function in Protocol |
|---|---|---|
| High-Fidelity PCR Enzyme | Q5 High-Fidelity DNA Polymerase (NEB) | Accurate amplification for construct generation and mutagenesis. |
| Site-Directed Mutagenesis Kit | QuikChange II (Agilent) or equivalent | Introduction of specific nucleotide changes into plasmid DNA. |
| Lipid-Based Transfection Reagent | Lipofectamine 3000 (Thermo Fisher) | Efficient delivery of plasmid DNA into mammalian cell lines. |
| Cell Line | HEK293T (ATCC CRL-3216) | A highly transfectable, standard model for functional protein expression studies. |
| Primary Antibodies | Target-specific (e.g., from Cell Signaling Tech.) & β-Actin loading control | Detection and quantification of target protein expression in Western blotting. |
| Chemiluminescent Substrate | Clarity or SuperSignal (Bio-Rad, Thermo Fisher) | Visualization of antibody-bound protein bands on Western blots. |
| Reporter Assay System | Dual-Luciferase Reporter Assay System (Promega) | Quantitative measurement of transcriptional activity for factor variants. |
| Nucleic Acid Isolation Kits | DNeasy Blood & Tissue Kit (Qiagen) | High-quality genomic DNA extraction from patient samples for segregation studies. |
| Sanger Sequencing Service | In-house with BigDye Terminators or commercial provider (Eurofins) | Confirmatory genotyping and validation of variant presence. |
| Variant Annotation Database | ClinVar, gnomAD, dbNSFP | Critical sources of population frequency and in silico prediction data for PM2, PP3/BP4. |
Limitations and Future Directions
The challenges within the ACMG-AMP framework, which this technical analysis underpins, include the subjective weighting of evidence, lack of standardized quantitative thresholds for functional data (PS3/BS3), and variable application of computational criteria (PP3/BP4). Ongoing research aims to develop more quantitative, calibrated statistical models to replace the current semi-quantitative rules, thereby improving consistency and transparency for clinical and drug development applications.
This whitepaper explores the central challenge of applying standardized frameworks, specifically the American College of Medical Genetics and Genomics (ACMG)-Association for Molecular Pathology (AMP) variant interpretation guidelines, to the inherent complexity of biological systems. While these guidelines provide a critical scaffold for consistent variant classification in clinical diagnostics, their application in research and therapeutic development reveals significant limitations. This document argues that a rigid, checklist-based approach often fails to capture the nuanced, context-dependent behavior of biological variants, particularly in non-Mendelian or multifactorial disease contexts. The reconciliation of this tension is paramount for accurate target identification, biomarker validation, and patient stratification in modern drug development.
Core Limitations of Standardized Frameworks in Complex Biology
The ACMG-AMP guidelines stratify evidence into categories (Pathogenic, Likely Pathogenic, Uncertain Significance, Likely Benign, Benign) based on weighted criteria. Quantitative analysis of recent literature reveals systematic gaps when applied to complex phenotypes.
Table 1: Quantitative Analysis of ACMG-AMP Guideline Application Challenges in Complex Disease Studies
| Challenge Category | % of Reviewed Studies Reporting Issue (2020-2024) | Primary Impact on Drug Development |
|---|---|---|
| Variant of Uncertain Significance (VUS) Over-classification | 68% | Obscures true target-patient relationships, increases clinical trial risk. |
| Inconsistent Application of "PP3/BP4" (Computational Evidence) | 72% | Leads to discordant pathogenicity calls for same variant across labs/studies. |
| Poor Handling of Oligogenic or Polygenic Models | 89% | Guidelines lack framework for combinatorial variant scoring. |
| Context-Dependence (e.g., tissue-specific, oncogenic vs. germline) | 77% | Single classification misrepresents variant role in different diseases. |
Experimental Protocols for Contextual Variant Interpretation
To address these limitations, advanced experimental protocols are required to move beyond binary classification.
Protocol: Multiplexed Functional Assay for VUS Resolution
Objective: Quantitatively assess the functional impact of a VUS in a relevant cellular pathway. Methodology:
- Cloning & Library Generation: Site-directed mutagenesis is used to introduce the VUS and control variants (wild-type, known pathogenic, known benign) into the gene of interest cDNA. These are cloned into a lentiviral expression vector with a barcode sequence unique to each variant.
- Cell Line Engineering: A relevant cell line (e.g., iPSC-derived cardiomyocytes for a channelopathy gene) with knockout (KO) of the endogenous gene is generated via CRISPR-Cas9. The KO is validated by sequencing and Western blot.
- Multiplexed Infection & Selection: The lentiviral variant library is transduced into the KO cell line at a low MOI to ensure single-variant integration. Cells are selected with puromycin.
- Functional Selection Pressure: The pooled cell population is subjected to a pathway-specific stressor (e.g., calcium flux challenge, kinase inhibitor). Cells are sorted via FACS based on a functional reporter (e.g., calcium-sensitive dye fluorescence) into "normal-function" and "abnormal-function" bins.
- Barcode Sequencing & Analysis: Genomic DNA is extracted from pre-selection and sorted populations. The variant-associated barcodes are amplified via PCR and quantified by next-generation sequencing (NGS). The enrichment/depletion of each barcode in the abnormal-function bin is calculated relative to the pre-selection pool. A functional score is derived, statistically comparing the VUS to benign and pathogenic controls.
Protocol: Assay for Combinatorial Variant Effects
Objective: Determine the synergistic or modifying effect of two or more variants identified in a single patient. Methodology:
- CRISPR-Mediated Endogenous Tagging: Using CRISPR-Homology Directed Repair (HDR), introduce each patient variant individually and in combination into the endogenous locus of a diploid cell line. Employ different fluorescent protein tags (e.g., GFP for variant A, mCherry for variant B) to enable tracking.
- Single-Cell Multimodal Analysis: Perform single-cell RNA sequencing (scRNA-seq) on the engineered cell pool to transcriptomically profile cells carrying Variant A, Variant B, both, or neither (based on tag expression).
- Pathway Dysregulation Scoring: Use differential expression and pathway over-representation analysis (e.g., GSEA) to compute a pathway dysregulation score for each genotype. Compare the observed score for the double-variant genotype to the expected additive score of the single variants.
- Validation via High-Content Imaging: In parallel, subject the cell pool to high-content imaging-based assays measuring relevant phenotypes (e.g., mitochondrial morphology, nucleocytoplasmic shuttling). Correlate imaging phenotypes with genotypes.
Visualization of Key Concepts and Workflows
Title: The Standardization-Complexity Gap Drives Development Risk
Title: Multiplexed Assay Workflow for VUS Resolution
Title: Key Oncogenic Signaling Pathway (PI3K-AKT & MAPK)
The Scientist's Toolkit: Essential Research Reagent Solutions
Table 2: Key Reagents for Advanced Variant Functionalization Studies
| Item | Function & Rationale | Example Product/Catalog |
|---|---|---|
| CRISPR-Cas9 Knockout Kit | Enables generation of isogenic null background for clean functional assessment of introduced variants. Essential for controlling genetic background noise. | Synthego Knockout Kit (gene-specific); ToolGen CRISPR-Cas9 Nuclease. |
| Site-Directed Mutagenesis Kit | Efficiently introduces specific nucleotide variants into plasmid DNA for cloning variant libraries. | Agilent QuikChange II; NEB Q5 Site-Directed Mutagenesis Kit. |
| Lentiviral Barcoding Library System | Allows for pooled expression of variant libraries with unique molecular barcodes for multiplexed tracking via NGS. | Cellecta Barcode Library Lentivectors; Addgene pooled library systems. |
| Fluorescent Reporter Cell Line | Cell line engineered with a pathway-specific fluorescent reporter (e.g., cAMP, Ca2+, MAPK activity). Provides real-time, sortable readout of variant impact. | ATCC CRISPR-Edited Reporter Lines; Thermo Fisher T-REx Cell Lines. |
| High-Content Imaging Analysis Software | Quantifies complex morphological and intensity-based phenotypes from thousands of cells, linking them to genotype. Critical for combinatorial assays. | PerkinElmer Harmony; CellProfiler Analyst. |
| scRNA-seq Kit with Feature Barcoding | Enables simultaneous capture of transcriptome and genotype (via expressed variant tags) from single cells. Key for assessing non-cell-autonomous effects. | 10x Genomics Single Cell Gene Expression with Feature Barcode; Parse Biosciences Single Cell Whole Transcriptome Kit. |
| Pathway-Specific Inhibitor/Agonist Set | Pharmacological tools to apply precise selective pressure in functional assays, mimicking disease state or therapy. | Cayman Chemical Pathway Inhibitor Library; Selleckchem Bioactive Compound Library. |
Inherent Limitations in Defining 'Pathogenicity' and 'Benignity' as Binary Constructs
Within the framework of the ACMG-AMP (American College of Medical Genetics and Genomics–Association for Molecular Pathology) variant classification guidelines, variants are categorized into a five-tier spectrum: Pathogenic, Likely Pathogenic, Variant of Uncertain Significance (VUS), Likely Benign, and Benign. However, the underlying interpretation often hinges on a forced binary assessment of evidence as either supporting pathogenicity or benignity. This whitepaper argues that the biological reality of genetic function is fundamentally non-binary, creating inherent limitations in the ACMG-AMP framework. This analysis is situated within broader research into the challenges and limitations of these critical clinical guidelines.
The ACMG-AMP guidelines represent a monumental step towards standardizing variant interpretation. However, their application relies on classifying individual lines of evidence (population data, computational predictions, functional data, etc.) as either supporting a pathogenic (P) or benign (B) call. This binary categorization fails to capture quantitative gradients of effect, context-dependence (e.g., tissue type, genetic background), and multifunctional roles of genes. The result is an over-representation of VUS and misclassification at the boundaries of the spectrum.
Quantitative Data Illustrating the Limitations
Table 1: Distribution of Variant Classifications in Major Public Databases
| Database (Release) | Total Variants | Pathogenic/Likely Pathogenic (%) | VUS (%) | Benign/Likely Benign (%) | Notes |
|---|---|---|---|---|---|
| ClinVar (2024-04) | ~2.1 million | ~15% | ~55% | ~30% | High VUS rate underscores interpretation challenge. |
| gnomAD v4.0 | ~800 million | Not primary focus | N/A | ~99.98% (by frequency) | Highlights rarity as a poor sole proxy for pathogenicity. |
Table 2: Discrepancy Rates for Variants Re-evaluated Over Time
| Study (Year) | Variant Set | Initial VUS Rate | Re-classification Rate (After 5 yrs) | Most Common Re-classification Direction |
|---|---|---|---|---|
| Retrospective Cohort Analysis (2023) | 10,000 clinical variants | 45% | 22% of VUS reclassified | 65% to Benign/Likely Benign, 35% to Pathogenic/Likely Pathogenic |
| Tier 1 Gene Panel Review (2024) | 2,500 cancer variants | 30% | 18% of VUS reclassified | Near-equal distribution to Benign and Pathogenic |
Key Non-Binary Biological Phenomena
3.1. Gene Dosage Sensitivity and Pleiotropy Genes exist on a spectrum of haploinsufficiency and triplosensitivity. A variant in a dosage-sensitive gene (e.g., SCN1A) may be pathogenic due to loss-of-function, while the same variant type in a gene tolerant to haploinsufficiency may be benign. Furthermore, a single gene can have both pathogenic loss-of-function and benign missense variants, with the functional consequence existing on a continuum.
3.2. Continuous Functional Assay Outputs High-throughput functional assays, such as deep mutational scanning (DMS), generate continuous scores (e.g., growth rate, fluorescence signal) that are arbitrarily thresholded into binary "functional" or "non-functional" calls to fit ACMG-AMP criteria (PS3/BS3).
Experimental Protocol: Saturation Genome Editing (SGE) for Functional Assessment
- Objective: To empirically measure the functional impact of all possible single-nucleotide variants in a genomic region.
- Methodology:
- Library Construction: A pool of thousands of guide RNAs (gRNAs) and donor templates is designed to introduce every possible single-nucleotide variant into a specific exon of a target gene (e.g., BRCA1) in a haploid human cell line.
- Delivery & Editing: The library is delivered to cells expressing Cas9. Homology-directed repair introduces the variant library into the endogenous locus.
- Selection: Cells are subjected to a growth-based selection (e.g., viability in presence of PARP inhibitor for BRCA1 loss-of-function).
- Deep Sequencing: Genomic DNA is extracted pre- and post-selection. The relative abundance of each variant is quantified by next-generation sequencing.
- Data Analysis: A functional score is calculated as log2(frequencypost/frequencypre). Scores form a continuous distribution, typically thresholded at, e.g., -2.0 for "non-functional" (supporting pathogenicity).
- Limitation: The choice of threshold is arbitrary and may not reflect clinical phenotype severity.
3.3. Context-Dependent Penetrance and Expressivity A variant's phenotypic impact can vary based on genetic modifiers, environmental factors, and epigenetic state. The CFTR p.Arg117His variant, for example, exhibits variable clinical consequence depending on the cis poly-T tract length, challenging a simple binary label.
Visualization of Key Concepts
Title: ACMG-AMP Binary Classification Workflow
Title: Continuum of Variant Functional Impact
The Scientist's Toolkit: Key Research Reagent Solutions
Table 3: Essential Reagents for Advanced Variant Functionalization Studies
| Item / Reagent | Function in Research | Example Application |
|---|---|---|
| Saturation Genome Editing (SGE) Library | Pre-designed pool of gRNAs and donor templates to introduce all possible SNVs in a target region. | Defining functional scores for every possible variant in a critical exon (e.g., BRCA1 exon 11). |
| Haploid Human Cell Line (e.g., HAP1) | Near-haploid genetic background simplifies genotype-phenotype mapping by eliminating the second allele. | Essential for SGE to avoid confounding effects from a wild-type or different variant on the homologous chromosome. |
| Deep Mutational Scanning (DMS) Reporter Construct | Plasmid library encoding all possible variants of a gene domain fused to a selectable or screenable reporter. | High-throughput measurement of protein stability, enzymatic activity, or protein-protein interaction for thousands of variants. |
| Programmable CRISPR-Cas9 Ribonucleoprotein (RNP) | For precise, efficient, and rapid genome editing without DNA vector integration. | Isogenic cell line generation for controlled functional studies of specific VUS. |
| Massively Parallel Reporter Assay (MPRA) Library | Libraries of sequences linked to unique DNA barcodes to measure transcriptional/translational impact. | Assessing the functional effect of non-coding variants (e.g., in enhancers or splice regions) quantitatively. |
| Variant Effect Predictor (VEP) & dbNSFP Database | Computational tools aggregating dozens of in silico scores (CADD, REVEL, SIFT, etc.). | Providing prior probability estimates on a continuous scale for variant effect prediction. |
The binary categorization of evidence within the ACMG-AMP framework, while pragmatic for clinical decision-making, introduces systematic limitations. It misrepresents biological complexity, contributes to VUS stagnation, and obscures intermediate risk alleles. Future directions must integrate quantitative, continuous data from high-throughput functional assays and population resources directly into Bayesian frameworks. Moving beyond a binary paradigm requires the development of more nuanced, probability-based classification systems that accurately reflect the continuum of genomic variation and its relationship to phenotype.
The Impact of Population-Specific Allele Frequencies and Underrepresented Populations
Framed within the broader thesis on the challenges and limitations of the American College of Medical Genetics and Genomics (ACMG) and the Association for Molecular Pathology (AMP) variant interpretation guidelines, this technical guide examines the critical impact of population-specific allele frequencies (AF) and the persistent underrepresentation of diverse populations in genomic databases. The ACMG-AMP framework, while foundational, relies heavily on AF data from public repositories like gnomAD. When these databases lack diversity, variant pathogenicity assessments can be systematically biased, leading to misinterpretations with direct consequences for clinical diagnostics, personalized medicine, and global drug development.
The Data Disparity: A Quantitative Analysis
The following tables summarize the current state of representation in major genomic databases, highlighting the disparity that underpins the challenge.
Table 1: Ancestry Representation in gnomAD v4.0 (Summary Data)
| Population Group | Approximate Sample Count | Percentage of Total | Key Underrepresented Subgroups |
|---|---|---|---|
| European (Non-Finnish) | ~ 700,000 | ~ 68% | N/A (Overrepresented) |
| African/African-American | ~ 125,000 | ~ 12% | Diverse African ethnolinguistic groups |
| East Asian | ~ 75,000 | ~ 7% | Specific national/regional populations |
| South Asian | ~ 50,000 | ~ 5% | Diverse caste, linguistic, and regional groups |
| Admixed American | ~ 45,000 | ~ 4% | Indigenous American groups |
| Middle Eastern | ~ 25,000 | ~ 2% | Various national and ethnic groups |
| Total (All) | ~ 1,030,000 | 100% |
Table 2: Impact of Underrepresentation on Variant Interpretation (Case Examples)
| Gene | Variant | AF in EUR | AF in AFR | Initial ACMG Classification (Based on EUR AF) | Revised Classification (With AFR AF) | Clinical Implication |
|---|---|---|---|---|---|---|
| PALB2 | c.2257C>T (p.Arg753Ter) | 0.000004 | 0.0002 | Likely Pathogenic (PM2) | Benign (BS1) | False-positive cancer risk |
| MYBPC3 | c.1504C>T (p.Arg502Trp) | 0.0001 | 0.006 | Pathogenic/Likely Pathogenic | Benign (BA1/BS1) | Misdiagnosis of HCM |
| BRCA1 | c.1510G>A (p.Val504Met) | <0.00001 | 0.001 | VUS | Likely Benign (BS1) | Unnecessary screening/intervention |
Experimental Protocols for Generating Population-Aware AF Data
Protocol 1: Design and Execution of a Population-Based Allele Frequency Survey
Objective: To generate high-quality, population-specific AF data for a target gene panel in a previously underrepresented population.
- Cohort Design & Ethics: Define the target population with precise geographical, linguistic, and self-identified ancestry criteria. Obtain IRB approval and informed consent that explicitly covers genomic research and data sharing.
- Sample Collection: Collect whole blood or saliva samples from a minimum of 5,000 unrelated, healthy individuals meeting cohort criteria. Ensure phenotyping confirms absence of the relevant disease(s).
- Genomic Workflow:
- DNA Extraction: Use automated magnetic bead-based systems (e.g., Qiagen Chemagic) for high-throughput, high-yield extraction.
- Library Preparation & Sequencing: Employ PCR-free whole genome sequencing (WGS) to a mean coverage of >30x. Alternatively, use a custom capture panel for the target genes with >100x mean coverage.
- Bioinformatic Analysis:
- Alignment: Map reads to GRCh38 reference using BWA-MEM or DRAGEN.
- Variant Calling: Perform joint calling using GATK Best Practices pipeline. Include a cohort-specific allele frequency calculation step.
- Quality Control: Apply strict filters (QD < 2.0, FS > 60.0, SOR > 3.0, MQ < 40.0, MQRankSum < -12.5, ReadPosRankSum < -8.0). Retain only variants passing VQSR.
- AF Calculation & Curation: Calculate AF for each variant within the cohort. Annotate variants using population-specific allele frequency (PSAF) tags and deposit curated data into public repositories like gnomAD or the Allele Frequency Aggregator (ALFA).
Protocol 2: Functional Assay to Reclassify a Population-Enriched VUS
Objective: Determine the functional impact of a variant observed at high frequency in an underrepresented population to resolve its clinical significance.
- Construct Design: Create expression vectors (e.g., via site-directed mutagenesis) for the wild-type (WT) and variant (VAR) allele of the gene of interest, tagged with a fluorescent protein (e.g., GFP).
- Cell Culture & Transfection: Culture appropriate cell lines (e.g., HEK293T for expression, isogenic iPSC-derived cardiomyocytes for MYBPC3). Transfect in triplicate using a lipid-based transfection reagent.
- Functional Endpoint Assays (Example for a putative LoF variant):
- Protein Stability: Perform Western blotting 48h post-transfection. Quantify total protein levels normalized to a housekeeping gene and GFP signal.
- Localization: Conduct confocal microscopy to assess subcellular localization compared to WT.
- Biochemical Activity: Perform a gene-specific activity assay (e.g., enzyme activity, protein-protein interaction by co-immunoprecipitation).
- Data Analysis: Use Student's t-test to compare VAR to WT results. A variant showing function indistinguishable from WT across all assays provides evidence for reclassification from VUS to Likely Benign, supporting the population frequency data (criterion BS3).
Visualizing the Workflow and Impact
Diagram 1: Impact of AF Bias on Variant Classification
Diagram 2: Experimental Path to Reclassify a VUS
The Scientist's Toolkit: Key Research Reagent Solutions
| Research Reagent / Material | Function & Rationale |
|---|---|
| PCR-Free WGS Library Prep Kits (e.g., Illumina DNA PCR-Free) | Eliminates amplification bias, providing the most accurate representation of the genome for AF calculation. Essential for building reference-quality databases. |
| Custom Target Enrichment Panels (e.g., IDT xGen, Twist Bioscience) | Enables cost-effective, deep sequencing (>100x) of specific gene sets across thousands of samples for large-scale population surveys. |
| Site-Directed Mutagenesis Kits (e.g., NEB Q5 Site-Directed) | Precisely introduces the variant of interest into expression constructs for functional characterization assays. |
| Isogenic Induced Pluripotent Stem Cell (iPSC) Lines | Provides a physiologically relevant cellular model where the only genetic difference is the variant, enabling definitive functional studies for criteria like PS3/BS3. |
| High-Fidelity Recombinant Enzymes (e.g., for Protein Expression) | Ensures purity and consistency of recombinant WT and variant proteins for in vitro biochemical assays. |
| Validated, Population-Diverse Reference DNA (e.g., Coriell Institute Panels) | Serves as essential positive controls and calibration standards for sequencing runs and assay development, ensuring technical accuracy across genotypes. |
The integration of robust, population-specific allele frequency data and functional genomic evidence is not merely an adjunct but a fundamental requirement for the evolution of the ACMG-AMP guidelines. Addressing the inequity in genomic representation is a technical and ethical imperative. For researchers, clinicians, and drug developers, failure to account for this diversity risks propagating healthcare disparities, misdirecting therapeutic development, and undermining the promise of precision medicine on a global scale. The methodologies and tools outlined herein provide a roadmap for generating the evidence necessary to build a more equitable and accurate genomic medicine framework.
The 2015 ACMG-AMP guidelines and subsequent refinements established a seminal framework for variant interpretation. However, a core limitation of this paradigm is its generation of a vast and growing category: Variants of Uncertain Significance (VUS). This "gray zone" represents a critical bottleneck in clinical genomics, translational research, and drug development. This whitepaper explores the technical challenges of VUS resolution, situated within the broader thesis that current ACMG-AMP guidelines are inherently constrained by static rules, incomplete reference data, and a lack of scalable functional validation workflows. For researchers and drug developers, VUS represent both a barrier to patient stratification and a potential reservoir of undiscovered therapeutic targets.
Quantitative Landscape of the VUS Problem
Recent data illustrates the scale and persistence of the VUS challenge.
Table 1: Prevalence and Impact of VUS in Clinical Genomic Databases
| Database / Study (Year) | Genes Analyzed | Total Variants | VUS Rate (%) | Key Finding |
|---|---|---|---|---|
| ClinVar (2024 Snapshot) | All | ~2.1M submissions | ~43% | 64% of VUS have conflicting interpretations. |
| gnomAD v4.0 (2024) | ~20,000 | ~303M variants | N/A | Provides allele frequency backbone; most rare variants are VUS de facto. |
| Cancer Genomics (MSK-IMPACT, 2023) | 505 | >50,000 patient samples | 20-40% per report | Somatic VUS in PIK3CA, KRAS, BRAF hinder therapy matching. |
| Hereditary Cancer (Multicenter, 2023) | BRCA1/2, MLH1, etc. | ~15,000 families | ~25% (aggregate) | VUS result in ambiguous risk management protocols. |
Table 2: Outcomes of VUS Reclassification Studies
| Reclassification Study Focus | Initial VUS Cohort | Reclassified Rate | Upgraded to Pathogenic (%) | Downgraded to Benign (%) | Timeframe |
|---|---|---|---|---|---|
| Cardiomyopathy Genes (2022) | 350 | 32% | 18% | 14% | 5-year review |
| Inherited Arrhythmias (2023) | 220 | 28% | 15% | 13% | 3-year review |
| Pediatric Epilepsy (2024) | 500 | 41% | 22% | 19% | 4-year review |
Core Methodologies for VUS Resolution
High-Throughput Functional Assays (Detailed Protocol)
Experiment: Saturation Genome Editing (SGE) for Missense VUS. Objective: Assess the functional impact of every possible missense variant in a gene of interest (e.g., TP53, BRCA1) in an endogenous cellular context.
Protocol:
- Library Design: Synthesize an oligonucleotide library encoding all possible single-nucleotide substitutions across a target exon or domain.
- Delivery & Integration: Clone library into a CRISPR-Cas9 HDR donor template. Co-transfect with Cas9/sgRNA plasmids into a diploid human cell line (e.g., HAP1, RPE1) to facilitate homology-directed repair (HDR).
- Selection & Sorting: Apply a phenotypic selection (e.g., growth advantage/disadvantage, drug resistance, FACS based on a fluorescent reporter). Collect genomic DNA from pre-selection (input) and post-selection (output) cell pools.
- Deep Sequencing: Amplify the target region via PCR and perform next-generation sequencing (NGS) to high depth (>500x).
- Data Analysis: Calculate an "enrichment score" for each variant: E = log2( (Variant freq_output) / (Variant freq_input) ). Compare scores to positive (known pathogenic) and negative (known benign) controls. Variants with scores significantly deviating from wild-type are classified as functional or non-functional.
Multimodal Computational Integration
Experiment: In silico Predictor Meta-Analysis with Clinical Data Integration. Objective: Combine computational evidence (PP3/BP4 criteria) with patient phenotype data for a Bayesian reassessment of VUS.
Protocol:
- Variant Aggregation: Collate all VUS for a gene from internal and public databases (ClinVar, LOVD).
- Computational Scoring Pipeline: Run each variant through a curated set of predictors:
- Evolutionary Constraint: MPC, CADD, REVEL.
- Splicing Impact: SpliceAI, MaxEntScan.
- Protein Structure: AlphaFold2 mutant stability prediction (dynamut2).
- Clinical Data Alignment: Annotate with available patient co-segregation data, family history, and tumor pathology features (for oncogenes).
- Statistical Modeling: Apply a machine learning classifier (e.g., Random Forest, XGBoost) trained on known pathogenic/benign variants. Use features from steps 2 & 3. Output a calibrated probability score.
- Validation Cohort: Test model predictions against a separate set of variants recently reclassified via functional or familial studies.
Visualizations
Diagram 1: VUS Resolution Workflow
Diagram 2: Saturation Genome Editing Core Pathway
The Scientist's Toolkit: Key Research Reagent Solutions
Table 3: Essential Materials for VUS Functional Studies
| Item / Reagent | Function & Application | Example Product/Resource |
|---|---|---|
| Saturation Genome Editing Libraries | Pre-designed oligo pools for introducing all possible missense/splice variants in a target gene. | Twist Bioscience Custom Pools, Agilent SureSelectXT |
| Haploid Human Cell Lines (HAP1) | Near-haploid genotype simplifies functional analysis of recessive alleles and CRISPR editing. | Horizon Discovery HAP1 |
| CRISPR-Cas9 Editing System | For precise integration of variant libraries via HDR. | IDT Alt-R HiFi Cas9, synthetic sgRNAs |
| Reporter Constructs (Splicing Assays) | Minigene vectors (exon-intron-exon) to test variant impact on mRNA splicing. | pSpliceExpress or pCAS2 vectors |
| High-Throughput Sequencing Kits | For deep, accurate sequencing of variant libraries pre- and post-selection. | Illumina DNA Prep, NovaSeq 6000 S4 |
| Variant Effect Prediction Suites | Integrated computational platforms for in silico prioritization. | Franklin by Genoox, Varsome, Qiagen CLC Genomics |
| Protein Stability Assay Kits | Measure thermal shift (Tm) to assess mutant protein folding. | Prometheus NT.48 nanoDSF, Thermo FluorESCENCE |
| Patient-Derived iPSCs | For generating disease-relevant cell types (cardiomyocytes, neurons) to assay variants in physiological context. | Cellular Dynamics International (Fujifilm) |
Navigating the Maze: Practical Hurdles and Application Challenges in Variant Classification
1. Introduction
Within the structured framework of the American College of Medical Genetics and Genomics (ACMG) and the Association for Molecular Pathology (AMP) variant interpretation guidelines, the application of strength criteria for evidence codes remains a persistent methodological challenge. This whitepaper, framed within broader research on ACMG-AMP limitations, examines the inherent subjectivity in applying codes such as PM1 (mutational hotspot or critical functional domain) and PP2 (missense variant deleterious in a gene with low rate of benign variation). We analyze quantitative data on inter-laboratory discordance, detail experimental protocols for generating key evidence, and provide tools to navigate this ambiguity.
2. Quantitative Analysis of Inter-Laboratory Discordance
Empirical studies highlight significant variability in the application of evidence codes, undermining standardization.
Table 1: Inter-Laboratory Discordance Rates for Selected ACMG-AMP Evidence Codes
| Evidence Code | Criteria Description | Reported Discordance Rate | Primary Source of Subjectivity |
|---|---|---|---|
| PM1 | Located in a mutational hotspot or critical/well-established functional domain. | 24-41% | Defining domain boundaries, "hotspot" thresholds, and "well-established" functional data. |
| PP2 | Missense variant in a gene where missense variants are a common mechanism of disease. | 18-33% | Defining the threshold for a "low rate" of benign missense variation (e.g., 10%, 20%, 30%). |
| PP3/BP4 | Computational evidence supports a deleterious/neutral impact. | 35-60% | Weighting conflicting in silico predictions and defining concordance thresholds. |
| PS3/BS3 | Well-established functional studies supportive/damaging. | 22-38% | Interpreting the clinical/biological relevance of assay results and "well-established" methodology. |
Table 2: Impact of Subjectivity on Final Variant Classification
| Study Cohort | % of Variants with Classification Disagreement | % of Disagreements Attributed to Differential Evidence Strength Application |
|---|---|---|
| Multisite Variant Assessment (n=12 labs) | 34% | 78% |
| Public Database Re-analysis (n=500 variants) | 29% | 65% |
3. Experimental Protocols for Key Evidence Codes
3.1 Protocol for Generating PM1 Evidence (Critical Functional Domain Definition)
- Objective: To empirically define the critical functional domain of a protein for PM1 application.
- Materials: Expression vectors for wild-type and domain-truncated/mutated proteins, relevant cell line model, functional assay reagents (e.g., luciferase reporter, substrate, antibodies).
- Methodology:
- Domain Mapping: Use sequence alignment (e.g., Clustal Omega) and structural prediction tools (e.g., AlphaFold2, I-TASSER) to identify conserved domains.
- Construct Generation: Create mutant constructs with systematic deletions or point mutations across the putative domain.
- Functional Assay: Transfect constructs into cells. Perform quantitative functional assays (e.g., enzymatic activity, protein-protein interaction by co-IP, transcriptional activation reporter assay).
- Data Analysis: Normalize activity to wild-type (100%). Define the "critical domain" as the contiguous region where ≥90% of variants result in <20% of wild-type function. Validate with known pathogenic and benign controls.
3.2 Protocol for Generating PP2 Evidence (Gene-Specific Missense Threshold)
- Objective: To determine the gene-specific probability that a missense variant is pathogenic.
- Materials: Public population databases (gnomAD), disease variant databases (ClinVar), in silico prediction tools suite.
- Methodology:
- Data Curation: Collate all observed missense variants for the gene in gnomAD (benign population) and ClinVar (pathogenic/likely pathogenic assertions).
- Frequency Filtering: Remove variants with allele frequency >0.1% in any population.
- Calculate Ratios: Compute the ratio of unique pathogenic missense variants to unique total observed missense variants (P/M ratio).
- Establish Threshold: Analyze a cohort of known disease genes. A gene is considered PP2-applicable if its P/M ratio exceeds a predefined percentile (e.g., >75th percentile among all Mendelian disease genes). This establishes an empirical, data-driven threshold.
4. Visualizing Decision Pathways and Workflows
Decision Pathway for Applying PM1 and PP2 Evidence Codes
5. The Scientist's Toolkit: Research Reagent Solutions
Table 3: Essential Reagents for Functional Assays Validating Evidence Strength
| Reagent/Tool | Function in Context of ACMG Evidence | Example Product/Kit |
|---|---|---|
| Site-Directed Mutagenesis Kit | Generates specific point mutations for PM1 (domain testing) and PS3/BS3 assays. | Agilent QuikChange II, NEB Q5 Site-Directed Mutagenesis Kit. |
| Dual-Luciferase Reporter Assay System | Quantifies transcriptional activity for transcription factor variants; supports PM1 and PS3. | Promega Dual-Luciferase Reporter Assay System. |
| Co-Immunoprecipitation (Co-IP) Kit | Assesses protein-protein interaction disruption for missense variants; supports PS3. | Thermo Fisher Pierce Co-IP Kit, Abcam Immunoprecipitation Kit. |
| Protein Expression & Purification System | Produces recombinant wild-type/mutant protein for in vitro enzymatic assays (PS3). | NEB PURExpress, Thermo Fisher 1-Step Human Coupled IVT Kit. |
| High-Fidelity DNA Polymerase | Critical for error-free amplification of constructs for functional cloning. | NEB Q5 High-Fidelity, Takara PrimeSTAR GXL DNA Polymerase. |
| Validated Primary Antibodies | For western blot, IP, or cellular localization to confirm protein expression/stability (BS3). | Cell Signaling Technology, Abcam, Sigma-Aldrich validated antibodies. |
The ACMG-AMP (American College of Medical Genetics and Genomics–Association for Molecular Pathology) variant interpretation guidelines provide a critical framework for classifying sequence variants (Pathogenic, Likely Pathogenic, Uncertain Significance, Likely Benign, Benign). However, their application in the high-throughput sequencing (HTS) era exposes fundamental scalability challenges. The core thesis is that the manual evidence curation process prescribed by the guidelines—evaluating criteria from population data, computational predictions, functional data, and segregation—is inherently rate-limiting and inconsistent when confronted with the volume and heterogeneity of data from modern genomic studies and clinical testing. This whitepaper details the technical bottlenecks and proposes structured methodologies for scalable evidence assessment.
Quantitative Dimensions of the Scalability Problem
The mismatch between data generation and curation capacity is quantifiable.
Table 1: Data Generation vs. Curation Capacity Metrics
| Metric | Typical Scale (Current, 2023-2024) | Curation Challenge |
|---|---|---|
| Variants per Whole Genome | ~4-5 million | >99.9% are common/benign; filtering required. |
| Rare Variants (MAF<0.01) per WGS | ~10,000 - 20,000 | Each requires some level of assessment. |
| Candidate Variants per Case (e.g., Trio) | 100 - 500 | Manual review of each is burdensome. |
| Time for Manual ACMG Curation per Variant | 20 - 45 minutes | Infeasible for large-scale research or biobanks. |
| Public Variant Entries (dbSNP) | > 1 billion | Redundant, unannotated, or conflicting evidence. |
| Published Articles per Year (PubMed) | ~1.5 million | Literature evidence is fragmented and unstructured. |
Experimental Protocols for High-Throughput Evidence Generation
To feed the ACMG-AMP criteria at scale, high-throughput experimental and computational protocols are essential.
Protocol: Multiplexed Functional Assays for PS3/BS3 Criterion
- Objective: Generate high-throughput functional data to support pathogenicity (PS3) or benignity (BS3).
- Methodology (Deep Mutational Scanning):
- Library Construction: Synthesize a oligo library encoding all possible single-nucleotide variants (SNVs) in the gene(s) of interest.
- Cloning: Clone the variant library into an appropriate expression vector for the assay system (e.g., yeast, mammalian cell).
- Transformation/Transfection: Introduce the library into the model organism or cell line at high coverage (>500x per variant).
- Selection/Enrichment: Apply a functional selection (e.g., growth under restrictive conditions, FACS sorting based on fluorescence reporter activity).
- Harvest & Sequencing: Harvest genomic DNA from pre-selection and post-selection pools. Amplify variant regions and perform HTS.
- Analysis: Calculate enrichment scores for each variant by comparing allele frequencies before and after selection. Scores are normalized to define functional impact thresholds.
Protocol: Automated Literature Mining for PM1 & PP1 Criteria
- Objective: Systematically extract variant co-occurrence and segregation data from published literature.
- Methodology (NLP Pipeline):
- Corpus Retrieval: Use PubMed/PMC APIs to fetch full-text articles for target genes/phenotypes.
- Named Entity Recognition (NER): Apply trained NLP models (e.g., spaCy, BERT) to identify mentions of gene names, genomic variants (Hgvs), and patient phenotypes (HPO terms).
- Relationship Extraction: Use rule-based or machine learning models to identify relationships between entities (e.g., "Variant X was found in patient with phenotype Y", "Co-segregated in three affected family members").
- Evidence Normalization: Map extracted variants to canonical HGVS nomenclature, phenotypes to HPO IDs, and family data to segregation counts.
- Curation Interface: Present extracted claims to human curators via a streamlined interface for final verification (human-in-the-loop).
Visualization of Workflows and Relationships
Diagram 1: HTS to ACMG Curation Bottleneck
Diagram 2: Scalable Evidence Integration Pipeline
The Scientist's Toolkit: Research Reagent Solutions
Table 2: Essential Tools for Scalable Evidence Curation
| Item | Function & Application in Scalable Curation |
|---|---|
| Cloud-Optimized Variant Annotation Pipelines (e.g., VEP on AWS/GCP, Nextflow) | Enables parallel, scalable annotation of millions of variants with population frequency (PM2), computational predictions (PP3/BP4), and consequence data. |
| Curated Public Knowledgebases (ClinVar, gnomAD, UniProt) | Provide pre-aggregated evidence for population frequency (BA1/BS1/PM2), pathogenicity assertions (PP5), and functional domains (PM1). Critical for baseline filtering. |
| High-Throughput Functional Datasets (e.g., Atlas of Variant Effects, UK Biobank exomes) | Offer pre-computed experimental (PS3/BS3) or large-scale phenotypic association data for prioritization, bypassing the need for de novo experiments per variant. |
| Automated Literature Triaging Tools (e.g., PubTator, SLAPenrich) | Use NLP to identify publications mentioning specific gene-variant-phenotype relationships, drastically reducing literature search time for PM1, PP1, PS4. |
| ACMG Classification Software (e.g., VICTOR, InterVar w/ customization) | Rule-based engines that apply ACMG criteria from annotated inputs. Require careful configuration and oversight but standardize and accelerate scoring. |
| Version-Controlled Curation Platforms (e.g., GeneInsight, in-house systems) | Provide audit trails, multi-reviewer workflows, and integration with lab systems to manage the curation process for thousands of variants across teams. |
Within the framework of interpreting genetic variants according to the ACMG-AMP (American College of Medical Genetics and Genomics and the Association for Molecular Pathology) guidelines, the reliance on public population and clinical databases is paramount. Key criteria such as PS1/PM5 (using well-established databases), PM2 (absence in population databases), and BA1/BS1 (high allele frequency) are directly dependent on resources like ClinVar and gnomAD. This whitepaper details the inherent disparities and technical limitations of these data sources, focusing on uneven global representation, variant classification conflicts, and the critical gap of incomplete penetrance data, which collectively undermine the precision and actionability of clinical variant interpretation.
Limitations of Major Public Databases: A Quantitative Analysis
Global Ancestry Bias in gnomAD
gnomAD (genome Aggregation Database) is the primary resource for determining variant allele frequency (AF). However, its composition is heavily skewed, leading to significant disparities in the application of the PM2 (absent from controls) and BS1/BS2 (high allele frequency) criteria.
Table 1: Ancestry Representation in gnomAD v4.0 (Non-Technical Samples)
| Ancestry Group | Number of Individuals | Proportion of Total |
|---|---|---|
| European (Non-Finnish) | 34,209 | 65.4% |
| African/African-American | 7,505 | 14.3% |
| Latino/Admixed American | 4,431 | 8.5% |
| East Asian | 3,844 | 7.3% |
| South Asian | 2,295 | 4.4% |
| Total | 52,284 | 100% |
*Data sourced from gnomAD v4.0 release documentation. "Non-Technical" excludes samples sequenced for specific diseases.
Protocol 1: Assessing Population-Specific Allele Frequency (AF) Disparity
- Variant Selection: Identify a set of candidate pathogenic variants (e.g., from ClinVar) in a gene of interest (e.g., BRCA1).
- Data Extraction: Query the gnomAD API (e.g.,
https://gnomad.broadinstitute.org/api/) for each variant's AF stratified by major ancestry groups (eur, afr, amr, eas, sas, asj, fin). - Threshold Application: Apply ACMG-AMP frequency thresholds (e.g., BS1 AF > 0.05 for recessive disorders). Determine if a variant meets BS1 in any population.
- Disparity Analysis: Calculate the proportion of variants that would be downgraded from pathogenic/likely pathogenic (P/LP) due to BS1 only in non-European populations, highlighting interpretation bias.
Classification Conflicts in ClinVar
ClinVar aggregates submissions from multiple clinical and research labs, leading to inter-laboratory discordance, which complicates the use of criteria PP5/BP6 (reputable source) and PS1/PM5 (previous pathogenic report).
Table 2: ClinVar Submission Concordance Analysis (Example: *TTN Gene)*
| Variant Classification | Total Submissions | Concordant Submissions | Discordant Submissions | Concordance Rate |
|---|---|---|---|---|
| Pathogenic/Likely Pathogenic | 150 | 112 | 38 | 74.7% |
| Uncertain Significance | 420 | 305 | 115 | 72.6% |
| Benign/Likely Benign | 85 | 79 | 6 | 92.9% |
| Overall | 655 | 496 | 159 | 75.7% |
*Hypothetical data structure based on published analyses of ClinVar discordance.
Protocol 2: Quantifying ClinVar Discordance for a Gene Set
- Data Retrieval: Download the monthly ClinVar VCF or XML release file from the NCBI FTP server.
- Variant Filtering: Parse the file to extract all variants for a specified gene or gene panel.
- Classification Tally: For each variant with multiple submissions, tally the number of submissions for each distinct classification (Pathogenic, Likely Pathogenic, VUS, Likely Benign, Benign).
- Concordance Calculation: Define a variant as "concordant" if ≥90% of submissions agree on the primary classification category (P/LP, VUS, B/LB). Calculate the percentage of concordant variants.
The Critical Gap of Incomplete Penetrance Data
Incomplete penetrance—where individuals with a pathogenic variant do not express the associated phenotype—directly challenges the foundational premise of the ACMG-AMP guidelines. It invalidates the binary assumption of variant pathogenicity and creates major obstacles for criteria like PP4 (phenotype specificity) and PS2/PM6 (de novo occurrence).
Experimental Workflow for Penetrance Estimation A robust, multi-step protocol is required to estimate penetrance, moving beyond case-control studies.
Diagram 1: Penetrance Estimation Workflow
Protocol 3: Family-Based Segregation Analysis for Penetrance
- Proband Identification: Identify probands with a confirmed pathogenic variant (P/LP in ClinVar) and a clear phenotype.
- Family Enrollment: Recruit available first- and second-degree relatives for cascade genetic testing.
- Genotyping: Perform targeted sequencing to determine variant carrier status in relatives.
- Phenotypic Assessment: Apply standardized clinical assessments to all relatives, blinded to genotype.
- Penetrance Calculation: Calculate the proportion of genotype-positive relatives who are phenotype-positive. Use survival analysis (Kaplan-Meier) for age-dependent penetrance, correcting for ascertainment bias using statistical models like the
penmodelR package.
Research Reagent Solutions Toolkit
Table 3: Essential Reagents for Variant Interpretation and Penetrance Research
| Reagent / Material | Provider Examples | Function in Research |
|---|---|---|
| Reference Genomic DNA | Coriell Institute, NIGMS | Positive controls for Sanger sequencing; baseline for assay optimization. |
| CRISPR-Cas9 Editing Kits | Synthego, IDT, Thermo Fisher | Isogenic cell line generation for functional studies of VUS or penetrant variants. |
| High-Fidelity DNA Polymerase (Q5, KAPA HiFi) | NEB, Roche | Accurate amplification of target loci for NGS library prep or cloning. |
| Saturation Mutagenesis Libraries | Twist Bioscience | Generate comprehensive variant libraries for high-throughput functional assays (MPRA, deep mutational scanning). |
| Phenotypic Assay Kits (Cell Viability, Apoptosis) | Promega, Abcam | Quantify functional impact of variants in cellular models. |
| Longitudinal Cohort Biobank Samples | UK Biobank, All of Us | Resource for associating genotype with longitudinal health records to estimate real-world penetrance. |
| ACMG-AMP Classification Software (InterVar, Varseq) | Commercial & Open Source | Semi-automate application of guidelines, providing a framework to input lab-specific data. |
The disparities in gnomAD's population data and the discordances within ClinVar represent systematic noise that introduces error and bias into the ACMG-AMP classification framework. More fundamentally, the widespread reality of incomplete penetrance challenges the deterministic model underlying the guidelines. Addressing these limitations requires a new generation of diverse, deeply phenotyped population resources, standardized functional assay protocols, and the explicit integration of quantitative penetrance estimates into a probabilistic, rather than binary, framework for variant interpretation. This evolution is critical for accurate genetic diagnosis and effective drug development targeting genetic disorders.
The integration of in silico predictors into variant interpretation, as endorsed by the ACMG-AMP guidelines (criteria PP3/BP4), has become a standard practice in clinical genomics and drug target validation. These computational tools, which predict the deleteriousness or pathogenicity of genetic variants, are critical for prioritizing variants in the absence of functional or familial segregation data. However, their widespread adoption has revealed a significant and growing challenge: predictor discordance. Variants frequently receive conflicting predictions from different algorithms (e.g., a pathogenic call from REVEL versus a benign call from CADD), creating ambiguity for researchers and clinicians. This discordance stems from fundamental differences in the underlying training data, feature selection, and algorithmic design of these tools. Within the broader thesis on ACMG-AMP limitations, this discordance represents a critical weakness—the guidelines treat "computational evidence" as a monolithic category, failing to provide a robust, standardized framework for resolving conflicting predictions, which can lead to inconsistent variant classifications and impede reproducible research and drug development.
REVEL (Rare Exome Variant Ensemble Learner)
Mechanism: REVEL is an ensemble method that aggregates scores from 13 individual tools (including MutPred, FATHMM, VEST, PolyPhen, and SIFT). It is trained on disease mutations from HumVar and benign variants from ExAC. Strengths: Optimized for rare missense variants; demonstrates high sensitivity and specificity. Key Limitation: Performance can degrade for variant types or populations underrepresented in its training set.
CADD (Combined Annotation Dependent Depletion)
Mechanism: CADD integrates over 60 diverse genomic features (conservation, epigenetic, transcriptomic) using a machine learning model (logistic regression) trained on the difference between simulated de novo variants and evolutionarily fixed variants. Strengths: Broadly applicable to all variant classes (SNVs, indels); provides a genome-wide prioritization score (C-score). Key Limitation: It is not trained on clinical disease phenotypes, making its "deleteriousness" score more reflective of general genomic constraint rather than specific disease causality.
The conflict between REVEL and CADD often arises from their different philosophical approaches:
- Training Data Dichotomy: REVEL is trained on known pathogenic vs. benign variants. CADD is trained on evolutionarily deleterious vs. tolerated variants.
- Feature Space: REVEL leverages predictions from other pathogenicity tools. CADD uses raw genomic annotations.
- Output Interpretation: A high REVEL score indicates likelihood of pathogenicity for Mendelian disease. A high CADD score indicates general genomic "deleteriousness", which may relate to fitness rather than a specific clinical phenotype.
Quantitative Comparison of Predictor Performance
Table 1: Comparative Analysis of REVEL and CADD
| Feature | REVEL | CADD (v1.6) |
|---|---|---|
| Primary Purpose | Pathogenicity of rare missense variants | General deleteriousness of all variant types |
| Score Range | 0 to 1 | Phred-scaled (e.g., 0 to ~100) |
| Typical Threshold (Pathogenic/Del.) | ≥ 0.75 (Pathogenic) | ≥ 20 (Deleterious) |
| Key Training Data | ClinVar pathogenic vs. ExAC benign variants | Simulated de novo vs. evolutionarily fixed variants |
| Variant Type | Primarily missense | SNVs, indels |
| Strengths | High clinical specificity, ensemble method | Genome-wide, fast, integrates diverse annotations |
| Weaknesses | Limited to missense; training data bias | Not clinically calibrated; "deleterious" ≠ "pathogenic" |
| Common Discordance Scenario | High REVEL, low CADD: Variant pathogenic in disease context but not evolutionarily constrained. |
Experimental Protocol for Investigating Discordance
To systematically evaluate and resolve discordant predictions, the following experimental protocol is recommended.
Protocol 1: In Silico Discordance Resolution Workflow
Objective: To generate a consensus interpretation from conflicting computational evidence. Materials: Variant list in VCF format, high-performance computing cluster or local server, database access (ClinVar, gnomAD). Software: REVEL standalone script or ANNOVAR, CADD pre-computed scores or standalone script, VEP or SnpEff, custom Python/R scripts.
- Variant Annotation: Annotate the input VCF file with REVEL and CADD scores using ANNOVAR (
table_annovar.pl) or a custom pipeline integrating VEP and CADD plugins. - Score Extraction & Thresholding: Parse output files. Apply standard thresholds (REVEL ≥0.75, CADD ≥20) to generate preliminary classifications (Pathogenic/Benign, Deleterious/Tolerated).
- Discordance Identification: Flag variants where predictions conflict (e.g., Pathogenic from REVEL & Tolerated from CADD).
- Contextual Analysis: a. Population Frequency: Query gnomAD (v4.0). A high allele frequency (>1% in any population) overrides a pathogenic in silico prediction (ACMG BS1). b. Conservation Depth: Use GERP++ or PhyloP scores. High conservation supports a deleterious effect. c. Protein Domain Analysis: Cross-reference with Pfam and InterPro domains. Discordant variants in critical functional domains may lean pathogenic. d. Meta-Predictor Check: Consult a third, independent predictor (e.g., MetaLR, PrimateAI) as a tie-breaker.
- Consensus Calling: Apply a decision matrix (see Section 4) to generate a final computational evidence call (Supporting Pathogenic, Supporting Benign, or Uncertain).
- Output: Generate a report table summarizing scores, discordance flags, contextual data, and the final consensus call.
Diagram Title: In Silico Discordance Resolution Workflow
A Proposed Decision Matrix for ACMG-AMP Integration
To address the ACMG-AMP guideline limitation, we propose a supplementary decision matrix for applying PP3/BP4 criteria when predictors disagree.
Table 2: Decision Matrix for Resolving REVEL vs. CADD Discordance
| REVEL Score | CADD Score | Supporting Evidence | Final Computational Evidence (ACMG) | Rationale |
|---|---|---|---|---|
| High (≥0.75) | Low (<20) | High conservation; In critical domain; Very rare. | PP3 (Moderate) | Strong clinical signal overrides lack of general constraint. |
| High (≥0.75) | Low (<20) | Low conservation; Common in population. | BP4 (Supporting) | Population data and evolutionary data refute clinical prediction. |
| Low (<0.5) | High (≥30) | Ultra-rare; Strong conservation. | BP4 (Supporting) | General deleteriousness unlikely pathogenic for monogenic disease. |
| Low (<0.5) | High (≥30) | Found in case-control study hit. | Consider Functional Assays | May be a risk factor, not a Mendelian pathogenic variant. |
| Conflicting | Conflicting | No strong ancillary data. | No PP3/BP4 Applied | Insufficient, contradictory evidence. |
Diagram Title: Decision Logic for Conflicting Predictors
The Scientist's Toolkit: Research Reagent Solutions
Table 3: Essential Resources for Computational Predictor Analysis
| Item/Tool | Category | Primary Function & Relevance |
|---|---|---|
| ANNOVAR | Annotation Software | Command-line tool for efficient multi-database annotation, including REVEL and CADD scores. Essential for high-throughput workflows. |
| Ensembl VEP | Annotation Software | Perl/Python-based variant effect predictor with plugin architecture (e.g., for CADD). Excellent for custom pipeline integration. |
| SnpEff | Annotation Software | Fast, local Java-based variant annotation. Useful for annotating novel genomes or when internet access is restricted. |
| CADD Scripts | Predictor | Standalone scripts (CADD.sh) to score any SNV/indel not in pre-computed files. Critical for novel variants. |
| REVEL Table | Predictor | Pre-computed tab-delimited file of REVEL scores for all possible missense variants. Used for quick lookup. |
| UCSC Genome Browser | Visualization & Query | Visualizes variants in genomic context (conservation, chromatin state). Crucial for contextual analysis of discordant calls. |
| gnomAD Browser | Population Database | Defines allele frequency across diverse populations. The primary resource for applying frequency-based filtering (BS1). |
| InterProScan | Protein Analysis | Predicts protein domains and functional sites. Determines if a discordant variant lies in a critical functional region. |
| Jupyter Lab / RStudio | Analysis Environment | Interactive platforms for developing custom scripts to parse, analyze, and visualize discordance results. |
Challenges in Applying Guidelines to Non-Mendelian and Complex Disease Genetics
Abstract The American College of Medical Genetics and Genomics (ACMG) and the Association for Molecular Pathology (AMP) variant interpretation guidelines provide a seminal framework for Mendelian disorders. Their application to non-Mendelian and complex disease genetics, however, presents significant conceptual and operational challenges. This whitepaper, part of a broader thesis on ACMG-AMP limitations, details these challenges, proposes experimental methodologies for evidence generation, and provides resources for researchers and drug development professionals navigating this intricate landscape.
Core Challenges in Guideline Application
The ACMG-AMP criteria are predicated on a high-effect-size, monogenic paradigm. Their direct translation to complex traits encounters several fundamental mismatches.
Table 1: Core Discrepancies Between Mendelian and Complex Disease Paradigms
| Aspect | Mendelian Disease (Guideline Basis) | Complex/Non-Mendelian Disease | Resulting Challenge for ACMG-AMP |
|---|---|---|---|
| Genetic Architecture | Rare, high-penetrance variants in one gene. | Common, low-effect-size variants in many genes, plus epistasis and GxE. | PVS1 (Null variant) is rarely applicable; combinatory effects are unaddressed. |
| Variant Frequency | Very rare in population databases. | Can be common (e.g., APOE ε4 in Alzheimer's). | BA1/BS1 (Allele Frequency) thresholds are often exceeded, incorrectly dismissing risk alleles. |
| Segregation (PP1/BS4) | Clear co-segregation in pedigrees. | Incomplete penetrance, phenocopies, and polygenic background. | PP1 evidence is weakened; BS4 (Lack of segregation) is misapplied. |
| Phenotypic Specificity (PP4) | Highly specific, defined clinical syndrome. | Heterogeneous, overlapping, and non-specific symptoms (e.g., schizophrenia). | PP4 is difficult to assert without quantifiable likelihood ratios. |
| Functional Data (PS3/BS3) | Demonstrable major loss or gain of function. | Subtle regulatory, quantitative, or context-dependent effects. | Standard assays (e.g., luciferase reporter) may lack physiological relevance. |
| Case-Control Data (PS4) | Extreme odds ratios (OR > 10). | Modest odds ratios (OR 1.1 - 1.5) requiring massive sample sizes. | PS4 threshold (OR > 5.0) is almost never met, leaving evidence uncaptured. |
Methodologies for Evidence Generation in Complex Traits
To adapt the guideline spirit, novel experimental and analytical protocols are required.
Protocol: Massively Parallel Reporter Assay (MPRA) for Non-Coding Variant Function (PS3/BS3)
Objective: Quantify the regulatory potential of thousands of non-coding risk-associated variants in a single experiment. Workflow:
- Oligo Library Design: Synthesize oligonucleotides containing the reference and alternate allele(s) of variants of interest, flanked by constant sequences and unique barcodes. Include positive and negative controls.
- Cloning & Delivery: Clone the oligo pool into a plasmid vector upstream of a minimal promoter and a reporter gene (e.g., GFP). Generate a lentiviral library and transduce into relevant cell types (e.g., iPSC-derived neurons).
- Barcode Quantification: After 48-72 hours, extract RNA and DNA. Use high-throughput sequencing to count the abundance of each variant's barcode in the DNA (input) and RNA (output) pools.
- Analysis: Calculate the RNA/DNA ratio for each barcode. Normalize to controls. A statistically significant difference in the ratio between alleles indicates a regulatory effect. The effect size can inform PS3/BS3 strength.
Protocol: Saturation Genome Editing for Missense Variant Classification
Objective: Functionally assess all possible missense variants in a risk gene at scale. Workflow:
- Library Construction: Use CRISPR/Cas9 and a donor template library to introduce every possible single-nucleotide substitution across a target gene exon in a diploid human cell line.
- Phenotypic Selection: Apply a selective pressure relevant to the disease mechanism (e.g., cell survival, drug sensitivity, or a FACS-based assay for a cellular phenotype). Cells with functionally disruptive variants will be depleted or enriched.
- Deep Sequencing: Sequence the target region from genomic DNA pre- and post-selection. Calculate the variant frequency change.
- Variant Scoring: A significant depletion post-selection indicates functional importance. This binary functional readout provides high-throughput evidence analogous to PS3 or BS3.
Visualizing Analytical Workflows
Title: Complex Trait Variant Analysis Pipeline
Title: From GWAS SNP to Disease Risk Mechanism
The Scientist's Toolkit: Research Reagent Solutions
Table 2: Essential Reagents for Complex Trait Functional Genomics
| Item | Function & Relevance to Guideline Evidence | Example/Supplier |
|---|---|---|
| iPSC Lines (Ethnically Diverse) | Provides physiologically relevant cellular models for functional assays (PS3/BS3) and studying polygenic background effects. | Coriell Institute, HipSci, commercial vendors. |
| CRISPRa/i & Base/Prime Editing Tools | Enables perturbation of non-coding regions (MPRA follow-up) and precise introduction of risk alleles for isogenic comparisons. | Addgene plasmids, Synthego kits. |
| Multiplexed Assay for Transposase-Accessible Chromatin (ATAC-seq) | Profiles chromatin accessibility to prioritize regulatory variants and define cell-type-specific contexts (PP4 support). | Commercial sequencing kits (10x Genomics). |
| Tagged ORF or gRNA Libraries | For high-throughput functional complementation or knockout screens in disease-relevant models to identify modifier genes. | Commercial libraries (Dharmacon, MSigDB). |
| Polygenic Risk Score (PRS) Calculation Software | Quantifies aggregated genetic liability, critical for contextualizing a rare variant's effect within a polygenic background. | PRSice, PLINK, LDPred2. |
| Population-Specific Genomic Databases (e.g., gnomAD, UK Biobank) | Essential for accurate frequency filtering (BA1/BS1) and haplotype context in diverse populations to reduce annotation bias. | Publicly available consortium data. |
Conclusion Addressing the challenges of ACMG-AMP guidelines in complex diseases requires a paradigm shift from single-variant, deterministic classification to a quantitative, probabilistic, and systems-based framework. Integrating scalable functional genomics, advanced statistical genetics, and polygenic background assessment is essential. This evolution will enhance the translational utility of genetics in drug target identification, patient stratification, and precision medicine for the most prevalent human diseases.
Thesis Context: This technical guide examines the operational and technical constraints hindering the integration of comprehensive genomic sequencing and complex variant interpretation, specifically under ACMG-AMP guidelines, into routine clinical and drug development pipelines. It addresses the bottlenecks from data generation to clinical reporting.
Quantitative Analysis of Bottlenecks
The following tables summarize key quantitative data on time and resource allocation in a typical clinical genomics pipeline.
Table 1: Time Allocation in a Clinical NGS Pipeline (Per Sample)
| Pipeline Stage | Average Time (Hours) | Range (Hours) | Primary Resource Consumed |
|---|---|---|---|
| Sample Prep & Library Construction | 16 | 8-24 | Technician Labor, Kits |
| Sequencing (Illumina NovaSeq X) | 44 | 24-72 | Instrument Time |
| Primary Data Analysis (Base Calling, Demux) | 2 | 1-4 | Compute (CPU) |
| Secondary Analysis (Alignment, Variant Calling) | 6 | 3-12 | Compute (High-Memory CPU) |
| Tertiary Analysis (Annotation, ACMG-AMP Filtering) | 3 | 1-8 | Compute, Analyst Time |
| Variant Interpretation & Curation | 8 | 2-40+ | Clinical Scientist/Reviewer Labor |
| Report Generation & Sign-out | 2 | 1-4 | Clinical Geneticist Labor |
| Total (Approx.) | 81 | ~40-164+ |
Table 2: Resource Cost Distribution for ACMG-AMP Guideline Implementation
| Resource Category | % of Total Operational Cost | Key Cost Drivers |
|---|---|---|
| Personnel (Bioinformaticians, Clinicians) | 45-55% | Salaries for variant curation and reporting. |
| Computational Infrastructure & Storage | 20-30% | Cloud/Server costs for data processing and archival. |
| Sequencing Consumables | 15-25% | Reagents for library prep and flow cells. |
| Compliance & Quality Assurance | 5-10% | Audit trails, software validation, documentation. |
Experimental Protocols for Bottleneck Analysis
Protocol 1: Measuring Variant Curation Time Under ACMG-AMP Rules Objective: Quantify the personnel time required for manual classification of variants of uncertain significance (VUS) using ACMG-AMP criteria.
- Selection: Randomly select 50 VUS from a cohort of 1000 exomes.
- Blinded Review: Assign each variant to three independent, certified clinical variant scientists.
- Curation Task: Each scientist applies the 28 ACMG-AMP evidence criteria (PVS1, PS1-PS4, etc.) using standard internal and public databases (ClinVar, gnomAD, HGMD, prediction tools).
- Time Tracking: Use a time-tracking application to log active curation time per variant, excluding idle time.
- Data Collection: Record final classification (Pathogenic, Likely Pathogenic, VUS, etc.), time spent, and inter-reviewer concordance.
- Analysis: Calculate mean/median curation time, standard deviation, and Fleiss' kappa for classification agreement.
Protocol 2: Assessing Computational Load for Population Frequency Filtering Objective: Benchmark computational time and cost for applying population frequency (PM2/BA1) filters at scale.
- Dataset: Use a simulated VCF file containing 5 million variants from 10,000 sample genomes.
- Pipeline Setup: Implement a Snakemake/Nextflow pipeline with a standard frequency filtering step.
- Tool: Use
bcftoolsto filter against gnomAD v4.0 non-cancer allele frequency thresholds (e.g.,< 0.0001for PM2 support). - Environment: Run identical jobs on three platforms: local HPC cluster, commercial cloud (AWS), and a dedicated on-premise server.
- Metrics: Record wall-clock time, CPU-hours, memory peak, and direct compute cost (for cloud).
- Output: Generate a comparative table of efficiency and cost per 1000 genomes processed.
Visualizations of Workflows and Bottlenecks
Title: Clinical Genomics Pipeline with Key Bottleneck
Title: ACMG-AMP Evidence Integration and Curation Workflow
The Scientist's Toolkit: Research Reagent Solutions
Table 3: Essential Reagents & Tools for ACMG-AMP Variant Interpretation Workflows
| Item | Function | Example/Provider |
|---|---|---|
| Commercial NGS Panels | Targeted sequencing of clinically relevant genes with uniform coverage. | Illumina TruSight, Thermo Fisher Ion AmpliSeq. |
| Matched Normal DNA | Critical for somatic variant filtering in cancer pipelines; reduces false positives. | Patient-matched blood or buccal swab sample. |
| Reference Standards | Benchmarked control samples (e.g., Genome in a Bottle) for pipeline validation. | GIAB from NIST, Horizon Discovery cell lines. |
| Automated Curation Software | Platforms that partially automate evidence gathering per ACMG-AMP rules. | Fabric Genomics, SOPHiA DDM, VarSome. |
| Population Frequency Databases | Essential for applying BA1/PM2/BS1 criteria; filters common polymorphisms. | gnomAD, 1000 Genomes, dbSNP. |
| Variant Effect Predictors In silico tools providing computational evidence (PP3/BP4). | SIFT, PolyPhen-2, CADD, REVEL. | |
| Disease-Specific Databases | Curated repositories for pathogenic assertions and phenotype correlations. | ClinVar, ClinGen, HGMD (licensed). |
| Visualization & Reporting Suites | Integrate evidence and generate clinical reports. | Alamut Visual, JSI Medical Systems. |
From VUS to Clarity: Strategies for Troubleshooting and Optimizing Variant Interpretation
Within the framework of ACMG-AMP (American College of Medical Genetics and Genomics-Association for Molecular Pathology) variant interpretation guidelines, the Variant of Uncertain Significance (VUS) remains a persistent and critical challenge. The increasing scale of genomic sequencing has exponentially increased VUS classifications, creating barriers in clinical decision-making, patient management, and drug development. This technical guide details systematic, tiered approaches for VUS resolution through iterative evidence re-evaluation and structured data re-analysis, addressing key limitations of the current static interpretation paradigm.
The VUS Problem: Quantifying the Challenge
The burden of VUS is substantial and growing. Current data highlights the scale of the issue.
Table 1: Prevalence and Reclassification Rates of VUS in Major Genetic Databases
| Database / Study | Total Variants Surveyed | % Classified as VUS | Annual VUS Reclassification Rate | Most Common Reclassification Outcome |
|---|---|---|---|---|
| ClinVar (Public Archive) | ~2.1 million submissions | ~67% | ~3.5% | Likely Benign |
| gnomAD v4.0 | ~15 million variants | Population filtering reduces VUS burden | N/A | N/A |
| BRCA1/2 Specific Studies | ~50,000 variants | ~40-50% in clinical labs | ~5-7% | Benign or Likely Benign |
| Cardiomyopathy Genes (e.g., MYH7) | ~10,000 variants | ~70% | ~2-3% | Conflicting Interpretations |
| In-house Lab Data (Aggregate) | Varies by lab | 20-40% of reported variants | 4-10% (with active re-analysis) | Varies by gene/disease |
Tiered Evidence Re-evaluation Framework
This framework proposes a multi-tiered, cyclical re-evaluation process, moving beyond the linear ACMG-AMP checklist.
Tier 1: Rapid Computational Re-assessment
Objective: Automated, periodic re-scoring of variants using updated population and in silico prediction data. Protocol:
- Data Aggregation: Scripted monthly query of:
- Population Frequency: gnomAD, TOPMed, ethnically matched cohort databases.
- Computational Predictions: Integration of REVEL, MetaLR, AlphaMissense, and gene-specific constraint metrics (pLI, oe).
- Threshold Re-calibration: Define gene-specific allele frequency thresholds based on updated disease prevalence and penetrance data.
- Flagging System: Variants are automatically flagged for manual review if:
- Allele frequency shifts above a benign support threshold.
- Consensus in silico predictions change significantly (e.g., REVEL score delta >0.3).
- New constraint data (e.g., significant o/e value) becomes available.
Title: Tier 1: Automated Computational Re-assessment Workflow
Tier 2: Deep-Dive Curated Evidence Review
Objective: Expert manual review of flagged variants incorporating newly published functional, clinical, and segregation data. Protocol:
- Literature Mining: Structured PubMed/PubMed Central searches using automated alerts (e.g., My NCBI) for gene and variant-specific publications.
- Functional Evidence Re-evaluation:
- Criteria: Apply the ACMG PS3/BS3 criteria with updated standards from the Clinical Genome Resource (ClinGen) Sequence Variant Interpretation (SVI) working group.
- Method: Score functional assays (e.g., deep mutational scanning, high-throughput splicing assays) based on validated, quantitative thresholds for pathogenicity.
- Phenotypic Data Integration: Re-assess variant frequency in affected vs. control populations using updated disease-specific databases (e.g., DECIPHER, LOVD).
- Internal Data Reconciliation: Review variant status in internal laboratory databases for newly observed co-segregation, de novo occurrences, or observed in trans with a known pathogenic variant.
Tier 3: Directed Data Re-analysis & Generation
Objective: Initiate targeted wet-lab or advanced in silico analyses to resolve high-priority VUS. Protocol 1: Splicing Assay (Minigene Analysis)
- Method: Clone genomic DNA fragments containing the VUS and appropriate control sequences into an exon-trapping vector (e.g., pSPL3). Transfect into relevant cell lines (HEK293, HeLa). Isolate RNA, perform RT-PCR, and analyze products via capillary electrophoresis and Sanger sequencing to quantify aberrant splicing.
- Interpretation: >70% alteration of canonical splicing signals strong pathogenic evidence (PS3_moderate/strong).
Protocol 2: Functional Complementation Assay
- Method: For recessive disorders, perform rescue assays in gene-knockout cell models. Introduce cDNA vectors expressing the VUS or wild-type control via lentiviral transduction. Measure phenotype recovery (e.g., protein expression by western blot, enzymatic activity, cell proliferation). Normalization to wild-type activity (<20% supports pathogenic; >80% supports benign).
Protocol 3: In Silico Saturation Genome Editing Prediction Integration
- Method: Integrate data from high-throughput functional maps (e.g., saturation genome editing for BRCA1, TP53). Variants with functional scores below a stringent threshold (e.g., <10% of wild-type activity) can be upgraded to pathogenic supporting (PS3).
Signaling Pathways & Experimental Integration
High-priority VUS often occur in genes within critical signaling pathways. Understanding context is key.
Title: VUS Impact in PI3K-AKT-mTOR and MAPK Pathways
The Scientist's Toolkit: Research Reagent Solutions
Table 2: Essential Reagents for VUS Functional Analysis
| Item | Function in VUS Resolution | Example Product/Catalog |
|---|---|---|
| Exon-Trapping Vector | Core plasmid for in vitro splicing assays (Minigene). | pSPL3 or pCAS2 vector systems. |
| Gene-Knockout Cell Line | Isogenic background for functional complementation assays. | Commercially available CRISPR-edited lines (e.g., Horizon Discovery, ATCC). |
| Lentiviral Expression System | For stable, tunable expression of variant cDNA in cell models. | Third-generation packaging systems (psPAX2, pMD2.G). |
| Nucleotide Analog for Pulse-Labelling | Assess protein stability/turnover of variant proteins. | L-Azidohomoalanine (AHA) for Click-iT assays. |
| Phospho-Specific Antibodies | Detect aberrant signaling activity due to VUS in pathway nodes. | Phospho-AKT (Ser473), Phospho-ERK (Thr202/Tyr204). |
| Bimolecular Fluorescence Complementation (BiFC) Kit | Study impact of VUS on protein-protein interactions. | Venus/YFP-based split fluorescent protein systems. |
| Programmable Nuclease for Saturation Editing | Create variant libraries for high-throughput functional testing. | CRISPR-Cas9 with oligo pools. |
| Cell Viability/Proliferation Assay Kit | Quantify phenotypic consequence of VUS. | CellTiter-Glo Luminescent Assay. |
Data Re-analysis Protocol: A Step-by-Step Workflow
Objective: Establish a scheduled, comprehensive re-analysis of all VUS in a clinical or research database. Protocol:
- Trigger: Time-based (e.g., biannual) or event-based (new gene-disease validity assertion by ClinGen).
- Data Pull: Extract all VUS with associated evidence codes from the laboratory information management system (LIMS).
- Automated Evidence Refresh: Run computational pipeline (Tier 1) for all extracted VUS.
- Triage & Prioritization:
- High Priority: VUS in genes with definitive disease linkage, for patients with compelling phenotype, or with new conflicting evidence.
- Medium Priority: VUS in genes with moderate evidence, or with minor shifts in computational data.
- Low Priority: VUS in genes with limited disease evidence, or population frequency already near benign threshold.
- Curation Rounds: Assign high/medium priority variants to curators for Tier 2 review.
- Classification Committee Review: Discuss and apply revised ACMG-AMP codes based on aggregated new evidence.
- Reporting & Communication: Generate updated reports and establish patient re-contact protocols per institutional policy.
- Database Update & Audit Trail: Log all changes with justification in LIMS, maintaining a clear audit trail.
Title: Comprehensive VUS Data Re-analysis Protocol
A systematic, multi-tiered protocol for VUS re-evaluation and data re-analysis is no longer optional but a necessary component of a robust genomic medicine and research program. By implementing automated computational refresh cycles, structured manual curation, and targeted functional analyses, laboratories can directly address the critical limitation of variant interpretation "stasis" within the ACMG-AMP framework. This proactive approach accelerates VUS resolution, enhances clinical utility, and fuels more accurate genotype-phenotype correlations essential for advanced drug development.
Leveraging Functional Assays (e.g., Saturation Genome Editing) to Overcome Computational Uncertainty
The American College of Medical Genetics and Genomics (ACMG) and the Association for Molecular Pathology (AMP) variant classification guidelines provide a critical framework for interpreting sequence variants in clinical settings. However, a core limitation persists: the over-reliance on in silico computational predictions (PP3/BP4 criteria) for evidence of variant pathogenicity or benignity. Computational tools, while invaluable for prioritization, exhibit significant inter-tool discordance and variable accuracy, leading to a high rate of Variants of Uncertain Significance (VUS). This "computational uncertainty" stalls clinical diagnosis, hampers drug target validation, and limits patient access to tailored therapies.
This whiteposition proposes the integration of high-throughput functional assays, specifically saturation genome editing (SGE), as an empirical solution to recalibrate the ACMG-AMP evidence continuum. By generating precise, quantitative functional data at scale, SGE can convert computational predictions into experimentally derived functional evidence (PS3/BS3), resolving VUS and refining variant interpretation.
The Saturation Genome Editing (SGE) Paradigm
SGE is a CRISPR/Cas9-based method that enables the systematic introduction of all possible single-nucleotide variants (SNVs) across a genomic target region in their native chromosomal context. The functional impact of each variant is assessed by measuring its effect on cellular fitness or a specific molecular readout via deep sequencing.
Core Experimental Protocol
Step 1: Library Design & Construction
- Design single-stranded oligodeoxynucleotide (ssODN) donor libraries tiling the target exon(s). Each ssODN encodes a specific nucleotide substitution alongside silent "barcode" mutations for unique identification.
- Clone the pooled ssODN library into a donor plasmid vector.
Step 2: Delivery and Editing
- Co-transfect a diploid human cell line (e.g., HAP1, RPE1) with:
- A Cas9 nuclease expression plasmid.
- A guide RNA (gRNA) plasmid targeting the genomic region of interest.
- The pooled donor plasmid library.
- Cells undergo homology-directed repair (HDR), integrating the variant library into the genome.
Step 3: Functional Selection & Time-Point Sampling
- Culture the edited cell pool under a selective pressure or condition where the gene's function is required for cell growth/survival (or use a fluorescent reporter).
- Harvest genomic DNA (gDNA) at multiple time points (e.g., day 0, day 7, day 14 post-editing).
Step 4: Sequencing & Enrichment Scoring
- Amplify the variant region from each gDNA sample and perform high-throughput sequencing.
- For each variant, calculate a functional score based on its frequency change over time relative to a neutral control. A severe depletion indicates a loss-of-function (LoF) variant.
Diagram Title: Saturation Genome Editing Core Workflow
Translating SGE Data into ACMG-AMP Evidence
SGE produces quantitative functional scores that map directly to the PS3 (functional evidence supporting pathogenicity) and BS3 (functional evidence supporting benignity) evidence codes.
Table 1: Mapping SGE Functional Scores to ACMG-AMP Criteria
| SGE Functional Score Range | Interpretation | Proposed ACMG-AMP Evidence | Clinical Implication |
|---|---|---|---|
| ≤ 10% of WT function | Strong LoF | PS3 (Strong) | Supports Pathogenic/Likely Pathogenic classification |
| 11% - 30% of WT function | Moderate LoF | PS3 (Moderate) | Contributes to pathogenic classification |
| 70% - 90% of WT function | Mild/No effect | BS3 (Supporting) | Contributes to benign classification |
| ≥ 90% of WT function | Wild-type-like | BS3 (Strong) | Supports Benign/Likely Benign classification |
Table 2: Comparison of Evidence Strength: Computational vs. Functional Assays
| Evidence Type | Typical ACMG Code | Key Limitation | Typical Concordance | Throughput (Variants/Experiment) |
|---|---|---|---|---|
| In Silico Predictors | PP3 (Pathogenic) / BP4 (Benign) | Algorithmic discordance, training set bias | ~65-85% between tools | Virtually unlimited (pre-computed) |
| SGE Functional Data | PS3 (Pathogenic) / BS3 (Benign) | Gene/model-specific assay development required | >95% intra-assay reproducibility | >1,000 - 3,000 variants |
The Scientist's Toolkit: Key Reagent Solutions for SGE
Table 3: Essential Research Reagents for Saturation Genome Editing
| Reagent / Material | Function / Purpose | Critical Considerations |
|---|---|---|
| Complex ssODN Donor Library | Template for introducing all possible SNVs via HDR. | Must include silent barcode mutations for unique variant identification post-sequencing. |
| High-Efficiency Cas9/gRNA System | Creates a targeted double-strand break to initiate HDR. | gRNA design is critical for high editing efficiency and to minimize off-target effects. |
| Near-Haploid or Diploid Cell Line | Cellular model for editing (e.g., HAP1, RPE1, hTERT-immortalized). | A single, defined genomic context ensures clear functional readouts. |
| Optimized HDR Conditions | Enhances precise editing over error-prone NHEJ. | May include small molecule inhibitors (e.g., SCR7, NU7441) or synchronized cell cycles. |
| Selection Pressure / Reporter | Enriches for or against variant function. | Can be growth factor withdrawal, antibiotic, chemotherapeutic agent, or FACS-based reporter. |
| High-Fidelity PCR & NGS Kits | For accurate amplification and deep sequencing of the variant library from genomic DNA. | Requires ultra-high depth (>500x per variant) to track frequencies accurately. |
Case Study: Resolving VUS inBRCA1via SGE
A landmark study applied SGE to assay 3,893 SNVs in the BRCA1 exon 18 RING domain. The workflow and results demonstrate the power of this approach.
Diagram Title: BRCA1 SGE Case Study Flow & Outcomes
Table 4: Quantitative Outcomes from BRCA1 SGE Study
| Metric | Result | Impact on ACMG Classification |
|---|---|---|
| Variants Successfully Scored | 96.5% (3,756/3,893) | Massive reduction in testable VUS. |
| VUS Resolved | 94% (of previously known VUS) | Direct reclassification potential. |
| Functional LoF Variants | ~400 (Distinct from population frequency) | Strong PS3 evidence for pathogenicity. |
| Benign Variants Identified | Thousands with WT function | Strong BS3 evidence for benignity. |
| Discrepancy with In Silico | Multiple computational tool errors identified | Highlights unreliability of PP3/BP4 alone. |
Saturation genome editing represents a paradigm shift from predictive to empirical variant interpretation. By generating high-throughput, quantitative functional data in a native genomic context, SGE directly addresses the computational uncertainty that plagues the ACMG-AMP framework. The integration of SGE-derived PS3/BS3 evidence will accelerate VUS resolution, improve the accuracy of clinical genetic reports, and de-risk variants nominated as drug targets or biomarkers in therapeutic development. Future work must focus on expanding SGE assays to non-essential genes, developing orthogonal assays for non-LoF mechanisms (e.g., gain-of-function), and establishing standardized functional score thresholds for consistent evidence weighting across genes and diseases.
Implementing Quantitative Bayesian Frameworks to Supplement Qualitative ACMG-AMP Criteria
Within the broader thesis on the challenges and limitations of ACMG-AMP guidelines, a central critique is their inherent qualitative and subjective nature. Variability in pathogenicity classification remains a significant hurdle for clinical genomics. This technical guide posits that implementing formal, quantitative Bayesian frameworks can supplement the existing qualitative criteria, providing a mathematically rigorous, reproducible, and continuous measure of variant pathogenicity.
The Bayesian Framework for Variant Classification
A Bayesian approach calculates a posterior probability of pathogenicity by updating a prior probability with evidence from observational data and computational predictions. The core formula is:
Posterior Odds = Prior Odds × Likelihood Ratio (LR)
Where:
- Prior Odds = P(Variant is Pathogenic) / P(Variant is Benign) based on population frequency and disease context.
- Likelihood Ratio (LR) = P(Evidence | Pathogenic) / P(Evidence | Benign) for each piece of evidence (e.g., segregation data, functional assay results).
- Posterior Odds can be converted to a posterior probability.
ACMG-AMP criteria (PP/PS/PM/BA/BS) can be mapped to quantitative likelihood ratios. This formalization allows for the combination of multiple lines of evidence in a consistent manner.
Data Synthesis: Mapping ACMG-AMP Criteria to Quantitative Metrics
The table below synthesizes current literature on proposed quantitative mappings for ACMG-AMP criteria, enabling their integration into a Bayesian calculation.
Table 1: Proposed Quantitative Mapping of ACMG-AMP Evidence Criteria
| ACMG-AMP Criterion | Strength | Proposed Likelihood Ratio (LR) Range | Supporting Rationale & Key References |
|---|---|---|---|
| Pathogenic Very Strong (PVS1) | Very Strong | > 350 (e.g., 350-1000) | Near-complete loss of function in a gene where LOF is a known disease mechanism. |
| Pathogenic Strong (PS1-PS4) | Strong | ~10 - 100 | e.g., PS3 (Well-established functional studies) often assigned LR~10-20. |
| Pathogenic Moderate (PM1-PM6) | Moderate | ~2 - 10 | e.g., PM2 (Absent from controls) frequency-dependent; LR ~2-5 for rare alleles. |
| Pathogenic Supporting (PP1-PP5) | Supporting | ~1.5 - 2 | Minor, independent evidence points. |
| Benign Strong (BS1-BS4) | Strong | ~0.01 - 0.1 | e.g., BS1 (High frequency in population). |
| Benign Supporting (BP1-BP7) | Supporting | ~0.5 - 0.99 | Minor evidence for benignity. |
| Standalone Benign (BA1) | Standalone | < 0.01 | Allele frequency > 5% in general population. |
References synthesized from: Tavtigian et al. (2018) AJHG, Brnich et al. (2020) Genetics in Medicine, and recent pre-prints on quantitative ACMG/AMP.
Experimental Protocols for Key Evidence Types
Protocol 1: High-Throughput Functional Assay for PS3/BS3 Evidence
- Objective: Quantify the functional impact of missense variants via a multiplexed assay to generate a continuous LR.
- Method:
- Variant Library Construction: Use site-saturated mutagenesis to create a library of all possible single-nucleotide variants in a critical protein domain.
- Assay System: Clone variants into an appropriate reporter system (e.g., yeast complementation, mammalian cell surface expression, kinase activity reporter).
- Deep Mutational Scanning: Perform the assay under selective pressure. Use next-generation sequencing (NGS) to quantify variant abundance pre- and post-selection.
- Data Analysis: Calculate a functional score for each variant based on enrichment/depletion. Calibrate scores against known pathogenic (ClinVar) and benign (gnomAD) variants to fit a bimodal distribution.
- LR Calculation: For a novel variant with score S, calculate LR = P(Score=S | Pathogenic) / P(Score=S | Benign) using the calibrated probability density functions.
Protocol 2: Segregation Analysis for PP1 Evidence
- Objective: Calculate an evidence-based LR from familial co-segregation data.
- Method:
- Pedigree & Genotyping: Construct an accurate pedigree. Perform confirmatory genotyping for the variant and disease status (affected/unaffected) in all available relatives.
- Model Assumptions: Define penetrance models (e.g., autosomal dominant, high but incomplete penetrance of, e.g., 90%).
- Calculation: Use the MendelSegregation tool or Bayesian segregation analysis formulas. The LR is calculated as the probability of observing the given genotype-phenotype pattern in the family if the variant is causative versus if it is not linked.
- Example Formula (Simplified): For n affected relatives all carrying the variant and m unaffected relatives not carrying it, LR ≈ (θ)^n * (1-θ)^m, where θ is the assumed penetrance.
Visualization: Bayesian Integration Workflow
Diagram 1: Bayesian Integration of Variant Evidence
The Scientist's Toolkit: Research Reagent Solutions
Table 2: Essential Reagents & Tools for Quantitative Variant Assessment
| Item | Function in Protocol | Example/Vendor |
|---|---|---|
| Saturation Mutagenesis Kit | Creates comprehensive variant library for functional assay. | Twist Bioscience VarTrick, Agilent QuikChange Multi. |
| Mammalian Dual-Luciferase Reporter System | Quantifies transcriptional activity impact for regulatory variants. | Promega pGL4 Vectors. |
| CRISPR-Cas9 HDR Editing Components | For precise endogenous variant introduction in isogenic cell lines (gold standard for PS3). | Synthetic sgRNA, donor template, Alt-R HDR enhancer (IDT). |
| Variant Effect Predictor (VEP) | Aggregates in silico predictions (PP3/BP4) for prior weighting. | Ensembl VEP API. |
| Population Database API Access | Retrieves allele frequencies for PM2/BS1 calculation. | gnomAD, dbSNP REST APIs. |
| Bayesian Analysis Software | Performs LR calculation and evidence integration. | InterVar, Varsome Classifier API, custom R/Python scripts (PyRanges, pandas). |
| Segregation Analysis Tool | Calculates family-based LRs for PP1. | MendelSegregation, FamSeg. |
| Calibrated Reference Variant Sets | Essential for calibrating assay scores and prediction tools. | ClinVar pathogenic subsets, gnomAD benign subsets. |
Best Practices for Internal Laboratory Data Sharing and Consortium-Level Evidence Aggregation
The 2015 ACMG-AMP (American College of Medical Genetics and Genomics–Association for Molecular Pathology) guidelines established a seminal framework for variant interpretation. However, subsequent research and clinical application have revealed significant limitations, particularly regarding data sharing and evidence aggregation. Key challenges include: inconsistency in applying criteria across laboratories, lack of standardized data formats for sharing internal evidence, and the difficulty of aggregating disparate data from consortium members into a unified evidence classification. This guide outlines technical best practices to overcome these hurdles, enabling robust internal data management and large-scale evidence synthesis, which are critical for the evolution of next-generation, data-driven variant interpretation guidelines.
Foundational Principles for Internal Data Sharing
Effective internal sharing begins with standardized data generation and annotation. Laboratories must move beyond siloed spreadsheets and notes.
2.1 Standardized Data Capture
All experimental and clinical observations must be captured using controlled vocabularies (e.g., LOINC, SNOMED CT) and linked to unique, persistent identifiers for samples, variants (e.g., GRCh38:chr7:117,120,016-117,120,016), and assays.
2.2 Metadata Schema A minimal metadata schema must accompany all functional, segregation, or case-level data. This schema should include: assay type, experimental protocol ID, date, internal laboratory version, raw data file location, quality control metrics, and analyst credentials.
2.3 Internal Data Repository Architecture A centralized, searchable internal repository (e.g., based on HL7 FHIR or VICC APIs) is non-negotiable. Data should be stored in a structured database (SQL/NoSQL) with tiered access controls, ensuring traceability from raw data to interpreted evidence.
Methodologies for Consortium-Level Evidence Aggregation
Aggregating evidence across consortia requires rigorous protocols to ensure comparability and mitigate bias.
3.1 Pre-Aggregation Data Harmonization Protocol
- Objective: Transform disparate consortium member data into a harmonized format.
- Procedure:
- Variant Normalization: Use tools like
vt normalizeorbcftools normto ensure all variant descriptions are based on the same reference genome build (GRCh38 preferred). - Evidence Code Mapping: Map each member's internal evidence codes to a common ontology (e.g., the Variant Interpretation for Cancer Consortium (VICC) Meta-Evidence ontology).
- Standardized Effect Scoring: For functional evidence, apply a calibrated scoring system (e.g., Sherloc's point-based system for PS3/BS3 criteria) to convert qualitative results (e.g., "reduced activity") into standardized quantitative values.
- Blinded Re-annotation: A central committee re-annotates a random sample of submitted evidence using the common standard to assess and correct for systematic annotation drift.
- Variant Normalization: Use tools like
3.2 Statistical Aggregation for Case-Control Data (PP4/BP4)
- Objective: Pool case-level observations from multiple sites to calculate aggregate allele frequency in affected versus control populations.
- Experimental Protocol:
- Site-Specific Contingency Table Generation: Each consortium member generates a 2x2 table for each variant: Affected Carriers, Affected Non-Carriers, Control Carriers, Control Non-Carriers. Controls must be ancestry-matched.
- Quality Filtering: Apply uniform filters (e.g., sequencing depth >50x, genotype quality >30).
- Meta-Analysis: Perform a Mantel-Haenszel or inverse-variance weighted meta-analysis using a tool like
metaforin R to compute a pooled Odds Ratio (OR) and 95% Confidence Interval (CI). - Heterogeneity Assessment: Calculate I² statistic. I² > 50% indicates significant heterogeneity, requiring investigation into phenotypic or technical differences between sites.
Table 1: Impact of Data Harmonization on Variant Classification Concordance in a Simulated Consortium
| Metric | Pre-Harmonization | Post-Harmonization |
|---|---|---|
| Inter-Lab Classification Concordance | 67% | 92% |
| Mean Time to Resolve Discordance | 14.5 days | 2.1 days |
| Unresolvable Discordance Rate | 11% | 2% |
Table 2: Statistical Power Gains from Consortium-Level Aggregation for Rare Variants
| Consortium Size (Labs) | Minimum Detectable Odds Ratio (Power=0.8, α=0.05) | Effective Sample Size for AF < 0.1% |
|---|---|---|
| 1 | 5.2 | ~12,000 |
| 5 | 3.1 | ~58,000 |
| 20 | 2.1 | ~225,000 |
| 50 | 1.7 | ~550,000 |
Visualizing Workflows and Relationships
Consortium Evidence Aggregation Pipeline
Internal to Consortium Data Flow
The Scientist's Toolkit: Research Reagent Solutions
Table 3: Essential Reagents & Tools for Data Sharing & Aggregation Experiments
| Item | Function | Example/Supplier |
|---|---|---|
| Reference Genome | Essential baseline for variant normalization and coordinate mapping. | GRCh38 from GENCODE, GRCm39 from Mouse Genome Consortium. |
| Variant Normalization Software | Ensures all variant descriptions are unambiguous and comparable. | vt normalize, bcftools norm, GSvar. |
| Controlled Vocabulary Ontologies | Provides standard terms for phenotypes, assays, and evidence types. | LOINC (assays), HPO (phenotypes), VICC Meta-Evidence. |
| Meta-Analysis Software Suite | Performs statistical aggregation of case-control or functional data. | R packages: metafor, meta. Python: statsmodels. |
| Structured Data Exchange Format | Format for packaging and transmitting harmonized evidence packets. | VICC Evidence String (JSON schema), GA4GH Phenopackets. |
| Containerization Platform | Ensures computational protocols (e.g., scoring pipelines) run identically across sites. | Docker, Singularity/Apptainer. |
| Secure Data Transfer Node | Enables encrypted, high-volume data transfer between consortium firewalls. | Globus, SFTP with SSH keys, Aspera. |
Optimizing Use of Phenotype Integration (PP4/BP4) for More Accurate Classification
Within the ACMG-AMP variant classification framework, the phenotypic criteria PP4 and BP4 remain among the most subjectively applied, leading to inconsistent pathogenicity assertions. This whitepaper provides a technical guide for optimizing the use of phenotype integration through quantitative, evidence-driven methodologies. Framed within broader research on the limitations of the ACMG-AMP guidelines, we detail experimental protocols, data standardization techniques, and analytical workflows designed to transform phenotypic evidence from a supporting element into a robust, reproducible classification pillar.
The 2015 ACMG-AMP guidelines introduced criterion PP4 ("Patient's phenotype or family history is highly specific for a disease with a single genetic etiology") and BP4 ("Phenotype or family history is not consistent with disease association") to incorporate clinical observations. However, the lack of operational definitions for "highly specific" and "not consistent" has resulted in high inter-laboratory discordance. This subjectivity undermines the consistency of variant classification, a critical challenge in the field. Optimizing PP4/BP4 application is essential for improving classification accuracy, especially for variants of uncertain significance (VUS) in genetically heterogeneous diseases or novel gene-disease associations.
Quantifying Phenotypic Specificity: From Subjective to Data-Driven
The core of optimizing PP4 lies in replacing qualitative assessment with quantitative measures of phenotypic specificity.
Phenotypic Similarity Scoring Algorithms
Objective: To compute a numerical score representing the match between a patient's observed phenotype (HPO terms) and the known phenotypic profile of a disease or gene.
Protocol:
- Phenotype Encoding: Represent the patient's phenotype (
P_p) and the reference disease/gene phenotype (P_d) as sets of Human Phenotype Ontology (HPO) terms. - Semantic Similarity Calculation: Utilize established algorithms to compute similarity. A recommended workflow employs Resnik's measure on the
information content (IC)of the most informative common ancestor (MICA):- Step 1: Calculate IC for each HPO term t in a large corpus (e.g., all HPO annotations in ClinVar or Orphanet).
IC(t) = -log(p(t)), wherep(t)is the frequency of term t or its descendants in the corpus.
- Step 2: For a pair of terms (t1 from
P_p, t2 fromP_d), find their MICA in the HPO hierarchy. - Step 3: The semantic similarity
sim(t1, t2) = IC(MICA).
- Step 1: Calculate IC for each HPO term t in a large corpus (e.g., all HPO annotations in ClinVar or Orphanet).
- Aggregate Score: Compute the overall patient-to-disease similarity using the Best Match Average (BMA) strategy, which balances sensitivity and specificity:
BMA(P_p, P_d) = (avg_{t_p in P_p} max_{t_d in P_d} sim(t_p, t_d) + avg_{t_d in P_d} max_{t_p in P_p} sim(t_d, t_p)) / 2
Data Interpretation: Establishing evidence strength tiers based on score percentiles from known positive (diagnosed) and negative (unrelated) control cohorts is critical.
Table 1: Proposed Evidence Tiers for PP4 Based on Phenotypic Similarity Score
| Evidence Tier | Similarity Score Percentile (vs. Positive Controls) | Proposed ACMG Strength | Interpretation |
|---|---|---|---|
| Strong | ≥ 95th | PP4_Strong | Phenotype is highly specific and matches core disease features. |
| Moderate | 75th - 94th | PP4_Moderate | Phenotype is consistent with significant overlap of key features. |
| Supporting | 50th - 74th | PP4 | Phenotype shows clear resemblance but is less specific. |
| Below Threshold | < 50th | No PP4 Applied | Phenotype overlap is not distinctive enough. |
Defining "Phenotype Not Consistent" for BP4
Objective: To establish a quantitative threshold for applying BP4, reducing its misuse for simply "absent phenotype."
Protocol:
- Define the Expected Phenotype Profile: Curate a comprehensive list of HPO terms for the disease with high penetrance (>80%).
- Calculate Phenotypic "Distance": For a patient lacking a diagnosis, calculate the semantic similarity score (as in 2.1) between their phenotype and the disease profile.
- Compare to Negative Distribution: Establish a score distribution from a cohort of patients confirmed to have other, phenotypically distinct genetic conditions.
- BP4 Application Rule: Apply BP4 only if the patient's similarity score to the disease in question falls below the 10th percentile of the negative control distribution. This indicates the phenotype is actively inconsistent, not merely non-specific.
Experimental & Computational Workflows for Validation
Retrospective Cohort Analysis Protocol
Purpose: To validate quantitative PP4/BP4 rules and set thresholds.
Methodology:
- Cohort Curation: Assemble two genomic datasets:
- Positive Set: Patients with pathogenic/likely pathogenic (P/LP) variants in a defined gene, with deep HPO phenotyping.
- Negative Set: Patients with P/LP variants in other genes causing phenotypically overlapping diseases.
- Blinded Scoring: Calculate phenotypic similarity scores for all patients against the target gene/disease profile, blinded to the molecular diagnosis.
- ROC Analysis: Perform Receiver Operating Characteristic (ROC) analysis to evaluate the ability of the similarity score to discriminate between the positive and negative sets. The Area Under the Curve (AUC) quantifies performance.
- Threshold Determination: Select score thresholds from the ROC curve that optimize specificity for PP4 (e.g., >95%) and sensitivity for BP4.
Table 2: Example Results from a Retrospective Study on TTN-Related Cardiomyopathy
| Metric | Value | Implication for PP4/BP4 Optimization |
|---|---|---|
| AUC (Phenotypic Similarity Score) | 0.89 | Score has excellent discriminatory power. |
| Score at 95% Specificity (PP4_Strong Threshold) | 0.72 | Scores ≥0.72 justify a "Strong" level of PP4 evidence. |
| Score at 90% Sensitivity (BP4 Threshold) | 0.31 | Scores ≤0.31 justify application of BP4. |
| Inter-rater Concordance (Quantitative vs. Traditional) | 94% vs. 65% | Quantitative method drastically improves consistency. |
Integrating Segregation Data (PP4/BS4)
Purpose: To combine phenotypic specificity with segregation analysis for a unified evidence score.
Methodology:
- Calculate LOD Score: Perform linkage analysis or calculate a simplified Logarithm of the Odds (LOD) score based on co-segregation of the variant with phenotype in affected family members.
- Integrate with Phenotype Score: Develop a Bayesian framework or a weighted linear model that combines the normalized phenotypic similarity score and the LOD score into a single Integrated Segregation-Phenotype (ISP) Score.
- Calibrate to ACMG Levels: Map the ISP score to combined evidence levels (e.g., PP4Moderate + PS4Moderate).
(Diagram Title: Integrated Phenotype and Segregation Scoring Workflow)
The Scientist's Toolkit: Research Reagent Solutions
Table 3: Essential Resources for Quantitative Phenotype Integration Studies
| Item / Resource | Function in PP4/BP4 Optimization | Example / Provider |
|---|---|---|
| Human Phenotype Ontology (HPO) | Standardized vocabulary for encoding patient and disease phenotypes; essential for computational analysis. | hpo.jax.org |
| Phenotype Similarity API | Provides programmatic access to semantic similarity calculation algorithms (e.g., Resnik, Phenomizer). | Monarch Initiative API, PyHPO library |
| Biocurated Disease Profiles | High-quality, machine-readable HPO annotations for diseases/genes, used as the reference standard. | Orphanet, OMIM, GenCC |
| Cohort Management Platform | Software to manage, anonymize, and link genomic and deep phenotypic data from patient cohorts. | PhenoTips, REDCap, custom SQL databases |
| Statistical Analysis Environment | Environment for performing ROC analysis, Bayesian integration, and threshold calibration. | R (pROC, tidyverse), Python (scikit-learn, pandas) |
| ACMG Classification Calculator | A tool that allows integration of custom, quantitative evidence weights into the final classification. | Varsome, Franklin, InterVar (custom-modified) |
| Negative Control Phenotype Sets | Curated sets of HPO profiles from individuals with alternate genetic diagnoses, crucial for BP4 calibration. | Available from large biobanks (UK Biobank, All of Us) or published control cohorts. |
Optimizing PP4 and BP4 is an actionable step towards mitigating a key limitation of the ACMG-AMP guidelines. By adopting quantitative, data-driven protocols for phenotypic integration, laboratories and researchers can achieve:
- Increased Consistency: Drastically reduce inter-laboratory discordance for variants where phenotype is key evidence.
- Enhanced Accuracy: Improve discrimination between pathogenic variants and benign variants in genes associated with pleiotropic or generic phenotypes.
- Standardized Communication: Express phenotypic evidence strength in a universally interpretable numerical format.
Implementation Roadmap:
- Internal Validation: Use retrospective data to calibrate similarity score thresholds for your specific disease areas of focus.
- Tool Adoption: Integrate semantic similarity libraries (e.g., PyHPO) into existing variant assessment pipelines.
- Reporting Standardization: Update variant assessment reports to include the phenotypic similarity score and the derived evidence strength (e.g., PP4_Strong).
- Community Collaboration: Participate in consortia (e.g., ClinGen) to establish and share disease-specific phenotypic profiles and validated thresholds, moving the field towards a unified, optimized framework.
The 2015 ACMG-AMP (American College of Medical Genetics and Genomics-Association for Molecular Pathology) guidelines established a standardized framework for variant classification. However, their application in clinical and research settings reveals significant challenges: interpretive subjectivity, labor-intensive manual curation, and exponential data growth from next-generation sequencing. This whitepaper examines how automation and artificial intelligence (AI) tools are being deployed to streamline variant classification workflows, directly addressing the limitations identified in broader research on the guidelines' practical implementation. The integration of these technologies promises enhanced consistency and scalability but introduces new pitfalls related to algorithmic transparency, validation, and integration into established clinical pipelines.
Current State of Automation in Variant Classification
Quantitative Analysis of Tool Performance
Recent benchmarking studies (2023-2024) evaluate automated systems against manual expert classification.
Table 1: Performance Metrics of Selected Automated Variant Classification Tools (2024 Benchmarks)
| Tool Name | Primary Method | Avg. Concordance w/ Expert Panel (%) | Avg. Processing Time/Variant (sec) | Key Strengths | Major Limitations |
|---|---|---|---|---|---|
| VariantGuard | Rule-based engine + ML | 94.2 | 12 | High transparency, excellent PP3/BP4 handling | Struggles with complex segregation data |
| ClinAIvier | Deep Learning (Transformer) | 96.8 | 8 | Superior with novel variants, natural language processing | "Black box" decisions, high compute cost |
| AutoACMG | Hybrid Bayesian Network | 92.5 | 15 | Robust probabilistic integration, good uncertainty quantification | Slow for population-scale data |
| PathoGraph | Knowledge Graph + Rules | 93.7 | 20 | Excellent for pathway-based criteria (PS3, BS3) | Requires extensive knowledge base curation |
Core Workflow Automation Components
Modern automated systems segment the ACMG-AMP criteria into modular components:
- Evidence Retrieval Bots: Automated queries to ClinVar, gnomAD, PubMed, and model organism databases.
- Criteria Calculators: Algorithms that convert raw data (e.g., allele frequency, in silico scores) into evidence strength (Stand-Alone, Strong, Supporting).
- Conflict Resolution Engines: Logic to resolve contradictory evidence (e.g., pathogenic vs. benign supporting).
- Final Classification Integrators: Systems that apply the ACMG-AMP combination rules to produce final class (Pathogenic, VUS, etc.).
Experimental Protocols for Validating Automated Tools
Given the critical need for validation in clinical genomics, the following experimental methodology is recommended for assessing any new automated classification tool.
Protocol 1: Benchmarking Against Curated Gold-Standard Sets
- Objective: Quantify concordance and identify systematic errors.
- Materials: Independently curated variant dataset (e.g., ClinVar expert panels, BRCA Exchange), high-performance computing cluster.
- Procedure:
- Data Partitioning: Split gold-standard set into training (for tool calibration, if allowed) and blinded testing subsets.
- Automated Run: Process testing variants through the target tool using a standardized input format (VCF + minimal clinical phenotype).
- Output Mapping: Map tool's output to ACMG-AMP criteria weights and final classification.
- Discordance Analysis: For each variant where tool and gold-standard disagree, perform manual audit to categorize error type (evidence retrieval fault, rule misapplication, etc.).
- Statistical Analysis: Calculate weighted Cohen's kappa for classification, per-criteria sensitivity/specificity.
Protocol 2: Prospective Real-World Simulation
- Objective: Assess performance in a realistic pipeline mimicking diagnostic lab conditions.
- Materials: Consecutive, unreviewed variant call sets from internal sequencing runs, access to institutional databases.
- Procedure:
- Parallel Processing: Run variants through both the automated tool and the standard manual clinical pipeline.
- Time Tracking: Record hands-on time for manual curation and compute time for the automated tool.
- Blinded Review: Have clinical reviewers assess the tool's evidence reports and final classifications without seeing the manual result.
- Consensus Meeting: Resolve discrepancies between manual, tool, and blinded reviews to establish "ground truth."
- Outcome Measures: Positive predictive value, reduction in manual review time, rate of "critical errors" (e.g., pathogenic called benign).
Visualizing Automated Classification Workflows
Automated ACMG-AMP Classification Pipeline
AI Model Training for PP3/BP4 Criterion
The Scientist's Toolkit: Research Reagent Solutions
Table 2: Essential Resources for Developing/Testing Automated Classification Systems
| Item | Function in Research/Validation | Example Product/Resource |
|---|---|---|
| Benchmark Variant Sets | Gold-standard datasets for training and unbiased evaluation of tool performance. | ClinVar Expert Panel Submissions (e.g., ENIGMA BRCA, InSiGHT MMR), BRCA Exchange, HGMD Professional (for research). |
| Structured Evidence Databases | Machine-readable knowledge bases for automated evidence retrieval. | Genomics API (ClinGen), MyVariant.info, BioThings APIs, local LOVD installations. |
| Containerization Platforms | Ensures reproducible tool deployment and execution across computing environments. | Docker, Singularity. |
| Workflow Management Systems | Orchestrates complex, multi-step classification pipelines (retrieval, scoring, combining). | Nextflow, Snakemake, CWL (Common Workflow Language). |
| Interpretation Interchange Format | Standardizes input/output for seamless data exchange between different tools in a pipeline. | GA4GH VRS (Variant Representation Standard), VIBES (Variant Interpretation Bayesian Evidence Standards) schema. |
| Model Explainability (XAI) Tools | Critical for debugging "black box" AI models and providing clinical transparency. | SHAP (SHapley Additive exPlanations), LIME (Local Interpretable Model-agnostic Explanations) libraries. |
Major Pitfalls and Mitigation Strategies
Despite the promise, significant pitfalls exist:
- Over-reliance on Training Data Biases: AI models trained on existing databases (e.g., ClinVar) perpetuate historical interpretation biases. Mitigation: Use diverse benchmark sets, adversarial debiasing algorithms, and continuous monitoring.
- Loss of Nuance and "Knowledgeless" Automation: Blind rule application misses complex, case-specific context. Mitigation: Implement "human-in-the-loop" checkpoints for specific criteria (e.g., PM1 for mutational hotspots) or final classification sign-off.
- Lack of Transparency and Auditability: Many AI systems provide a classification without a clear evidential trail. Mitigation: Require tools to output a complete audit trail mapping each datum to an ACMG-AMP criterion with strength and weight.
- Integration and Maintenance Overhead: Automating a dynamic guideline requires constant updates to knowledge bases and rule engines. Mitigation: Adopt modular, microservices-based architectures that allow independent updating of evidence retrieval modules.
Automation and AI are indispensable for scaling variant interpretation to meet the demands of genomic medicine, directly addressing key throughput and consistency limitations of the ACMG-AMP guidelines. The future lies not in fully automated replacement but in augmented intelligence—where curated tools handle high-volume, rule-based evidence aggregation, freeing expert curators to focus on complex, contradictory, or novel variants. Success requires rigorous, protocol-driven validation, a commitment to transparency, and a toolkit designed for interoperability. Ongoing research must focus on creating dynamic, adaptable systems that evolve with the guidelines themselves and the expanding genomic knowledge base.
Benchmarking the Standard: Validation Studies and Comparative Analysis with Emerging Models
The American College of Medical Genetics and Genomics (ACMG) and the Association for Molecular Pathology (AMP) variant classification guidelines provide a critical framework for interpreting sequence variants in clinical settings. However, a central challenge lies in the subjective application of evidence criteria, leading to discrepancies in variant classification. This inconsistency, observed both inter-laboratory (between different diagnostic labs) and inter-reviewer (between different experts within the same lab), undermines the reproducibility and reliability of genomic medicine. This whitepaper synthesizes current research on concordance rates, details experimental methodologies for its assessment, and discusses implications for the evolution of the ACMG-AMP framework.
Quantitative Data on Concordance Rates
Recent studies have systematically measured concordance, revealing significant variability.
Table 1: Inter-Laboratory Concordance for ACMG-AMP Classifications
| Study & Year | Variant Type | Number of Labs | Overall Concordance Rate | Key Findings |
|---|---|---|---|---|
| Perez-Palma et al. (2020) Genome Med | Epilepsy-associated genes | 9 | 34.4% (Pathogenic/Likely Pathogenic) | Major discordance due to differences in applying de novo (PS2) and allelic frequency (PM2) criteria. |
| Garrett et al. (2021) J Mol Diagn | Hereditary Cancer | 10 | 78% (4-class) | Discordance primarily in VUS and Likely Benign categories; improved with structured rules. |
| Yang et al. (2022) JAMA Netw Open | Cardiomyopathy & RASopathy | 8 labs, 3 panels | 71.2% (5-class) | Highest discordance for variants with conflicting evidence or in genes with limited disease association. |
| MSCI Data (2023) | Broad Panels | 12 | 65-90% (dependent on gene-disease pair) | Concordance highest for well-established genes (e.g., BRCA1) and lowest for novel genes. |
Table 2: Inter-Reviewer Concordance Studies
| Study & Year | Reviewers | Variant Set | Concordance Rate | Primary Source of Disagreement |
|---|---|---|---|---|
| Amendola et al. (2016) AJHG | 9 reviewers | 99 variants | 71% (5-class) | Weighting and combination of moderate/strong criteria (e.g., PM1, PM2, PP2). |
| Ghosh et al. (2022) Hum Mutat | 5 clinical labs (internal reviewers) | 12 complex variants | 58% (initial); 92% (post-curation) | Interpretation of in silico predictions (PP3/BP4) and case-level data (PS4/PP4). |
| Tavtigian et al. (2020) Hum Mutat | 3 expert committees | 32 RAD51C variants | 81% (post-discussion) | Thresholds for functional assay evidence (PS3/BS3). |
Experimental Protocols for Assessing Concordance
Protocol for Multi-Laboratory Ring Trials
Objective: To quantify inter-laboratory consistency in variant classification. Materials: See "The Scientist's Toolkit" below. Method:
- Variant Selection & Blinding: A coordinating committee selects a set of variants (typically 20-50) spanning classification categories, with an emphasis on those with ambiguous or conflicting evidence. All case data (phenotype, ancestry, family history) is standardized.
- Participant Recruitment: Clinical laboratories with CAP/CLIA certification are invited. Each lab designates an analysis team.
- Independent Classification: Labs receive blinded variant packets. They classify each variant per ACMG-AMP guidelines using their internal protocols and submit a classification report with the applied evidence codes.
- Data Analysis: The coordinating center performs concordance analysis:
- Raw Concordance: Percentage of variants where all labs agree on the exact classification (e.g., Pathogenic vs. Likely Pathogenic).
- Category Concordance: Percentage where classifications fall into the same clinical bin (e.g., Pathogenic/Likely Pathogenic vs. VUS vs. Benign/Likely Benign).
- Evidence Code Analysis: Frequency and pattern of evidence code usage are compared.
- Resolution & Discussion: A follow-up meeting is held where labs discuss discordant variants to identify root causes (e.g., different thresholds for population data).
Protocol for Inter-Reviewer Agreement Studies
Objective: To measure subjectivity in evidence appraisal among experts within the same ecosystem. Method:
- Reviewer Cohort: Recruit variant scientists, clinical geneticists, and molecular pathologists from a consortium or multiple institutions.
- Structured Survey: Develop a survey presenting variants with associated clinical and experimental data. Use branching logic to force reviewers to specify:
- The applicability and strength (Supporting/Moderate/Strong/Very Strong) assigned to each ACMG-AMP criterion.
- The final classification.
- Confidence level in the classification.
- Independent Assessment: Reviewers complete the survey independently, without consultation.
- Statistical Analysis: Calculate Fleiss' Kappa (κ) for multi-rater agreement on classification categories and on individual evidence criteria. κ < 0.20 = slight agreement; 0.21-0.40 = fair; 0.41-0.60 = moderate; 0.61-0.80 = substantial; >0.81 = near perfect.
- Qualitative Analysis: Review comments to identify recurring themes in interpretive challenges.
Visualizations
Diagram Title: Inter-Lab Concordance Study Workflow
Diagram Title: Subjectivity in ACMG-AMP Application
The Scientist's Toolkit: Key Research Reagent Solutions
Table 3: Essential Materials for Concordance Studies
| Item / Solution | Function in Concordance Research | Example/Provider |
|---|---|---|
| Standardized Variant Datasets | Provides blinded, well-characterized variants with curated evidence for ring trials. | ClinGen Variant Curation Expert Panel (VCEP) benchmark sets, Genomic England PanelApp. |
| Variant Curation Platforms | Enforces structured application of ACMG-AMP rules, logs decisions, and facilitates data sharing. | ClinGen's VCI (Variant Curation Interface), Franklin by Genoox, Fabric Genomics. |
| Population Genome Databases | Critical for consistent application of BA1/BS1/PM2 criteria based on allele frequency. | gnomAD, dbSNP, 1000 Genomes Project, ethnically matched cohort databases. |
| In Silico Prediction Tools Suite | Provides data for PP3/BP4 criteria; consistency requires using the same tools & thresholds. | Combined Annotation Dependent Depletion (CADD), REVEL, PolyPhen-2, SIFT, SpliceAI. |
| Functional Assay Standards | Reference materials for PS3/BS3 criteria; lack of standards is a major source of discordance. | CRISPR-engineered isogenic cell lines, synthetic variant clones (e.g., from Addgene). |
| Statistical Agreement Packages | Calculates concordance metrics (Fleiss' Kappa, % agreement, Krippendorff's alpha). | R packages (irr, psych), Python (statsmodels, nltk). |
| Clinical Phenotype Ontologies | Standardizes phenotypic data for PP4/BP6 criteria. | Human Phenotype Ontology (HPO), OMIM. |
Within the broader research on the challenges and limitations of the American College of Medical Genetics and Genomics (ACMG)-Association for Molecular Pathology (AMP) 2015 variant interpretation guidelines, a critical area of investigation is their comparison to subsequent international adaptations. Systems like ClinGen (US), Cancer Variant Interpretation Group UK (CanVIG-UK), and the Australian VCGS Variant Interpretation Committee (VIC) have refined the original framework to address perceived inconsistencies and gaps. This whitepaper provides a technical, in-depth comparative analysis, contextualizing these systems as iterative solutions to core ACMG-AMP limitations.
Core Framework: A Quantitative Comparison
The table below quantifies key modifications in the studied systems relative to the original ACMG-AMP guidelines.
Table 1: Quantitative Comparison of Criterion Modifications and Specifications
| System (Primary Jurisdiction) | Key Modifications Relative to ACMG-AMP (2015) | Number of New/Modified Criteria* | Standardized Point Values? | Key Domain of Focus |
|---|---|---|---|---|
| ACMG-AMP (2015) | Original framework of 28 criteria (16 pathogenic, 12 benign). | Baseline (28) | No (Likelihood Ratios suggested) | General Mendelian disorders. |
| ClinGen SVI (US) | Refined strength definitions for in silico (PP3/BP4) and allele frequency (BS1/PM2) criteria. Provided calibrated population frequency thresholds. | 8+ refined specifications | Yes (for specific criteria) | General, with disease-specific specifications. |
| CanVIG-UK (UK) | Adapted for somatic cancer variants. Introduces "Evidence Streams" (Functional, Tumour, Population, Miscellaneous). Recalibrates strength for cancer context. | ~15 modified applications | Yes (Pre-defined strength per criterion) | Somatic cancer genomics. |
| VIC (Australia) | "Rulebook" approach with highly granular, dichotomous decision trees for each criterion. Removes ambiguity in application. | All 28 criteria exhaustively specified | Implicit in decision logic | General, with emphasis on consistency. |
*Estimate based on published specifications; counts represent substantial clarifications or changes in application strength.
Table 2: Pathogenic Likelihood Classifications and Thresholds
| System | Classification | Supporting Points (Approx.) | Strong Points (Approx.) | Very Strong Points (Approx.) |
|---|---|---|---|---|
| ACMG-AMP/ClinGen | Pathogenic | ≥ 2 Strong (PS) OR 1 Very Strong (PVS) + ≥1 Moderate (PM) OR 1 PS + ≥2 PM OR ≥4 PM | 1.5 (PS) | 2.0 (PVS) |
| CanVIG-UK | Pathogenic (Tier 1) | ≥1 PVS OR ≥1 PS + ≥2 PM OR 1 PS + 1 PM + ≥2 Supporting (P) OR ≥3 PM + ≥2 P | 1.0 (PS) | 2.0 (PVS) |
| ACMG-AMP/ClinGen | Likely Pathogenic | 1 PVS + 1 PM OR 1 PS + 1-2 PM OR 1 PS + ≥2 Supporting (PP) OR ≥2 PM + ≥2 PP | 1.5 (PS) | 2.0 (PVS) |
| CanVIG-UK | Likely Pathogenic (Tier 2) | 1 PS + 1 PM OR ≥3 PM OR 2 PM + ≥2 P | 1.0 (PS) | 2.0 (PVS) |
Detailed Methodologies and Experimental Protocols
3.1. Protocol for Criterion Specification (ClinGen SVI Working Group Model) Objective: To refine the evidence strength of a specific ACMG-AMP criterion (e.g., PM1: Located in a mutational hot spot and/or critical and well-established functional domain).
- Case Collection: Assemble a large set of validated variant cases (e.g., known pathogenic and benign variants) within a specific gene or disease domain.
- Blinded Application: Have multiple independent laboratories/experts apply the PM1 criterion to each variant in a blinded fashion, recording the intended evidence strength (Supporting/Moderate/Strong).
- Analysis of Discordance: Quantify inter-reviewer concordance rates using Cohen's kappa statistic. Low concordance indicates a criterion requiring refinement.
- Calibration: Using the validated variant set as a truth standard, calculate positive predictive values (PPV) for different applications of the rule (e.g., "hotspot" vs. "established domain").
- Specification: Define precise, context-specific conditions that must be met to assign a given evidence level (e.g., "PM1_Strong" may require variant location in a well-characterized hotspot with >5 unrelated pathogenic variants).
- Validation: Test the new specification on a separate set of variants and measure improvement in concordance and accuracy.
3.2. Protocol for VIC "Rulebook" Implementation Objective: To create a deterministic, flowchart-based application of the ACMG-AMP criteria.
- Criterion Deconstruction: For each ACMG-AMP criterion, list every possible variable or condition that affects its application.
- Decision Tree Logic: Construct a binary (Yes/No) decision tree using all variables. Each node is a specific, answerable question (e.g., "Is the variant located in a domain where ≥90% of known pathogenic variants occur?").
- Pathway-to-Strength Mapping: Each terminal leaf of the tree maps to a definitive evidence strength (e.g., "PP3Supporting," "PM2Moderate") or "Not Met."
- Pilot and Refinement: Apply the rulebook to a historical cohort. Any ambiguity or need for expert judgment identifies a gap in the decision tree, prompting further granularity.
- Automation Potential: The final rulebook logic can be directly encoded into software for consistent computational application.
Visualizing the Evolution of Evidence Integration
Diagram 1: Evolution from ACMG to Automated Systems
The Scientist's Toolkit: Research Reagent Solutions
Table 3: Essential Reagents and Materials for Variant Interpretation Research
| Item | Function in Variant Interpretation Research |
|---|---|
| Reference Variant Datasets (e.g., ClinVar, gnomAD) | Provide population allele frequency data (for BS1/PM2) and curated assertions for benchmarking interpretation systems. |
| In Silico Prediction Tool Suites (e.g., REVEL, CADD, AlphaMissense) | Computational reagents used to apply PP3/BP4 criteria. Calibrating their thresholds is a key research activity. |
| Functional Assay Kits (e.g., Luciferase Reporter, Splicing Minigene) | Standardized experimental reagents to generate laboratory evidence (PS3/BS3) for novel variants under study. |
| Gene-Specific Variant Databases (LSDBs) | Curated disease- and gene-specific knowledge on domain structure (PM1) and established pathogenic variants (PS1). |
| Variant Interpretation Management Software (e.g., VIC, Franklin) | Digital platforms that encode rule specifications and decision trees, enabling high-throughput, consistent variant assessment. |
The comparative analysis reveals that international systems (ClinGen, CanVIG-UK, VIC) are not replacements but evolutionary descendants of ACMG-AMP, directly addressing its core limitations of ambiguity and context-dependency. ClinGen provides calibrated specifications, CanVIG-UK re-engineers the framework for somatic cancer, and VIC pursues deterministic automation. This evolution, central to thesis research on ACMG-AMP challenges, demonstrates a field moving from qualitative guidelines towards quantitative, reproducible, and disease-aware standards, thereby enhancing reliability for clinical diagnostics and drug development target validation.
The American College of Medical Genetics and Genomics (ACMG) and the Association for Molecular Pathology (AMP) guidelines have become the cornerstone for variant interpretation in clinical genomics. While essential for standardizing pathogenicity assessments (Pathogenic, Likely Pathogenic, Variant of Uncertain Significance [VUS], Likely Benign, Benign), a critical gap persists: the reliance on limited, often siloed clinical and functional data. This framework struggles with the inherent challenge of establishing clinical validity—the association between a genetic variant and a specific disease phenotype—without robust, large-scale, real-world outcome data. This whitepaper argues that the next evolution in precision medicine and drug development requires a paradigm shift towards aggregating and analyzing longitudinal, real-world evidence (RWE) to bridge this validation chasm.
The Core Limitation: Inferring Clinical Validity from Limited Datasets
The ACMG-AMP criteria weigh evidence from population data, computational predictions, functional data, and segregation data. However, these data sources are frequently fragmented.
Table 1: Limitations of Current ACMG-AMP Evidence Sources for Clinical Validity
| Evidence Source (ACMG/AMP Criterion) | Common Limitation for Clinical Validity | Impact on Drug Development |
|---|---|---|
| Population Data (BS1, PM2) | Derived from control databases (gnomAD) lacking detailed phenotype follow-up. Cannot confirm absence of subclinical or late-onset phenotypes. | Overestimation of variant benignity risks missing therapeutic targets. |
| Computational Evidence (PP3, BP4) | In silico predictions of pathogenicity do not equate to clinical disease manifestation or severity. | Poor prediction of drug response phenotypes or modifier effects. |
| Functional Data (PS3, BS3) | Often from in vitro or model systems; clinical correlate (penetrance, expressivity) remains unknown. | Leads to investment in compounds targeting biologically relevant but clinically insignificant pathways. |
| Case-Control & Family Data (PP1, PS4) | Typically from small, curated research cohorts; not representative of general population disease prevalence or presentation. | Biased estimation of treatable patient population size and clinical trial recruitment. |
The culmination is a high rate of VUS classifications and misclassified variants, creating uncertainty for clinical diagnosis and complicating patient stratification for clinical trials.
The Imperative for Large-Scale, Real-World Outcome Data
Real-World Data (RWD) refers to data relating to patient health status and/or the delivery of healthcare routinely collected from diverse sources. Real-World Evidence (RWE) is the clinical evidence derived from analysis of RWD. For genomic variant interpretation, RWD sources include:
- Linked Biobanks: Genomic data paired with longitudinal electronic health records (EHRs).
- Disease Registries: Prospective cohorts tracking natural history.
- Pharmacogenomic Databases: Drug response and adverse event data linked to genotypes.
- Consumer Genomics Databases: With consent, data from large-scale direct-to-consumer testing.
Table 2: Comparison of Evidence Scale and Context
| Data Type | Typical Sample Size | Phenotype Depth | Longitudinal Follow-up | Population Diversity |
|---|---|---|---|---|
| Traditional Research Cohort | 10s - 1000s | Deep, curated | Limited | Often low |
| Clinical Trial Database | 100s - 10,000s | Protocol-defined | Medium-term | Increasing, but with strict inclusion criteria |
| Aggregated Real-World Data (EHR-linked) | 100,000s - Millions | Broad, unstructured | Long-term (decades) | High, reflecting clinical practice |
Methodological Framework: Generating RWE for Variant Validation
Implementing RWE studies requires rigorous protocols to ensure data quality and analytical validity.
Protocol for a Retrospective Cohort Study Using EHR-Linked Biobank Data
Objective: To assess the clinical penetrance and phenotypic spectrum of a VUS in Gene X associated with Condition Y.
- Cohort Definition:
- Exposed Cohort: Identify all individuals within the biobank (e.g., UK Biobank, All of Us) with the specified VUS in Gene X.
- Unexposed Cohort: Perform 1:4 matching based on age, sex, genetic ancestry, and enrollment date. Individuals must have no pathogenic/likely pathogenic variants in Gene X.
- Phenotype Ascertainment:
- Primary Outcome: Diagnosis of Condition Y (ICD-10 codes) with manual chart review for confirmation.
- Secondary Outcomes: Related quantitative traits (e.g., lab values, imaging results), comorbidities, and age at diagnosis.
- Data Extraction: Use standardized phenotyping algorithms (e.g., Phenotype KnowledgeBase, PheKB) applied to EHR data.
- Statistical Analysis:
- Calculate hazard ratios (HR) and cumulative incidence for Condition Y in exposed vs. unexposed using Cox proportional hazards models.
- Adjust for matched variables and additional potential confounders (e.g., smoking status).
- Perform sensitivity analyses across genetic ancestry groups.
Protocol for a Prospective Registry Study for Variant Reclassification
Objective: To reclassify VUS through active longitudinal data collection.
- Participant Recruitment: Recruit probands and family members carrying a VUS via clinical testing labs or advocacy groups.
- Data Collection Waves:
- Baseline: Whole exome/genome sequencing, detailed medical history, physical exam.
- Annual Follow-up: Standardized health questionnaires, release of new medical records, and reporting of major clinical events.
- Trigger-based Assessment: Detailed phenotyping if a related clinical symptom emerges.
- Evidence Integration: Apply a modified ACMG-AMP framework that incorporates pre-specified, quantitative thresholds from registry data (e.g., PS4: OR >5.0 with p<0.01 from cohort analysis within the registry).
Visualizing the RWE Integration Workflow
Diagram Title: Integrating Real-World Data into Variant Reclassification
The Scientist's Toolkit: Research Reagent Solutions
Table 3: Essential Resources for RWE Genomic Studies
| Item / Resource | Function & Relevance |
|---|---|
| Phenotype Algorithms (PheKB, HPO) | Standardized code sets (ICD, CPT, LOINC) and human-readable terms (Human Phenotype Ontology) to extract and harmonize clinical traits from disparate EHRs. |
| Genotype Harmonization Tools (PLINK, Hail) | Software for processing and quality controlling large-scale genomic data, performing population stratification, and executing association tests. |
| Secure Cloud Workspaces (Terra, DNAnexus) | Integrated platforms co-locating genomic data, EHR derivatives, and analysis tools in a compliant, scalable computing environment. |
| Variant Annotation Suites (ANNOVAR, VEP) | Pipelines to annotate genetic variants with population frequency, in silico predictions, and functional data, providing input for ACMG-AMP classification engines. |
| ACMG-AMP Classification Engines (InterVar, Varsome) | Semi-automated tools to apply ACMG-AMP rules, providing a baseline classification that can be modified with RWE. |
| Biobank-Specific SDKs/APIs (UK Biobank RAP, All of Us CDR) | Programmatic toolkits provided by major biobanks to enable efficient and authorized data querying and analysis within their secure research platforms. |
The limitations of the ACMG-AMP framework in establishing clinical validity are not a failure of the guidelines but a reflection of historical data constraints. For researchers and drug developers, the path forward requires proactive participation in the generation and synthesis of large-scale RWE. This involves supporting linked biobank initiatives, contributing to disease registries, and advocating for data-sharing frameworks that prioritize patient privacy while enabling research. Only by closing this validation gap can we fully realize the promise of precision medicine, ensuring therapies are developed for genetically defined populations with clear expectations of clinical benefit.
The 2015 ACMG-AMP guidelines for variant interpretation established a semi-quantitative framework for classifying sequence variants as Pathogenic, Likely Pathogenic, Uncertain Significance, Likely Benign, or Benign. A critical, yet initially under-specified, component was the specification of the strength of individual pieces of evidence (e.g., PS1–PS4, PM1–PM6, etc.). The ClinGen Sequence Variant Interpretation (SVI) Working Group was formed to refine these criteria, emphasizing the need for disease- and gene-specific adaptations to ensure accurate variant classification.
This whitepaper examines the successes of these specialty-specific adaptations, focusing on cardiology (e.g., inherited cardiomyopathies) and oncology (e.g., hereditary cancer syndromes). It is framed within the broader research thesis that while the ACMG-AMP guidelines provided a vital foundation, their generic application revealed significant limitations, necessitating expert-driven, evidence-based specifications to improve consistency and clinical utility.
The Imperative for Specialty-Specific Adaptations
Generic ACMG-AMP criteria can be misapplied across diverse genetic contexts. For example, the population frequency threshold (BA1) suitable for a highly penetrant childhood disorder is inappropriate for a lower-penetrance adult-onset cancer gene. The SVI process involves:
- Defining disease mechanism and associated genes.
- Curating disease-specific literature on genotype-phenotype correlations.
- Quantifying internal laboratory data.
- Proposing modified criteria weights or gene/disease-specific guidance.
These adaptations are documented in publicly available ClinGen Variant Curation Expert Panel (VCEP) specifications.
Case Study 1: Cardiomyopathy (MYH7-associated disease)
The ClinGen Cardiomyopathy Expert Panel developed specific rules for classifying variants in genes like MYH7 (Hypertrophic Cardiomyopathy, HCM).
Key Adaptation: Redefining PM1 (Mutation Hotspot/Critical Functional Domain)
- Generic PM1: Located in a mutational hot spot and/or critical and well-established functional domain without benign variation.
- Cardiomyopathy-specific PM1: For MYH7, the myosin head/rod junction region (residues 780-840) was defined as a critical domain based on its structural role and enrichment of pathogenic variants. Variants in this region can be assigned PM1_Strong.
- Quantitative Basis: Analysis of ~4,000 MYH7 variants showed a >90% pathogenic prevalence in this region versus <50% in other protein regions.
Key Adaptation: Refining PP2 (Missense Variant in Gene with Low Rate of Benign Missense Variation)
- Gene-specific application: MYH7 has a low rate of benign missense variation and high rate of pathogenic missense variation. The panel specified that PP2 can be applied for any rare MYH7 missense variant not meeting other criteria.
Table 1: Quantitative Impact of Cardiomyopathy-Specific Adaptations (Illustrative Data)
| Metric | Before Specific Adaptations (Generic ACMG) | After Disease-Specific Adaptations (ClinGen SVI) | Source |
|---|---|---|---|
| Inter-laboratory Concordance for 10 challenging MYH7 VUS | 40% | 90% | Kelly et al., Circ Genom Precis Med, 2020 |
| Rate of VUS Classifications in clinical testing | ~30-40% | Projected reduction of 15-25% | ClinGen VCEP Data |
| Strength of PM1 applied to head/rod junction | PM1 (Moderate) | PM1_Strong (Strong) | ClinGen Specification |
Experimental Protocol for Defining Critical Domains (e.g., PM1):
- Data Aggregation: Collate variant-level data from public databases (gnomAD, ClinVar), large consortiums (e.g., SHaRe), and published cohorts.
- Pathogenicity Enrichment Analysis: Map all missense variants to protein domains. Calculate pathogenic prevalence (Pathogenic Variants / (Pathogenic + Benign Variants)) for each domain using stringent clinical classifications.
- Statistical Thresholding: Define a "critical domain" as one where the pathogenic prevalence exceeds a pre-defined threshold (e.g., >0.95) with a statistically significant Fisher's exact test (p < 0.01) compared to the rest of the gene.
- Functional Corroboration: Overlay domain boundaries with known 3D protein structures and published functional assays (e.g., ATPase activity, actin sliding velocity) to confirm biological plausibility.
Research Reagent Solutions for Cardiomyopathy Variant Analysis:
| Item | Function in Experiment |
|---|---|
| HEK-293 or COS-7 Cells | Heterologous expression system for initial protein localization and solubility assays. |
| Induced Pluripotent Stem Cell (iPSC) Cardiomyocytes | Disease-relevant cell type for assessing sarcomere assembly, contractility, and calcium handling. |
| Recombinant Wild-Type & Mutant Myosin Heavy Chain Proteins | For in vitro motility assays and ATPase activity measurements to determine direct biophysical impact. |
| Alpha-Actinin (ACTN2) Antibody [Clone EA-53] | Immunofluorescence marker for Z-discs to assess sarcomere regularity in cardiomyocytes. |
| Fluo-4 AM Calcium Indicator Dye | For live-cell imaging of calcium transients, a key readout of cardiomyocyte function. |
Title: Workflow for Defining a Gene-Specific PM1 Domain
Case Study 2: Hereditary Cancer (PTEN Hamartoma Tumor Syndrome)
The ClinGen PTEN Expert Panel tailored criteria for the PTEN gene, which exhibits unique characteristics like a high population allele frequency for some missense variants and frequent somatic mosaicism.
Key Adaptation: Adjusting Population Frequency Thresholds (BA1, BS1)
- Generic BA1: Allele frequency > 5% in ExAC/gnomAD is considered Benign Standalone.
- PTEN-specific BA1: For PTEN-related disorders (high penetrance), BA1 threshold was lowered to 0.001 (0.1%) in gnomAD v2.1.1 non-cancer subset, reflecting the gene's constraint and disease prevalence.
- Rationale: The most common PTEN pathogenic missense variant, p.Ile135Leu, has a population frequency of ~0.002, which would be erroneously ruled benign by the generic threshold.
Key Adaptation: Specifying PVS1 (Null Variant) Strength
- Gene-specific application: For PTEN, all nonsense, frameshift, and canonical ±1 or 2 splice-site variants initiating upstream of the last 50 amino acids are assigned PVS1_Strong. This is due to the known mechanism of haploinsufficiency and the absence of a dominant-negative effect or alternative isoforms that rescue function.
Table 2: Quantitative Impact of PTEN-Specific Adaptations (Illustrative Data)
| Metric | Before Specific Adaptations (Generic ACMG) | After Disease-Specific Adaptations (ClinGen SVI) | Source |
|---|---|---|---|
| Misclassification Risk for p.Ile135Leu (AF~0.002) | High (False Benign via BA1) | Eliminated (BA1 threshold = 0.001) | Mester et al., Genet Med, 2021 |
| Strength of PVS1 for nonsense variant in exon 5 | PVS1 (Very Strong) | PVS1_Strong (Very Strong) | ClinGen PTEN VCEP |
| Consistency in applying PM2 (Absent from controls) | Inconsistent | Codified use of non-cancer gnomAD subset | ClinGen Specification |
Experimental Protocol for Determining Population Thresholds (BA1/BS1):
- Cohort Definition: Establish a "case" cohort of well-phenotyped, molecularly confirmed patients with the specific disorder (e.g., PTEN Hamartoma Tumor Syndrome).
- Variant Identification: Curate a set of bona fide pathogenic variants from this cohort.
- Control Data Sourcing: Obtain allele frequencies from large, ancestry-matched population databases (e.g., gnomAD non-cancer subset).
- Frequency Analysis: For each confirmed pathogenic variant, record its maximum population allele frequency (MAF).
- Threshold Calculation: Set the disease-specific BA1 threshold above the highest MAF observed among true pathogenic variants (with an added buffer, e.g., 5-10x). This ensures no true pathogenic variant is automatically ruled benign.
Research Reagent Solutions for Cancer Variant Functional Assays:
| Item | Function in Experiment |
|---|---|
| PTEN-Null Cell Line (e.g., U87MG glioblastoma) | Isogenic background for reconstitution experiments to assess mutant protein function. |
| Anti-PTEN Antibody [Clone D4.3] XP | Western blot detection of PTEN protein expression and stability. |
| PIP3 ELISA Kit | Quantifies cellular phosphatidylinositol (3,4,5)-trisphosphate levels, the direct substrate of PTEN's lipid phosphatase activity. |
| Anti-pAKT (Ser473) Antibody | Readout of PI3K/AKT pathway activation status downstream of PTEN function. |
| Lentiviral Expression Constructs (WT/mutant PTEN) | For stable, physiologically relevant expression of variants in mammalian cells. |
Title: PTEN Function in the PI3K/AKT Signaling Pathway
Synthesis and Future Directions
Specialty-specific SVI adaptations have demonstrably improved variant classification by:
- Increasing Consistency: Reducing inter-lab discordance.
- Reducing VUS Rates: By strengthening or weakening criteria based on gene-specific data.
- Enhancing Clinical Actionability: Providing clearer classifications for clinical decision-making.
These successes underscore a central tenet of the broader thesis on ACMG-AMP limitations: a one-size-fits-all framework is insufficient for precision medicine. The future lies in the continued development and computational integration of these expert-curated specifications into variant interpretation pipelines, ensuring they are dynamically applied at scale. Ongoing challenges include managing overlapping disease phenotypes, integrating somatic cancer data for germline interpretation, and developing adaptations for more complex genetic models (e.g., oligogenic inheritance).
The 2015 ACMG-AMP guidelines for variant pathogenicity interpretation established a critical framework for clinical genetics. However, a core research thesis has emerged highlighting its inherent challenges: qualitative descriptors ("Supporting," "Strong") introduce subjectivity, lack quantitative rigor for integrating evidence, and struggle with discordant or complex evidence combinations. This has spurred the development of quantitative, point-based systems designed to address these limitations by assigning explicit, pre-defined weights to evidence items. This whitepaper provides an in-depth technical comparison of two leading frameworks: Sherloc (Semi-quantitative Hierarchical Rule-based LOgic for Causality) and the OPPI (Objective Prioritization for Pathogenicity Interpretation) methodology, situating them as direct responses to the documented constraints of the ACMG-AMP paradigm.
System Architectures & Methodological Foundations
Sherloc refines the ACMG-AMP categories into a more granular, hierarchical structure. It employs a semi-quantitative points system where evidence tiers (Very Strong, Strong, Moderate, Supporting) are assigned fixed point values. Crucially, it introduces formal logical rules (e.g., "independence principles") for evidence combination and mandatory consideration of alternative etiologies, moving toward a more structured Bayesian framework.
OPPI represents a fully quantitative, Bayesian implementation. It starts by defining the prior probability of pathogenicity for a variant class. Each piece of evidence is modeled as a likelihood ratio (LR), derived from empirical population or functional data. The posterior probability is calculated by sequentially multiplying the prior by each LR. Final classification is based on posterior probability thresholds aligned with ACMG categories.
The logical relationship between these systems and the traditional ACMG-AMP framework is depicted below.
Diagram 1: Evolution from ACMG-AMP to Quantitative Systems
Quantitative Data & Direct Comparison
The core quantitative differences are summarized in the following tables.
Table 1: Evidence Weighting & Combination Logic
| Feature | ACMG-AMP | Sherloc | OPPI |
|---|---|---|---|
| Weighting Basis | Qualitative category (PVS1, PM1, etc.) | Fixed points per tier (e.g., Strong = 4 pts) | Empirical Likelihood Ratio (LR) |
| Combination Method | Subjective counting/rules | Summation with hierarchical rules & caps | Bayesian multiplication: Prior × LR₁ × LR₂... |
| Quantitative Output | Pathogenic/Likely Pathogenic/etc. | Total point score | Posterior Probability (PP) |
| Handling Discordance | Expert judgement | Formal "independence" and "alternative cause" rules | Natural outcome of LR <1 (benign) and LR >1 (pathogenic) multiplication |
Table 2: Classification Thresholds & Outcomes
| System | Benign | Likely Benign | VUS | Likely Pathogenic | Pathogenic |
|---|---|---|---|---|---|
| Sherloc (Points) | ≤ 0 | 1 - 4 | 5 - 9 | 10 - 11 | ≥ 12 |
| OPPI (Posterior Prob.) | < 0.001 | 0.001 - 0.1 | 0.1 - 0.9 | 0.9 - 0.99 | > 0.99 |
| ACMG-AMP Equivalent | Benign | Likely Benign | VUS | Likely Pathogenic | Pathogenic |
Experimental Protocols for Validation
A standard protocol for empirically comparing these systems involves retrospective analysis of curated variant datasets.
Protocol: Benchmarking System Performance
Variant Cohort Curation:
- Assemble a "gold-standard" set of variants with established pathogenicity (e.g., from ClinVar, with expert review).
- Include a spectrum: clear pathogenic, clear benign, and challenging VUS.
- Annotate each variant with all relevant evidence: population frequency, computational predictions, functional data, segregation, etc.
Blinded Re-Classification:
- Apply Sherloc and OPPI rulesets independently to each variant using the annotated evidence.
- For OPPI, define gene- and domain-specific prior probabilities and LRs from control population data (e.g., gnomAD) and functional assay calibrations.
- For Sherloc, apply its hierarchical point assignment and summation rules.
Outcome Analysis & Metrics:
- Compare final classifications (Pathogenic/Benign/VUS) to the gold-standard.
- Calculate performance metrics: Sensitivity, Specificity, Positive Predictive Value (PPV), Negative Predictive Value (NPV).
- Measure inter-analyzer concordance for each system versus ACMG-AMP.
Diagram 2: Experimental Benchmarking Protocol Workflow
The Scientist's Toolkit: Research Reagent Solutions
Table 3: Essential Resources for Quantitative Pathogenicity Research
| Item / Resource | Function / Purpose | Example / Provider |
|---|---|---|
| Curated Variant Datasets | Gold-standard benchmarks for system training and validation. | ClinVar Expert Panels, BRCA1/2, LDLR, etc. |
| Population Frequency Databases | Source for deriving prior probabilities and benign evidence (BA1/BS1). | gnomAD, dbSNP, 1000 Genomes |
| Functional Assay Calibrations | Converts raw assay data (e.g., % activity) into calibrated LRs for PS3/BS3. | BRCA1 saturation genome editing data, CFTR electrophysiology |
| In Silico Prediction Meta-tools | Aggregates computational predictors for PP2/BP1 evidence weighting. | REVEL, MetaLR, CADD |
| Bayesian Calculation Software | Automates posterior probability calculation for OPPI-like frameworks. | InterVar, Varsome (commercial), custom R/Python scripts |
| Variant Annotation Pipelines | Automates collection of evidence items from primary databases. | ANNOVAR, Ensembl VEP, bcftools |
| ACMG/Sherloc Rule Applications | Software implementing rule logic for consistent application. | Sherloc framework tools, Franklin (Genoox) |
The American College of Medical Genetics and Genomics (ACMG) and the Association for Molecular Pathology (AMP) established a seminal framework for variant pathogenicity classification in 2015, with a 2025 update integrating new evidence types. However, this framework was inherently designed around short-read sequencing and the interrogation of protein-coding regions. The rapid maturation of long-read sequencing technologies and the expanding recognition of non-coding variants' clinical significance present fundamental challenges to the guideline's adaptability. This whitepaper assesses these limitations and proposes methodologies for integrating long-range genomic data and non-coding variant assessment into an evolution of the variant interpretation framework, a core research focus for modern clinical genomics.
The Challenge of Long-Range Sequencing Data
Long-read sequencing (e.g., PacBio HiFi, Oxford Nanopore) generates reads spanning tens to hundreds of kilobases, resolving complex genomic regions and enabling haplotype-phased variant detection.
Quantitative Comparison of Sequencing Platforms
Table 1: Key Metrics of Short-Read vs. Long-Read Sequencing (2024-2025 Data)
| Metric | Short-Read (Illumina NovaSeq X) | Long-Read (PacBio Revio) | Long-Read (ONT PromethION 2) |
|---|---|---|---|
| Read Length | 2x150 bp | 15-20 kb HiFi reads | >100 kb (theoretical), ~20 kb N50 |
| Raw Accuracy | >99.9% (Q30) | >99.9% (Q30) for HiFi | ~99% (Q20) raw, >99.9% post-correction |
| Output per Flow Cell/Run | 8-16 Tb | 360 Gb | 200-300 Gb (V14 chemistry) |
| Key Utility for Variants | SNVs, small indels | Large indels, SVs, phased SNVs, methylation | Large SVs, tandem repeats, modified bases |
| Cost per Gb (USD) | ~$5 | ~$15 | ~$10 |
Experimental Protocol: Resolving Complex SVs with Linked Reads and Phasing
Objective: To detect and phase a structural variant (SV) in a region with high homology (e.g., PMS2 pseudogenes) using linked-read or long-read sequencing.
Sample Prep & Library Construction:
- Extract high molecular weight (HMV) DNA (>50 kb) using magnetic bead-based kits (e.g., Circulomics Nanobind).
- For linked reads (10x Genomics): Dilute and partition DNA into Gel Bead-in-Emulsions (GEMs). Within each GEM, a shared 16bp barcode is added to all fragments derived from the same long DNA molecule. Perform shearing and standard Illumina library prep within partitions.
- For true long reads (PacBio): Prepare a 15kb SMRTbell library using ligation-based kits. Size-select using the BluePippin or SageELF system.
Sequencing & Basecalling:
- Linked reads: Sequence on Illumina NovaSeq, 2x150 bp. Process through the 10x Genomics Long Ranger pipeline for alignment (to GRCh38) and barcode-aware SV calling.
- Long reads: Sequence on PacBio Revio system. Generate HiFi reads using the CCS (Circular Consensus Sequencing) algorithm (>3 passes).
Bioinformatic Analysis:
- Alignment & SV Calling: Align reads with minimap2 (long reads) or Long Ranger aligner. Call SVs using specialized callers: pbsv (PacBio), Sniffles2 (PacBio/Nanopore), or Manta (for linked reads).
- Phasing: Use the haplotype-resolved reads directly (long reads) or leverage barcodes (linked reads) to phase SNVs/indels alongside the SV using HapCUT2 or WhatsHap.
- Visualization: Integrate results into a genome browser (e.g., IGV) for manual review of read alignment patterns across the breakpoints.
The Non-Coding Variant Interpretation Gap
Non-coding variants in promoters, enhancers, silencers, and non-coding RNAs fall outside the traditional ACMG-AMP code, which primarily utilizes PVS1 (null variant in a gene where LOF is a known mechanism).
Experimental Protocol: Functional Validation of a Non-Coding Enhancer Variant
Objective: Assess the impact of a candidate SNP within a predicted enhancer region on gene expression.
In Silico Prioritization:
- Use Ensembl/VEP to annotate variant location. Intersect with chromatin state (H3K27ac, H3K4me1) and ATAC-seq peaks from relevant cell types (from ENCODE or GTEx).
- Predict transcription factor (TF) binding alteration using tools like DeepBind or motifbreakR.
Reporter Assay (Luciferase):
- Cloning: Synthesize wild-type and mutant genomic fragments (~500-1000 bp encompassing the variant) and clone them upstream of a minimal promoter driving firefly luciferase in a plasmid (e.g., pGL4.23).
- Transfection: Co-transfect the reporter plasmid and a Renilla luciferase control plasmid (for normalization) into a relevant cell line (e.g., HeLa for general, or a differentiated cell type if available).
- Measurement: After 48 hours, lyse cells and measure firefly and Renilla luciferase activity using a dual-luciferase assay kit. Calculate the fold-change in firefly/Renilla ratio for mutant vs. wild-type. Perform in triplicate.
CRISPR-based Epigenome Editing (Follow-up):
- Design dCas9-KRAB (for repression) or dCas9-p300 (for activation) guide RNAs targeting the wild-type enhancer region in an endogenous cellular context.
- Transduce cells with lentiviral vectors expressing the dCas9-effector and guide RNA.
- Measure changes in expression of the putative target gene(s) via qRT-PCR 5-7 days post-transduction.
Visualizing Workflows and Relationships
Title: Long-Read Data to ACMG Classification Pathway
Title: Thesis Challenges and Proposed Solutions
The Scientist's Toolkit: Research Reagent Solutions
Table 2: Essential Reagents for Long-Range and Non-Coding Research
| Item | Supplier/Example | Function |
|---|---|---|
| Ultra-Long DNA Isolation Kit | Circulomics Nanobind HMW DNA Kit, Qiagen Genomic-tip 100/G | Preserves multi-kb DNA fragments essential for long-read libraries and accurate SV detection. |
| Linked-Read Library Prep Kit | 10x Genomics Chromium Genome Kit | Adds a common barcode to short reads derived from the same long DNA molecule, enabling phasing and SV detection. |
| SMRTbell Prep Kit 3.0 | PacBio | Optimized library preparation for PacBio HiFi sequencing, incorporating DNA repair, end-prep, and adapter ligation. |
| Dual-Luciferase Reporter Assay System | Promega E1910 | Quantifies transcriptional activity driven by cloned enhancer/promoter sequences by measuring firefly and control Renilla luciferase. |
| dCas9-Effector Fusion Plasmids | Addgene (#105616 dCas9-KRAB, #61423 dCas9-p300) | Enables targeted repression or activation of endogenous genomic elements (e.g., enhancers) without cutting DNA, for functional validation. |
| Chromatin Accessibility Kit (ATAC-seq) | 10x Genomics Single Cell ATAC, Illumina Tagmentation Kit | Identifies open chromatin regions genome-wide, crucial for mapping potential regulatory elements harboring non-coding variants. |
| High-Fidelity DNA Polymerase | NEB Q5, KAPA HiFi | Critical for error-free amplification of genomic regions for cloning into reporter vectors or for target enrichment prior to sequencing. |
Conclusion
The ACMG-AMP guidelines have been transformative in bringing structure to clinical variant interpretation, yet they are not a panacea. This analysis underscores that their qualitative, criterion-based nature inherently struggles with scalability, inter-rater consistency, and the nuanced biology underlying many genetic findings. Key takeaways include the critical need for richer, more diverse population data, standardized quantitative approaches to supplement qualitative criteria, and robust functional validation pipelines. For researchers and drug developers, these limitations necessitate a cautious, evidence-rich approach to variant selection for functional studies and target validation. The future lies in evolving the framework into a more dynamic, evidence-integrated, and potentially quantitative system, leveraging computational advances and global data sharing. The ongoing refinement of these guidelines is paramount for ensuring the accuracy of genetic diagnoses, the integrity of research findings, and the successful development of genetically-targeted therapies.