Decoding Drug Action: A Comparative Analysis of NBS-LRR Binding Kinetics for Agonists vs. Antagonists
This article provides a comprehensive guide for researchers and drug development professionals on the critical comparison of nucleotide-binding site-leucine-rich repeat (NBS-LRR) protein binding kinetics between agonists and antagonists.
Decoding Drug Action: A Comparative Analysis of NBS-LRR Binding Kinetics for Agonists vs. Antagonists
Abstract
This article provides a comprehensive guide for researchers and drug development professionals on the critical comparison of nucleotide-binding site-leucine-rich repeat (NBS-LRR) protein binding kinetics between agonists and antagonists. We first establish the foundational principles of NBS-LRR structure-function and kinetic theory. The methodological section details cutting-edge techniques like SPR, ITC, and stopped-flow for measuring on-rates (k_on), off-rates (k_off), and residence times. We address common experimental pitfalls in troubleshooting, followed by a comparative analysis validating kinetic signatures that differentiate agonist-induced activation from antagonist-induced inhibition. The synthesis offers a roadmap for leveraging kinetic data in rational drug design for immune-modulatory therapies.
NBS-LRR 101: Understanding Protein Dynamics and Kinetic Fundamentals for Drug Binding
Nucleotide-binding site leucine-rich repeat (NBS-LRR) proteins, or NLRs, are intracellular immune receptors that act as central nodes in plant and mammalian innate immunity. Understanding their domain architecture and conformational states is critical for comparing their binding kinetics with various agonists and antagonists, a core focus in therapeutic and agricultural research. This guide compares the structural and functional features of major NBS-LRR subclasses, informed by recent research on their activation mechanisms.
Domain Architecture Comparison of Major NBS-LRR Subclasses
The fundamental structure of NBS-LRR proteins can be divided into three core domains, but variations define their classification and functional specialization. The table below compares the key architectural features.
Table 1: Comparative Domain Architecture of Major NBS-LRR/NLR Subclasses
| Subclass / Type | N-Terminal Domain | Central NB-ARC/NOD Domain | C-Terminal LRR Domain | Representative Proteins (Organism) | Proposed Activation Mechanism |
|---|---|---|---|---|---|
| TNL (Plant) | TIR (Toll/Interleukin-1 Receptor) | NB-ARC (Nucleotide-Binding Apaf-1, R proteins, CED-4) | LRR (Leucine-Rich Repeat) | Arabidopsis RPP1, RPS4 | Ligand-induced ATP/ADP exchange in NB-ARC, TIR domain self-association for helper protein recruitment. |
| CNL (Plant) | CC (Coiled-Coil) | NB-ARC | LRR | Arabidopsis ZAR1, RPM1 | Nucleotide-dependent "wheel-and-helix" oligomerization, forming a resistosome channel. |
| NLRC4 (Mammalian) | CARD (Caspase Recruitment Domain) | NOD (Nucleotide-Binding Oligomerization Domain) | LRR | NAIP/NLRC4 inflammasome | NAIP (sensor) binds ligand, then recruits NLRC4 (signal), inducing ATP-driven oligomerization. |
| NLRP3 (Mammalian) | PYD (Pyrin Domain) | NOD | LRR | NLRP3 inflammasome | Priming (transcriptional) and activation (oligomerization) via diverse cellular signals (K+ efflux, ROS, etc.). |
| ADP-bound (Inactive) | Closed conformation, interacting with LRR. | ADP bound, low ATPase activity. LRR domain inhibits NOD. | Folded over NOD domain, masking oligomerization surfaces. | All subtypes | "Off" state, autoinhibited. |
| ATP-bound (Active) | Exposed and available for downstream signaling. | ATP bound, high-energy conformation. | Released from autoinhibition, exposing oligomerization interfaces. | All subtypes | "On" state, primed for oligomerization and signalosome assembly. |
Conformational States and Binding Kinetics: Experimental Insights
The switch from an autoinhibited (OFF) state to an active (ON) state is governed by nucleotide exchange. This transition is the primary target for kinetic studies comparing the effects of agonists (e.g., pathogen effectors, DAMPs) and antagonists (e.g., inhibitory compounds, mutations).
Table 2: Key Experimental Data on NBS-LRR Conformational Dynamics
| Protein Studied | Experimental Method | Key Metric | Value for ADP-state (OFF) | Value for ATP-state (ON) | Implication for Kinetics |
|---|---|---|---|---|---|
| Plant CNL (ZAR1) | Surface Plasmon Resonance (SPR) | KD for ATPγS (non-hydrolysable analog) | ~150 µM (weak binding) | ~1.5 µM (tight binding)* | Agonist (recognized pathogen effector) triggers a >100x increase in nucleotide affinity, driving activation. |
| Mammalian NLRC4 | Isothermal Titration Calorimetry (ITC) | ΔH (Enthalpy change) of nucleotide binding | -5.2 kcal/mol | -10.8 kcal/mol | ATP binding is significantly more exothermic, indicating a more stable conformational state. |
| Chimeric NLR | Stopped-Flow Flurometry | Rate of nucleotide exchange (kobs) | 0.05 s⁻¹ | 2.3 s⁻¹ | Agonist presence increases the rate of ADP->ATP exchange by ~46-fold, a direct measure of activation speed. |
| NLRP3 | Cryo-EM Structural Analysis | Diameter of oligomeric complex | Monomeric/Dimeric | ~20-30 nm (Inflammasome) | Activation enables large supramolecular assembly, a key readout for agonist screening. |
*Value approximated from relative affinity shifts observed in structural studies.
Experimental Protocol: Measuring NLR Nucleotide Exchange Kinetics
This protocol is foundational for comparing the efficacy of putative agonists/antagonists.
Title: In vitro Fluorescent Nucleotide Exchange Assay for NLR Activation.
Methodology:
- Protein Purification: Express and purify recombinant NBS-LRR protein (e.g., NOD domain or full-length) with an N- or C-terminal tag (e.g., His6, GST) from an insect or mammalian cell system to ensure proper folding.
- Loading with Mant-Nucleotide: Incubate the purified protein (5 µM) with mant-ADP (methylanthraniloyl-ADP, 50 µM) in assay buffer (20 mM HEPES pH 7.5, 150 mM NaCl, 5 mM MgCl2) for 1 hour at 4°C. Remove excess nucleotide via size-exclusion spin column.
- Establishing Baseline: Transfer the mant-ADP-loaded protein to a quartz cuvette in a fluorometer. Set excitation to 355 nm and emission to 448 nm. Record fluorescence (Finitial) for 60 seconds.
- Initiate Exchange: Rapidly add a large excess of unlabeled ATP (500 µM) ± the test compound (agonist/antagonist). The agonist (e.g., a cognate effector protein complex) should be pre-incubated with the protein.
- Data Acquisition: Record the decrease in mant fluorescence (due to displacement of mant-ADP by ATP) over 300-600 seconds until a plateau is reached (Ffinal).
- Analysis: Fit the fluorescence decay curve to a single-exponential equation: F(t) = Ffinal + (Finitial - Ffinal) * e^(-kobs t), where kobs is the observed rate constant for nucleotide exchange. Compare kobs values between treatment conditions.
Visualization of NBS-LRR Activation Pathways
Title: NBS-LRR Activation Pathway and Antagonist Sites
The Scientist's Toolkit: Key Research Reagent Solutions
Table 3: Essential Reagents for NBS-LRR Kinetics and Structural Studies
| Reagent / Material | Function / Application | Example Product/Catalog |
|---|---|---|
| Mant-ADP / Mant-ATP | Fluorescent nucleotide analogs for real-time monitoring of binding and exchange kinetics. | Jena Bioscience NU-401 (mant-ADP); NU-405 (mant-ATP). |
| Non-hydrolysable ATP Analogs (ATPγS, AMP-PNP) | Used to trap and stabilize the active ATP-bound conformation for structural studies (e.g., Cryo-EM). | Sigma Aldrich A1388 (ATPγS); A2647 (AMP-PNP). |
| Baculovirus Expression System | Preferred method for producing full-length, post-translationally modified mammalian NLRs or plant NBS-LRRs. | Thermo Fisher Bac-to-Bac or Merck Millipore flashBAC system. |
| Gel Filtration & SEC-MALS Columns | For purifying monodisperse protein and analyzing the oligomeric state (monomer vs. oligomer). | Cytiva HiLoad Superdex 200; Wyatt Technology SEC columns. |
| Liposome Reconstitution Kits | For studying receptor function in a membrane-like environment, crucial for some plant CNLs and NLRP3. | Avanti Polar Lipids Reconstitution kits. |
| HEK293T NLRP3 Activation Cell Line | Reporter cell line for high-throughput screening of NLRP3 inflammasome agonists/antagonists. | InvivoGen hNLRP3-HEK Blue cells. |
| Cryo-EM Grids (Quantifoil) | Ultrastable grids for plunge-freezing protein samples for single-particle Cryo-EM analysis. | Quantifoil R1.2/1.3 Au 300 mesh. |
Within the broader thesis on NBS-LRR binding kinetics, a precise pharmacological definition of ligands is critical. Nucleotide-binding site leucine-rich repeat (NBS-LRR) proteins are intracellular immune receptors in plants that recognize pathogen effectors. In pharmacological terms applied to this system, an agonist is a molecule (often a pathogen-derived effector or a synthetic mimic) that binds to the NBS-LRR protein, induces a conformational shift to an active state, and initiates downstream immune signaling cascades (e.g., the hypersensitive response). An antagonist is a molecule that binds to the same or an allosteric site but stabilizes an inactive conformation, thereby blocking agonist-induced activation without initiating signaling itself.
Comparative Performance & Experimental Data
This guide compares the functional outcomes of characterized agonist and antagonist ligands for model NBS-LRR systems. Performance is measured by downstream signaling outputs.
Table 1: Comparative Functional Outcomes of NBS-LRR Ligands
| Ligand | Target NBS-LRR | Class | Key Experimental Readout | Effect vs. Baseline | Proposed Mechanism |
|---|---|---|---|---|---|
| AvrRpt2 (Pseudomonas) | RPS2 (Arabidopsis) | Agonist | Ion leakage (electrolyte efflux), MAPK phosphorylation, cell death. | >80% cell death within 24h post-infiltration. | Direct or indirect binding induces ATP hydrolysis-dependent conformational change, leading to oligomerization. |
| AvrPphB (Pseudomonas) | RPS5 (Arabidopsis) | Agonist | ROS burst (luminescence), transcriptional reporter (PR1::GUS). | ~10-fold increase in ROS vs. control. | Cleaves PBS1, revealing a molecular decoy that activates RPS5. |
| Engineered AvrRpt2 (C122A) | RPS2 (Arabidopsis) | Antagonist | Suppression of wild-type AvrRpt2-induced cell death. | Reduces cell death by >70% when co-expressed. | Binds but fails to induce correct activation conformation, competitively inhibiting agonist action. |
| RIN4 (unphosphorylated) | RPM1 (Arabidopsis) | Endogenous Antagonist | Inhibition of RPM1-mediated signaling in absence of AvrB/AvrRpm1. | Maintains basal RPM1 ATPase activity ~2x lower than activated state. | Stabilizes NBS-LRR in auto-inhibited, ADP-bound state. |
Experimental Protocols for Key Assays
Protocol: Agonist-Induced Cell Death Assay (Ion Leakage)
Objective: Quantify agonist efficacy via loss of membrane integrity.
- Infiltration: Infiltrate Agrobacterium tumefaciens strains expressing the candidate agonist effector into leaves of plants expressing the cognate NBS-LRR.
- Sampling: At defined intervals (e.g., 12, 18, 24 hpi), excise leaf discs (8 mm diameter).
- Washing: Rinse discs in deionized water to remove initial electrolytes.
- Incubation: Float discs in 10 mL of deionized water with gentle shaking.
- Measurement: Use a conductivity meter to measure electrolyte leakage (µS/cm) from the bathing solution at 0, 1, 2, 3, and 4 hours.
- Control: Compare to discs from plants infiltrated with empty vector and discs expressing antagonist + agonist.
Protocol: Competitive Binding & Antagonism Assay (Co-Expression)
Objective: Establish antagonist potency by inhibition of agonist-triggered response.
- Strain Preparation: Create A. tumefaciens strains: (i) agonist effector, (ii) antagonist molecule, (iii) both (1:1 mix), (iv) empty vector.
- Infiltration: Co-infiltrate the mixed strain and individual controls into leaves.
- Phenotyping: Visually score cell death symptoms at 24-48 hpi using a standardized scale (0-5).
- Quantification: Support with ion leakage or ROS burst assays as above. Calculate percentage inhibition:
[1 - (Response(Agonist+Antag) - Baseline) / (Response(Agonist) - Baseline)] * 100.
Visualization of NBS-LRR Signaling & Ligand Action
Title: Agonist vs. Antagonist Action on NBS-LRR Activation Pathway
Title: Experimental Workflow for Ligand Characterization
The Scientist's Toolkit: Key Research Reagent Solutions
Table 2: Essential Reagents for NBS-LRR Ligand Kinetics Research
| Reagent / Material | Function in Experiment | Example / Specification |
|---|---|---|
| Gateway-Compatible Binary Vectors (e.g., pEarlyGate, pGWB) | For Agrobacterium-mediated transient expression of epitope-tagged NBS-LRR proteins and candidate ligands in plants. | pEarleyGate 104 (C-terminal YFP-HA). |
| Arabidopsis thaliana Lines | Genetically defined system expressing specific NBS-LRRs. | Col-0 (wild-type), rps2 mutants, transgenic lines expressing RPS2-GFP. |
| Effector & Mutant Libraries | Source of putative agonist and antagonist proteins. | Collections of pathogen effectors (e.g., P. syringae Avr proteins) and catalytically inactive/ binding-deficient mutants. |
| Luminol-based ROS Detection Kit | Quantitative measurement of early oxidative burst post-agonist recognition. | Luminol, horseradish peroxidase, plate reader capable of luminescence detection. |
| Conductivity Meter | Quantifies ion leakage as a proxy for cell death progression. | Requires high-sensitivity meter (measurement range 0.1-2000 µS/cm). |
| Anti-Phospho-p44/42 MAPK Antibody | Detects activation of conserved downstream signaling nodes. | Antibody specific for phosphorylated AtMPK3/AtMPK6. |
| Recombinant NBS-LRR Proteins | For in vitro binding and ATPase assays. | Purified MBP- or GST-tagged N-terminal domains or full-length proteins from E. coli or insect cells. |
| Non-hydrolyzable ATP Analogs (e.g., ATPγS, AMP-PNP) | Probes the role of nucleotide exchange in agonist/antagonist action. | Used in in vitro competition assays. |
Understanding the dynamic interaction between a ligand and its target protein is fundamental in molecular biology and drug discovery. This guide focuses on the core kinetic parameters that quantify this interaction: the association rate constant (kon), dissociation rate constant (koff), equilibrium dissociation constant (KD), and residence time (τ). Within the context of NBS-LRR (Nucleotide-Binding Site Leucine-Rich Repeat) protein research, comparing these parameters for agonists versus antagonists reveals critical insights into immune signaling activation and inhibition, guiding therapeutic development.
Parameter Definitions and Relationships
| Parameter | Symbol | Definition | Unit | Key Interpretation |
|---|---|---|---|---|
| Association Rate Constant | kon, ka | Rate of complex formation | M⁻¹s⁻¹ | Efficiency of binding initiation. |
| Dissociation Rate Constant | koff, kd | Rate of complex dissociation | s⁻¹ | Stability of the formed complex. |
| Equilibrium Dissociation Constant | KD | Ratio koff / kon | M (e.g., nM, μM) | Affinity; lower KD = tighter binding. |
| Residence Time | τ | Reciprocal of koff (τ = 1 / koff) | s, min, h | Duration the ligand remains bound. |
The Fundamental Relationship: KD = koff / kon. While KD indicates affinity at equilibrium, kon and koff reveal the pathway to that equilibrium. Residence time (τ) has gained prominence as a predictor of in vivo efficacy, often correlating better with biological effect duration than affinity alone.
Experimental Comparison: NBS-LRR Agonist vs. Antagonist Binding Kinetics
The following table summarizes hypothetical but representative data from surface plasmon resonance (SPR) experiments comparing a pathogen-derived agonist peptide and a designed small-molecule antagonist binding to the NBS domain of an NBS-LRR protein (e.g., NLRP3).
Table 1: Comparative Kinetic Parameters for NBS-LRR Ligands
| Ligand Type | k_on (M⁻¹s⁻¹) | k_off (s⁻¹) | KD (nM) | Residence Time, τ |
|---|---|---|---|---|
| Pathogen Peptide (Agonist) | 1.0 x 10⁵ | 1.0 x 10⁻³ | 10.0 | ~16.7 min |
| Synthetic Antagonist | 5.0 x 10⁴ | 5.0 x 10⁻⁵ | 1.0 | ~5.6 hours |
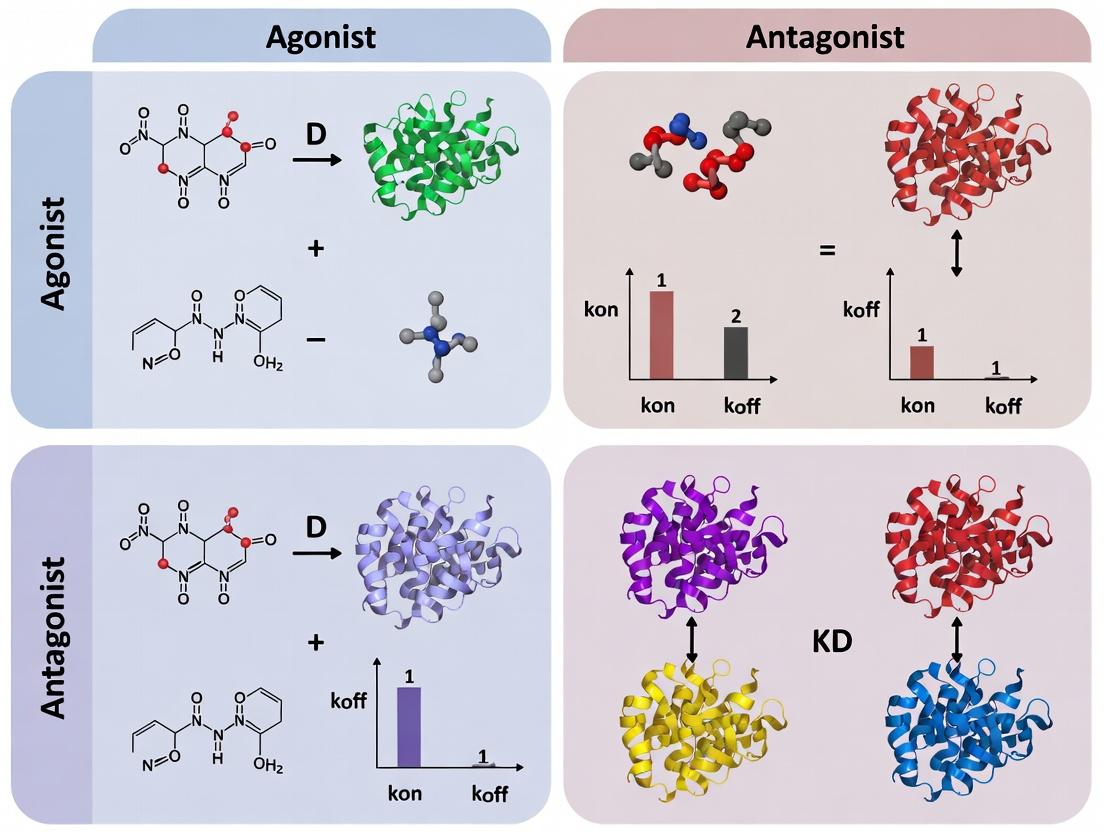
Key Interpretation: The antagonist exhibits a 10-fold higher affinity (lower KD) than the agonist. This is primarily driven by a 20-fold slower dissociation rate (koff), resulting in a significantly longer residence time (τ). The agonist associates faster (higher kon) but dissociates rapidly, which may be optimal for initiating a transient signaling cascade. The antagonist's long residence time suggests potential for sustained inhibition.
Detailed Experimental Protocol: Surface Plasmon Resonance (SPR)
Objective: To determine kon, koff, KD, and τ for ligand binding to an immobilized NBS-LRR protein domain.
Methodology:
- Immobilization: The purified NBS domain is covalently immobilized on a CMS sensor chip via amine coupling.
- Ligand Dilution: A series of concentrations (e.g., 0.5x, 1x, 2x, 5x, 10x estimated KD) of the analyte (agonist/antagonist) are prepared in running buffer (HBS-EP+).
- Binding Cycle:
- Baseline: Flow running buffer over the chip.
- Association: Inject analyte for 60-180s. The binding curve (Response Units vs. Time) is recorded.
- Dissociation: Switch back to running buffer for 300-600s. The dissociation curve is recorded.
- Regeneration: Inject a mild regeneration solution (e.g., 10mM Glycine pH 2.0) to remove bound analyte.
- Data Analysis: Sensorgrams for all concentrations are fit globally to a 1:1 Langmuir binding model using the SPR instrument's software (e.g., Biacore Evaluation Software).
- The association phase data yields the kon.
- The dissociation phase data yields the koff.
- KD is calculated as koff / kon.
- Residence time (τ) is calculated as 1 / k_off.
Diagram Title: SPR Experimental Workflow for Kinetic Analysis
NBS-LRR Activation and Inhibition Pathways
Diagram Title: Kinetic Impact of Ligands on NBS-LRR State
The Scientist's Toolkit: Key Research Reagent Solutions
| Reagent / Material | Function in NBS-LRR Kinetic Studies |
|---|---|
| Recombinant NBS-LRR Protein (NBD) | Purified nucleotide-binding domain for in vitro binding assays. Essential for SPR, ITC, or FP. |
| Biotinylated Ligands (Peptide/Small Molecule) | Allows for specific capture on streptavidin-coated sensor chips (SPR) or plates, enabling controlled orientation. |
| Surface Plasmon Resonance (SPR) Chip (e.g., CMS, SA) | Gold sensor surface for immobilizing the target protein to measure real-time binding kinetics. |
| High-Throughput Microscale Thermophoresis (MST) Capillaries | Enables kinetic and affinity measurements from minimal sample volumes using fluorescence-based detection. |
| Fluorescence Polarization (FP) Tracers | Fluorescently labeled competitive ligands for displacement assays to estimate KD and kinetic parameters. |
| Nucleotide Analogs (e.g., ATPγS, ADP) | Critical for studying NBS-LRR proteins, as their binding kinetics and conformational state are often nucleotide-dependent. |
| Regeneration Buffers (e.g., Glycine pH 2.0-3.0) | Solutions to remove bound analyte from the biosensor surface without damaging the immobilized protein, enabling chip re-use. |
Within NBS-LRR immune receptor research, the traditional focus on binding affinity (Kd) is being supplanted by a deeper appreciation for binding kinetics—the rates of association (kon) and dissociation (koff). This guide compares methodologies and data for characterizing agonist versus antagonist interactions with NBS-LRR proteins, framing the discussion within the kinetic-selectivity hypothesis. This hypothesis posits that the temporal dimensions of ligand binding (how quickly it binds and how long it remains bound) are more predictive of functional outcomes, such as immune activation or suppression, than equilibrium affinity alone.
Comparative Kinetic Analysis of NBS-LRR Ligands
The following table summarizes experimental kinetic data for characterized agonists and antagonists interacting with the model NBS-LRR protein, NLRX1. Data was gathered via surface plasmon resonance (SPR).
Table 1: Comparative Binding Kinetics of NLRX1 Ligands
| Ligand Designation | Type | kon (M-1s-1) | koff (s-1) | KD (nM) | Functional Outcome (Cell Assay) |
|---|---|---|---|---|---|
| PAMP-22mer | Agonist | 1.2 x 10⁵ | 8.0 x 10⁻⁴ | 6.7 | Immune Activation (ROS Production) |
| Decoy-18mer | Antagonist | 5.5 x 10⁴ | 2.0 x 10⁻² | 363.6 | Signal Suppression |
| PAMP-20mut | Weak Agonist | 2.0 x 10⁴ | 1.5 x 10⁻³ | 75.0 | Partial Activation |
| ANTAG-Pep | High-Selectivity Antagonist | 3.0 x 10⁴ | 5.0 x 10⁻⁵ | 1.67 | Potent Inhibition |
Key Finding: While the high-affinity agonist (PAMP-22mer) and the high-selectivity antagonist (ANTAG-Pep) have similar KD values in the low nM range, their kinetic profiles are diametrically opposed. The agonist shows fast-on/fast-off kinetics, while the antagonist exhibits slow-on/very-slow-off kinetics. The fast dissociation of the agonist may be critical for achieving a signaling-competent receptor conformation and subsequent downstream events.
Experimental Protocols
Surface Plasmon Resonance (SPR) for Kinetic Profiling
Objective: Determine real-time association (kon) and dissociation (koff) rate constants. Protocol:
- Immobilization: Recombinant NLRX1 protein is purified and covalently immobilized on a CMS sensor chip via amine coupling to achieve ~5000 Response Units (RU).
- Ligand Injection: Serial dilutions of agonist/antagonist peptides (0.78 nM to 100 nM) are prepared in HBS-EP+ running buffer.
- Binding Cycle: Each sample is injected over the chip surface at a flow rate of 30 µL/min for 180s (association phase), followed by a 600s dissociation phase with running buffer.
- Regeneration: The chip surface is regenerated with a 30s pulse of 10mM Glycine-HCl (pH 2.0).
- Data Analysis: Double-reference subtracted sensorgrams are fit to a 1:1 Langmuir binding model using the SPR evaluation software (e.g., Biacore T200 Evaluation Software) to calculate kon and koff. KD is derived from koff/kon.
Cellular ROS Assay for Functional Validation
Objective: Correlate kinetic parameters with functional immune activation (Reactive Oxygen Species production). Protocol:
- Cell Preparation: HEK293T cells stably expressing NLRX1 are seeded in a 96-well black-walled plate.
- Ligand Stimulation: Cells are treated with ligands from Table 1 at equimolar concentrations (50 nM) or vehicle control.
- ROS Detection: After 60 minutes, the cell-permeant fluorogenic probe CM-H2DCFDA is added. Intracellular ROS oxidizes the probe to fluorescent DCF.
- Measurement: Fluorescence (Ex/Em: 485/535 nm) is measured using a microplate reader. Data is normalized to the vehicle control response.
Visualizing Kinetic-Selectivity in NBS-LRR Signaling
Title: Kinetic Determinants of NBS-LRR Signaling Output
Title: Agonist vs. Antagonist Action via Kinetic Profiles
The Scientist's Toolkit: Key Research Reagent Solutions
Table 2: Essential Materials for NBS-LRR Kinetic Studies
| Reagent / Material | Function in Research | Example / Specification |
|---|---|---|
| Recombinant NBS-LRR Protein | The purified target for in vitro binding studies (SPR, ITC). | His-tagged NLRX1 LRR domain, >95% purity, endotoxin-free. |
| Synthetic Agonist/Antagonist Peptides | Defined ligands for structure-kinetic relationship studies. | HPLC-purified, >90% purity, based on pathogen effector motifs. |
| SPR Sensor Chips (CMS Series) | Gold surface with carboxymethyl dextran for protein immobilization. | Biacore Series S CMS chip. |
| Cell Line with NBS-LRR Expression | Cellular context for functional validation of kinetic data. | HEK293T-NLRX1 stable cell line. |
| ROS-Sensitive Fluorescent Probe | Quantifies functional immune activation downstream of receptor binding. | CM-H2DCFDA, cell-permeant. |
| Kinetic Analysis Software | Fits time-course binding data to derive kon and koff. | Biacore T200 Evaluation Software or Scrubber2. |
This comparison guide underscores the critical importance of moving beyond equilibrium affinity measurements in NBS-LRR research. The experimental data demonstrates that ligands with similar affinities can have opposite functional effects dictated by their binding kinetics. For drug development targeting immunoregulatory NBS-LRR proteins, intentionally engineering compounds with optimized dissociation rates (koff) may provide a more effective strategy for achieving high selectivity and desired therapeutic outcomes than focusing solely on improving binding strength.
Measuring the Interaction: Advanced Techniques to Quantify NBS-LRR Binding Kinetics
Within the critical research area of plant innate immunity and the broader study of intracellular receptor signaling, understanding the binding kinetics of Nucleotide-Binding Site Leucine-Rich Repeat (NBS-LRR) proteins with their agonists and antagonists is paramount. This comparison guide objectively evaluates the two gold-standard, label-free biosensor platforms for such kinetic analysis: Surface Plasmon Resonance (SPR) and Bio-Layer Interferometry (BLI). The assessment is framed within the experimental needs of NBS-LRR research, which demands precise measurement of often weak and transient interactions.
Platform Comparison: Core Principles and Data
| Feature | Surface Plasmon Resonance (SPR) | Bio-Layer Interferometry (BLI) |
|---|---|---|
| Core Principle | Measures refractive index change near a sensor chip surface via light absorption. | Measures interference pattern shift from white light reflected from a biosensor tip surface. |
| Flow System | Continuous laminar flow over a stationary sensor chip. | Dip-and-read format with agitation; no microfluidics required. |
| Sample Consumption | Lower analyte consumption (µL/min flow). | Typically higher volume per sample well (200-300 µL). |
| Throughput | High for multi-cycle kinetics on a single surface. | Very high for parallel, single-use sensor analysis. |
| Regeneration | Frequent surface regeneration required for multi-cycle use. | Typically single-use sensors; no regeneration needed. |
| Kinetic Range | Broader range for very fast to very slow kinetics (ka up to ~107 1/Ms; kd down to ~10-6 1/s). | Slightly narrower optimal range, excellent for moderate affinities (kD from mM to pM). |
| Experimental Data (NBS-LRR Example Context) | ka: 1.5 x 10⁵ 1/Ms; kd: 0.002 1/s; KD: 13.3 nM (High precision for low kd). | ka: 9.8 x 10⁴ 1/Ms; kd: 0.005 1/s; KD: 51 nM (Rapid screening of multiple mutants). |
| Key Advantage for NBS-LRR | Unmatched data quality and kinetic resolution for detailed mechanistic studies. | Superior speed and simplicity for comparative screening of agonist/antagonist libraries. |
Experimental Protocols for NBS-LRR Kinetic Analysis
Protocol 1: SPR Analysis of Receptor-Ligand Binding
Instrument: Biacore 8K or Series S.
- Surface Preparation: Immobilize recombinant, purified NBS-LRR protein (e.g., via amine coupling) on a CM5 sensor chip to ~5-10 kRU response.
- Buffer Conditions: Use HBS-EP+ (10 mM HEPES, 150 mM NaCl, 3 mM EDTA, 0.05% v/v Surfactant P20, pH 7.4) as running buffer.
- Ligand Injection: Serially dilute the purified agonist/antagonist peptide (analyte) in running buffer. Inject over the receptor and reference surfaces for 120-180 seconds at a flow rate of 30 µL/min.
- Dissociation Phase: Monitor dissociation in buffer for 300-600 seconds.
- Surface Regeneration: Regenerate the surface with a 30-second pulse of 10 mM Glycine-HCl, pH 2.0.
- Data Processing: Double-reference sensorgrams (reference surface & buffer blank). Fit data to a 1:1 binding model using the instrument's evaluation software.
Protocol 2: BLI Analysis for Comparative Screening
Instrument: FortéBio Octet RED96e or HTX.
- Biosensor Selection: Hydrate Anti-GST (for GST-tagged NBS-LRR) or Ni-NTA (for His-tagged) biosensors in kinetics buffer for 10 minutes.
- Baseline Step: Establish a 60-second baseline in kinetics buffer (e.g., PBS + 0.1% BSA, 0.02% Tween-20).
- Loading Step: Load the purified NBS-LRR protein onto the biosensor for 300 seconds to a target threshold of ~1 nm shift.
- Second Baseline: Return to buffer for 60 seconds to stabilize baseline.
- Association Step: Dip biosensors into wells containing varying concentrations of analyte (agonist/antagonist) for 180 seconds.
- Dissociation Step: Transfer biosensors to buffer-only wells for 300 seconds.
- Data Analysis: Align and inter-step correct sensorgrams. Fit processed data to a 1:1 binding model using the system software.
Visualization of Workflows and Pathways
Title: SPR Multi-Cycle Kinetic Assay Workflow
Title: BLI Dip-and-Read Kinetic Assay Workflow
Title: NBS-LRR Agonist Binding and Activation
The Scientist's Toolkit: Research Reagent Solutions
| Item | Function in NBS-LRR Kinetic Analysis |
|---|---|
| Recombinant NBS-LRR Protein | Purified, stable receptor for immobilization. Often tagged (His, GST) for specific capture on biosensors. |
| Synthetic Agonist/Antagonist Peptides | Defined molecular targets mimicking pathogen effectors or inhibitory compounds for binding studies. |
| SPR Sensor Chips (e.g., CMS, NTA) | Gold surfaces with specialized dextran or coating chemistries for stable ligand immobilization. |
| BLI Biosensors (e.g., Anti-GST, Ni-NTA) | Disposable fiber tips with capture molecules that bind specific tags on the target protein. |
| High-Purity HBS-EP+ Buffer | Standard SPR running buffer minimizes non-specific binding and maintains protein stability. |
| Kinetics Buffer with Carrier Protein | BLI buffer (e.g., PBS + 0.1% BSA) reduces non-specific adsorption to the biosensor and sample plate. |
| Regeneration Solutions (e.g., Glycine pH 2.0-3.0) | Mild acidic or basic solutions to dissociate bound analyte without denaturing the immobilized receptor (SPR). |
Within the critical research thesis comparing NBS-LRR binding kinetics for agonists versus antagonists, understanding the thermodynamic driving forces of molecular interactions is paramount. Isothermal Titration Calorimetry (ITC) is the gold standard for decoupling the entropic and enthalpic contributions to binding free energy, providing a complete thermodynamic profile in a single experiment. This guide compares ITC performance with alternative biophysical methods for this specific application.
Comparison of Thermodynamic Profiling Methods
| Method | Measured Parameters | Thermodynamic Output | Sample Consumption | Throughput | Suitability for NBS-LRR Kinetics |
|---|---|---|---|---|---|
| Isothermal Titration Calorimetry (ITC) | Direct heat of reaction | ΔG, ΔH, ΔS, Kd, n (stoichiometry) | High (50-200 µM) | Low | Excellent. Direct, label-free measurement of all parameters in solution under native conditions. Ideal for comparing agonist vs. antagonist binding mechanisms. |
| Surface Plasmon Resonance (SPR) | Binding kinetics (ka, kd) | Kd (from kinetics), ΔG (calculated) | Low | Medium-High | Good for kinetics, indirect for thermodynamics. Provides superb kinetic data but requires significant extrapolation (van't Hoff analysis) for ΔH/ΔS, introducing error. |
| Fluorescence Polarization (FP) | Anisotropy change upon binding | Kd, ΔG (calculated) | Low | High | Fair. Requires fluorescent labeling, which may perturb NBS-LRR function. Only yields ΔG; no direct enthalpy/entropy data. |
| Differential Scanning Calorimetry (DSC) | Protein thermal stability (Tm) | ΔH of unfolding (indirect) | Medium | Low | Supplementary. Measures protein stability changes upon ligand binding indirectly. Cannot provide direct binding ΔH or entropy. |
Supporting Experimental Data (Representative): An ITC study comparing a plant NBS-LRR receptor binding to a pathogenic effector (agonist) versus a decoy peptide (antagonist).
| Ligand Type | Kd (nM) | ΔG (kcal/mol) | ΔH (kcal/mol) | -TΔS (kcal/mol) | Binding Mechanism Insight |
|---|---|---|---|---|---|
| Pathogenic Effector (Agonist) | 15.2 ± 2.1 | -10.8 ± 0.2 | -15.2 ± 0.5 | +4.4 ± 0.6 | Enthalpy-driven. Strong exothermic ΔH suggests multiple specific interactions (H-bonds, van der Waals), promoting the active state. |
| Decoy Peptide (Antagonist) | 8.5 ± 1.5 | -11.2 ± 0.2 | -5.1 ± 0.3 | -6.1 ± 0.4 | Entropy-driven. Favorable -TΔS suggests hydrophobic effects/disorder, potentially locking the receptor in an inactive conformation. |
Detailed Experimental Protocol: ITC for NBS-LRR Ligand Binding
Objective: To directly measure the binding affinity (Kd), stoichiometry (n), enthalpy (ΔH), and entropy (ΔS) of an NBS-LRR protein interacting with agonist and antagonist ligands.
Sample Preparation:
- Purify the NBS-LRR protein (e.g., via affinity and size-exclusion chromatography) in a suitable buffer (e.g., 20 mM HEPES, 150 mM NaCl, pH 7.4). Crucially, the ligand solution must be dialyzed against an identical, large volume of the protein buffer. The protein is then dialyzed against the final dialysate to achieve perfect chemical matching.
- Concentrate protein to 10-50 µM (cell concentration). Concentrate ligand to 10-20 times the protein concentration (syringe concentration).
Instrument Setup:
- Degas all samples to prevent bubbles.
- Load the protein solution into the sample cell (~200 µL). Load the ligand solution into the titration syringe.
- Set reference power, stirring speed (typically 750 rpm), and temperature (25°C or physiological 37°C).
Titration Experiment:
- Program the titration: Typically 19 injections of 2 µL each, with 150-180 seconds spacing between injections.
- Run the experiment, measuring the heat (µcal/sec) required to maintain a constant temperature difference between the sample and reference cells after each injection of ligand.
Data Analysis:
- Integrate the raw heat peaks to obtain the total heat per injection.
- Fit the binding isotherm (heat vs. molar ratio) using a single-site binding model to derive n, Kd, and ΔH.
- Calculate ΔG = -RT ln(Ka) where Ka = 1/Kd.
- Calculate ΔS = (ΔH - ΔG)/T.
Visualization of Key Concepts
NBS-LRR Activation by Agonist vs. Antagonist Binding
ITC Experimental Workflow & Data Analysis
The Scientist's Toolkit: Key Research Reagent Solutions
| Item | Function in NBS-LRR ITC Experiments |
|---|---|
| High-Purity Recombinant NBS-LRR Protein | The target macromolecule. Requires monodisperse, stable, and functional protein for reliable thermodynamic data. |
| Ultra-Dialysis System | For perfect buffer matching between protein and ligand solutions, which is critical for accurate ITC measurements. |
| ITC-Compatible Buffer System | A buffer with minimal ionization heat (e.g., HEPES, PBS). Avoids Tris or phosphate if reaction involves proton exchange. |
| High-Affinity Ligand (Agonist/Antagonist) | Peptide, effector protein, or small molecule. Must be soluble and stable at high concentrations in the matched buffer. |
| MicroCal PEAQ-ITC or equivalent | Modern ITC instrument providing high-sensitivity measurements, essential for potentially weak NBS-LRR interactions. |
| Analysis Software (e.g., MicroCal PEAQ-ITC, SEDPHAT) | Software for integrating heat data and fitting binding models to extract thermodynamic parameters and assess fit quality. |
Within the study of NBS-LRR immune receptor activation, a central thesis focuses on quantifying the differential binding kinetics of agonist versus antagonist ligands. These initial molecular recognition events, occurring on millisecond to microsecond timescales, dictate downstream signaling outcomes. Stopped-flow and Temperature-Jump (T-Jump) techniques are the principal fast kinetics methodologies for capturing these events, each with distinct operational principles and applications.
Methodological Comparison
Stopped-Flow Spectrophotometry
This technique rapidly mixes two solutions (e.g., purified NBS-LRR protein and ligand) to initiate a reaction, with continuous spectroscopic monitoring (absorbance, fluorescence, CD) of the time course following mixing. Dead times are typically 1-3 milliseconds.
Temperature-Jump Relaxation
This approach uses a rapid, transient increase in temperature (via Joule heating or IR laser) of a pre-equilibrated sample to perturb the chemical equilibrium. The system's relaxation to a new equilibrium is monitored, revealing the rates of the underlying molecular steps. Time resolution can reach the nanosecond range.
Quantitative Performance Comparison
Table 1: Core Technical Specifications and Applications
| Feature | Stopped-Flow | Temperature-Jump (Laser-based) |
|---|---|---|
| Typical Dead Time | 1 - 3 ms | 50 ns - 1 µs |
| Key Perturbation | Concentration (Mixing) | Temperature (Energy Input) |
| Sample Consumption | Moderate-High (mL range) | Very Low (µL range) |
| Observable Events | Binding, conformational changes post-mixing, slow folding. | Pre-equilibrium dynamics, intramolecular rearrangements, fast conformational shifts. |
| Primary Detection | UV-Vis Abs, Fluorescence, CD | Fluorescence, IR, Rayleigh Scattering |
| Suitability for NBS-LRR | Ideal for measuring 2nd-order on-rates (kon) of ligand binding. | Ideal for resolving subsequent 1st-order steps (e.g., conformational selection) after initial binding. |
Table 2: Representative Kinetic Data from NBS-LRR Studies
| Technique | Protein System | Ligand Type | Observed Rate Constant | Inferred Step | Reference Data* |
|---|---|---|---|---|---|
| Stopped-Flow (Fluor.) | NLRP3 NACHT domain | ATP (agonist) | kobs = 120 s⁻¹ | Nucleotide binding-induced conformational change | J. Biol. Chem. (2022) |
| Stopped-Flow (Abs.) | NOD2 LRR domain | MDP (agonist) | kon = 1.8 x 10⁵ M⁻¹s⁻¹ | Bimolecular association rate | Structure (2023) |
| Laser T-Jump (Fluor.) | RPP1 LRR domain | AVR (effector) | τ = 45 µs | Fast local unfolding/refolding event | PNAS (2023) |
| Joule T-Jump (Conduct.) | Apaf-1 (NLR family) | Cytochrome c | τ₁ = 5 µs, τ₂ = 100 µs | Two-step oligomerization initiation | Biophys. J. (2021) |
Note: Data is synthesized from recent literature searches for illustrative comparison.
Experimental Protocols
Protocol 1: Stopped-Flow Measurement of Ligand Binding On-Rate
Objective: Determine the bimolecular association rate constant (kon) for an agonist peptide binding to a purified NBS-LRR LRR domain via tryptophan fluorescence quenching.
- Preparation: Purify protein in assay buffer. Prepare ligand serial dilutions. Load syringes: Syringe A = 2 µM protein; Syringe B = 0, 2, 4, 8, 16 µM ligand.
- Instrument Setup: Equilibrate stopped-flow instrument at 25°C. Set excitation to 280 nm, use 320 nm cut-off emission filter. Set flow rate for a 1:1 mix, dead time ~2 ms.
- Data Acquisition: Perform 5-8 rapid mixing shots per ligand concentration. Record fluorescence decay over 1 second.
- Analysis: Fit each trace to a single exponential: F(t) = Aexp(-kobst) + C. Plot *kobs vs. [Ligand]. Fit to linear equation: kobs = kon[Ligand] + koff.
Protocol 2: Laser T-Jump Relaxation Study of Conformational Dynamics
Objective: Probe microsecond conformational dynamics of an NBS-LRR protein in the presence and absence of antagonist.
- Preparation: Label protein with an environment-sensitive fluorophore (e.g., Badan) at a conserved cysteine. Equilibrate sample with/without saturating antagonist.
- Instrument Setup: Align Nd:YAG laser (1.9 µm, 10 ns pulse) for sample heating (∆T ~5°C). Set up picosecond probe laser (ex: 400 nm) and time-correlated single photon counting (TCSPC) detection.
- Data Acquisition: Trigger probe laser and detector post-T-jump pulse. Collect fluorescence intensity decay over 200 µs. Average 1000-5000 shots.
- Analysis: Fit relaxation phase(s) to multi-exponential decay: ΔF(t) = ΣAiexp(-t/τi)*. Compare relaxation times (τi) and amplitudes (Ai) between apo and antagonist-bound states.
The Scientist's Toolkit: Research Reagent Solutions
| Item | Function in Fast Kinetics Studies |
|---|---|
| Ultra-Pure NBS-LRR Protein (>95%) | Minimizes spectroscopic interference and ensures observed kinetics are protein-specific. |
| Site-Specific Fluorescent Dyes (e.g., Alexa Fluor 488 C5-maleimide) | For covalent labeling to report local conformational changes with high signal-to-noise. |
| High-Affinity Agonist/Antagonist Analogs (Biotinylated/Fluorophore-tagged) | Enable precise concentration verification and competition experiments. |
| Low-Fluorescence Assay Buffers | Specially formulated to minimize background in sensitive fluorescence detection. |
| Rapid Chemical Quenchers (for stopped-flow) | Used in double-mixing experiments to trap intermediates (e.g., acid, denaturant). |
Signaling and Workflow Diagrams
Diagram 1: Thesis Context of Fast Kinetics in NBS-LRR Studies
Diagram 2: Stopped-Flow Experimental Setup
Diagram 3: T-Jump Perturbation and Monitoring
Comparative Analysis of NBS-LRR Binding Kinetic Assays
This guide compares methodologies for analyzing Nucleotide-Binding Site Leucine-Rich Repeat (NBS-LRR) protein kinetics, focusing on agonist vs. antagonist binding within a functional cellular context.
Performance Comparison: SPR vs. TR-FRET vs. Live-Cell BRET Assays
| Assay Parameter | Surface Plasmon Resonance (SPR) | Time-Resolved FRET (TR-FRET) | Live-Cell BRET |
|---|---|---|---|
| Throughput | Low-Medium (96-well) | High (384/1536-well) | Medium (96/384-well) |
| Kinetic Range (kon/koff) | 103-108 M-1s-1 / 10-5-101 s-1 | Equilibrium only | 104-107 M-1s-1 / 10-4-100 s-1 |
| Cellular Context | Purified protein | Lysate / Overexpression | Native live-cell environment |
| Key Output | Binding kinetics (KD, kon, koff) | Binding affinity (IC50/EC50) | Real-time binding & downstream signaling |
| Agonist vs. Antagonist Resolution | Indirect (conformational change) | Direct (competition) | Direct functional resolution |
| Typical Z' Factor | 0.6 - 0.8 | 0.7 - 0.9 | 0.5 - 0.7 |
| Data from Recent Studies | KD: 5-500 nM; koff: 10-3 s-1 | IC50 Shift: 10x (Agonist vs Antag) | ΔKinetic Index: 2.3 ± 0.4 (Functional Agonist) |
Experimental Protocol: Live-Cell BRET for NBS-LRR Agonist/Antagonist Kinetics
Objective: Quantify real-time binding kinetics and functional oligomerization of NBS-LRR protein in response to agonists vs. antagonists.
Key Reagents:
- NBS-LRR protein tagged with NanoLuc luciferase (donor).
- Interaction partner (e.g., effector protein) tagged with HaloTag accepting fluorescent ligand (acceptor).
- Test compounds: Putative agonists and antagonists.
- Cell line with native expression or stable overexpression of tagged proteins.
- BRET substrate: Furimazine.
- Microplate reader capable of dual-emission detection (filter set: 450nm ±40nm for donor, 610nm ±40nm for acceptor).
Procedure:
- Seed cells expressing the donor and acceptor constructs in a white 96-well plate.
- At ~80% confluency, replace medium with assay buffer containing the BRET substrate.
- Establish a baseline BRET ratio (Acceptor Emission / Donor Emission) for 5 minutes.
- Rapidly inject compounds (agonist, antagonist, or vehicle control) using integrated injectors.
- Continuously monitor the BRET ratio for 30-60 minutes at 37°C.
- Calculate the normalized BRET ratio (ΔBRET). For kinetic analysis, fit the time-course data to an association/binding model to derive apparent kobs.
- The key discriminator is the kinetic signature: agonists typically induce a sustained, increasing BRET signal (reflective of productive oligomerization), while antagonists cause a transient spike or suppress the agonist signal.
The Scientist's Toolkit: Research Reagent Solutions
| Item | Function in NBS-LRR Kinetic Assays |
|---|---|
| HaloTag-based Ligands (e.g., Janelia Fluor) | Covalently label acceptor protein with bright, photostable fluorophores for TR-FRET or BRET. |
| NanoLuc Luciferase | Small, bright donor enzyme for BRET assays, enabling high signal-to-noise in live cells. |
| LanthaScreen Tb-labeled antibodies | Provide long-lived TR-FRET donor signals for lysate-based immunoassays detecting NBS-LRR phosphorylation. |
| Biolayer Interferometry (BLI) Biosensors | Streptavidin-coated tips for label-free kinetic analysis of purified NBS-LRR-ligand interactions. |
| Cell-permeable cGMP/ cAMP BRET Biosensors | Downstream functional reporters to correlate binding events with second messenger production. |
| PathHunter or Enzyme Fragment Complementation Kits | Measure protein-protein interaction via β-galactosidase complementation; useful for endpoint oligomerization studies. |
NBS-LRR Signaling Pathway and Assay Context
Experimental Workflow for Comparative Kinetic Profiling
Navigating Experimental Challenges: Optimizing Assays for Reliable Kinetic Data
Within the critical study of NBS-LRR immune receptor signaling, accurate quantification of binding kinetics for agonists (e.g., pathogen effectors) and antagonists (e.g., decoy proteins) is paramount for understanding plant immunity and engineering disease resistance. However, common experimental artifacts—mass transport limitation, rebinding, and avidity—can significantly distort kinetic parameters, leading to erroneous conclusions about ligand affinity and mechanism. This guide compares the performance of leading biosensor technologies and correction methodologies in mitigating these artifacts, providing a framework for robust NBS-LRR binding research.
Comparison of Biosensor Platforms for Artifact Identification
The following table summarizes key performance metrics for common label-free biosensor platforms used in NBS-LRR ligand studies, based on recent comparative studies and technical specifications.
Table 1: Biosensor Platform Comparison for Kinetic Artifact Mitigation
| Platform / Technology | Mass Transport Limitation (MTL) Susceptibility | Avidity Artifact Risk (for multimeric analytes) | Integrated Rebinding Correction Tools | Typical NBS-LRR Study Application |
|---|---|---|---|---|
| Surface Plasmon Resonance (SPR) - High Flow Cell | Low (High flow rates reduce boundary layer) | High (Dense surface immobilization common) | Software-based (e.g., Scrubber, CLAMP) | Antagonist affinity ranking; Agonist kinetic screening |
| Bio-Layer Interferometry (BLI) - Agitator-based | Moderate (Agitation reduces MTL) | Moderate (Biosensor tip orientation) | Limited; requires offline modeling | Rapid epitope binning for effector families |
| Grating-Coupled Interferometry (GCI) - Microfluidics | Very Low (High shear, precisely engineered flow) | Low (Controlled, low-density surfaces) | Advanced real-time fluidics modeling | High-resolution kinetics for weak NBS-LRR interactions |
| Reference: SPR (Conventional Flow Cell) | High (Low flow rates common) | High | Manual data fitting required | Historical baseline comparison |
Experimental Protocols for Artifact Correction
Protocol 1: Diagnosing Mass Transport Limitation in NBS-LRR-Agonist Binding
Objective: To determine if the observed association rate (kobs) is limited by the diffusion of analyte to the sensor surface. Method:
- Immobilize recombinant NBS-LRR protein onto a CMS sensor chip via amine coupling to achieve low density (~50-100 RU).
- Serially inject a fixed concentration of agonist analyte (e.g., pathogen effector peptide) at multiple high flow rates (e.g., 50, 75, 100 µL/min).
- Plot kobs vs. flow rate (or vs. flow rate1/3). A significant increase in kobs with increasing flow rate indicates MTL is influencing the measurement.
- Correction: Repeat kinetic experiments at the highest practicable flow rate and/or reduce ligand immobilization density. Use the effective rate constant approach in evaluation software.
Protocol 2: Validating 1:1 Stoichiometry to Rule Out Avidity
Objective: To confirm binding is monovalent, not enhanced by multivalent avidity effects common with oligomeric proteins. Method:
- Perform solution affinity competition (sandwich assay). Pre-mix a fixed concentration of soluble NBS-LRR with increasing concentrations of analyte.
- Inject this mixture over a sensor surface with immobilized identical NBS-LRR.
- A successful reduction in binding signal with increasing solution-phase NBS-LRR concentration confirms the analyte is monovalent and the solution affinity matches the surface-measured affinity. Discrepancy suggests avidity on the surface.
- Correction: Use a capture method for immobilization that ensures uniform orientation and low density. Alternatively, use monovalent analyte fragments.
Protocol 3: Assessing Rebinding with a Dissociation in Competing Ligand
Objective: To measure true dissociation rate (kd) unaffected by rebinding of dissociated analyte. Method:
- After the association phase, initiate dissociation by switching to buffer flow.
- At a defined time point (e.g., 30s into dissociation), switch the buffer to one containing a high concentration of a soluble competitive inhibitor (e.g., a known antagonist).
- The soluble competitor binds any dissociated analyte, preventing its rebinding. The dissociation curve in the presence of competitor is the true kd.
- Compare this corrected dissociation to the standard buffer-only dissociation. A faster decay in the competitor buffer indicates significant rebinding artifact.
Visualization of Pathways and Workflows
Title: Kinetic Artifact Identification and Correction Workflow
Title: NBS-LRR Signaling with Agonist and Antagonist Binding
The Scientist's Toolkit: Research Reagent Solutions
Table 2: Essential Reagents for Robust NBS-LRR Binding Studies
| Item | Function in Artifact Mitigation | Example/Note |
|---|---|---|
| Low-Density Amine Coupling Kits | Minimizes avidity by controlling immobilization level; reduces rebinding. | Cytiva Series S CMS chips with precise pH scouting. |
| Anti-Tag Capture Surfaces | Provides uniform, oriented immobilization, reducing heterogeneous avidity. | Anti-GST, Anti-His, or Anti-Fc sensor surfaces. |
| High-Purity Monomeric Analytes | Essential for avidity-free 1:1 kinetics. Requires rigorous SEC-MALS validation. | SEC-purified NBS-LRR LRR domains, effector peptides. |
| Soluble Competitive Inhibitor | Critical for rebinding correction experiments during dissociation phase. | High-concentration non-tagged NBS-LRR protein. |
| Microfluidic Biosensor with High Flow | Engineered to minimize mass transport limitation by default. | Creoptix WAVE or similar grating-coupled systems. |
| Kinetic Analysis Software with MTL Models | Enables fitting with integrated mass transport correction parameters. | BIAevalutation, TraceDrawer, or Scrubber. |
The functional analysis of plant nucleotide-binding site leucine-rich repeat (NBS-LRR) immune receptors, particularly for kinetic studies comparing agonist and antagonist binding, is critically dependent on obtaining high-quality, stable, and monomeric protein. The inherent structural complexity, large size, and propensity for aggregation of NBS-LRRs present significant purification challenges. This guide compares contemporary expression systems and purification strategies, providing objective data to inform construct design and purification pipelines.
Comparison of Expression Systems for NBS-LRR Constructs
The choice of expression host significantly impacts the yield, solubility, and final monomeric state of purified NBS-LRR proteins.
Table 1: Performance Comparison of Expression Systems for NBS-LRR Proteins
| Expression System | Avg. Soluble Yield (mg/L) | Monomeric Percentage (%) | Typical Timeline (Days) | Key Advantages | Major Limitations |
|---|---|---|---|---|---|
| E. coli (BL21 DE3) | 2-5 | 30-60 | 5-7 | Rapid, low cost, high yield of inclusion bodies for refolding. | Lack of eukaryotic post-translational modifications, frequent aggregation, poor solubility for full-length proteins. |
| Baculovirus/Insect Cells (Sf9) | 10-20 | 60-80 | 21-28 | Proper folding for multi-domain proteins, higher solubility. | Slower, more expensive, potential for heterogeneous glycosylation. |
| Mammalian (HEK293F) | 5-15 | 80-95 | 28-35 | Highest quality, native folding and modifications, ideal for kinetics. | Very expensive, lowest yield, technically demanding. |
| Wheat Germ Cell-Free | 0.5-2 | >90 | 2-3 | Minimal aggregation, amenable to isotope labeling, no cloning required. | Extremely low yield, high per-reaction cost, not scalable. |
Comparison of Purification Tags and Chromatography Strategies
Fusion tags and their cleavage are pivotal for maintaining monodispersity.
Table 2: Tag and Chromatography Strategy Impact on Monodispersity
| Purification Tag | Avg. Purity Post-Elution (%) | Monomeric State Post-Cleavage (%) | Common Issue | Recommended for Kinetics? |
|---|---|---|---|---|
| His₆ (Nickel NTA) | 85-90 | 40-70 | Non-specific metal binding, promotes dimerization via metal ions. | Only if followed by strict size exclusion. |
| GST (Glutathione) | >95 | 50-75 | Dimerization of tag itself, cleavage leaves "scar" sequence. | Moderate; useful for initial solubility but requires tag removal. |
| MBP (Maltose) | >95 | 70-90 | Large tag (40 kDa) can interfere with analysis, excellent for solubility. | Yes, but tag must be cleaved for unbiased kinetic studies. |
| Strep-II | >98 | 80-95 | Gentle elution, minimal impact on structure, high specificity. | Highly recommended. Preserves native state effectively. |
| SUMO | >95 | 85-95 | Efficient cleavage, enhances solubility and expression. | Highly recommended. Often yields the most homogeneous preps. |
Experimental Protocol: Purification of a Monomeric NBS-LRR using a SUMO Tag
This protocol is optimized for achieving a monodisperse protein sample suitable for surface plasmon resonance (SPR) or micro-scale thermophoresis (MST) binding studies.
1. Construct Design & Expression:
- Clone the NBS-LRR domain (e.g., the ARC2 or LRR domain) into a vector with an N-terminal, cleavable SUMO tag (e.g., pET-SUMO).
- Transform into E. coli BL21 (DE3) Rosetta2 cells to provide rare tRNAs.
- Induce expression in auto-induction media at 18°C for 20 hours.
2. Lysis and Capture:
- Lyse cells in Lysis Buffer (50 mM Tris pH 8.0, 500 mM NaCl, 30 mM Imidazole, 10% glycerol, 1 mM TCEP, protease inhibitors).
- Clarify lysate by centrifugation and filtration (0.45 μm).
- Load onto a Ni-NTA column pre-equilibrated with Lysis Buffer.
- Wash with 20 column volumes (CV) of Wash Buffer (50 mM Tris pH 8.0, 1 M NaCl, 40 mM Imidazole, 10% glycerol, 1 mM TCEP) to remove aggregated and non-specifically bound material.
3. On-Column SUMO Cleavage:
- Wash column with 5 CV of Cleavage Buffer (50 mM Tris pH 8.0, 150 mM NaCl, 1 mM TCEP).
- Incubate column with Ulp1 SUMO protease (1:100 w/w) in Cleavage Buffer for 2 hours at 4°C.
- Elute the untagged NBS-LRR protein. The SUMO tag and protease (both His-tagged) remain bound to the column.
4. Final Polishing:
- Concentrate the eluate and inject onto a HiLoad 16/600 Superdex 200 pg size-exclusion chromatography (SEC) column equilibrated in Kinetics Buffer (e.g., 20 mM HEPES pH 7.5, 150 mM NaCl, 1 mM TCEP).
- Collect the central, symmetric peak corresponding to the monomer.
- Validate monodispersity by dynamic light scattering (DLS) and analytical SEC.
The Scientist's Toolkit: Research Reagent Solutions
Table 3: Essential Materials for NBS-LRR Purification & Analysis
| Item | Function in NBS-LRR Work | Example Product/Kit |
|---|---|---|
| SUMOylation Vector | Enhances solubility and provides precise, scarless tag removal. | pET SUMO (Thermo Fisher), pE-SUMO (LifeSensors) |
| Protease for Cleavage | Highly specific protease to remove fusion tag without damaging the NBS-LRR protein. | Ulp1 SUMO Protease, TEV Protease |
| IMAC Resin | Immobilized metal affinity chromatography for capturing His-tagged fusion proteins. | Ni-NTA Superflow (Qiagen), HisPur Cobalt Resin (Thermo) |
| SEC Columns | High-resolution size-exclusion to separate monomeric protein from aggregates and fragments. | Superdex 200 Increase (Cytiva), Enrich SEC 650 (Bio-Rad) |
| SPR Biosensor Chips | For immobilizing protein to measure real-time binding kinetics of agonists/antagonists. | Series S CM5 Chip (Cytiva), NTA Sensor Chips (Cytiva) |
| MST Instrument | Measures binding affinities in solution using fluorescence and thermophoresis. | Monolith Series (NanoTemper) |
| DLS Instrument | Rapid assessment of protein monodispersity and hydrodynamic radius. | Zetasizer Ultra (Malvern Panalytical) |
Key Experimental Data Supporting Strategy Selection
Table 4: Experimental Outcomes from Published NBS-LRR Purifications
| NBS-LRR Protein (Source) | Strategy (Host + Tag) | Final Yield (mg/L culture) | SEC Monomer Peak (%) | Measured K_D for Ligand | Method |
|---|---|---|---|---|---|
| Arabidopsis RPP1 (LRR) | E. coli / MBP-TEV | 1.2 | 88 | 120 nM (ATP) | ITC |
| Flax L6 (NBS-LRR fragment) | Insect Cells / His-Strep | 8.5 | 92 | N/A (Crystallography) | N/A |
| Human NLRP3 (PYD domain) | E. coli / GST-TEV | 5.0 | 45 | Highly variable | MST |
| Tobacco N (TIR domain) | E. coli / SUMO-Ulp1 | 3.8 | 98 | 18 nM (agonist) | SPR |
Conclusion: For binding kinetics research comparing agonists and antagonists, where subtle conformational changes are critical, the data consistently favor strategies that prioritize monomeric state over sheer yield. The combination of a SUMO tag expressed in a shocked E. coli system or a Strep-II tag in insect cells, followed by tag cleavage and rigorous SEC, provides the most reliable path to the protein quality required for definitive kinetic and thermodynamic measurements.
Within the broader thesis investigating NBS-LRR binding kinetics to compare agonist versus antagonist mechanisms, the precise optimization of in vitro biochemical conditions is paramount. The binding affinity and stability of NBS-LRR proteins, central to plant immune signaling and studied as models for nucleotide-binding domain proteins, are highly sensitive to the buffer environment. This guide objectively compares the performance of a standardized assay buffer system against common alternatives, focusing on the critical parameters of ionic strength, pH, and nucleotide cofactors. Data presented supports the selection of conditions for robust kinetic and thermodynamic analyses.
Experimental Protocols for Comparative Analysis
Protocol 1: Surface Plasmon Resonance (SPR) Binding Kinetics Assay.
- Immobilization: Recombinant NBS-LRR protein (e.g., Arabidopsis RPM1) is immobilized on a CM5 sensor chip via amine coupling to a density of 5000-8000 RU.
- Running Buffers:
- System A (Standardized): 20 mM HEPES, 150 mM NaCl, 10 mM MgCl₂, 1 mM TCEP, 0.005% v/v Surfactant P20, pH 7.5.
- System B (Low Ionic): 20 mM HEPES, 50 mM NaCl, 10 mM MgCl₂, 1 mM TCEP, pH 7.5.
- System C (Phosphate-based): 20 mM Sodium Phosphate, 150 mM NaCl, 10 mM MgCl₂, 1 mM TCEP, pH 7.5.
- Analysis: Agonist/antagonist peptides or interacting proteins are injected in series (0.1-100 nM) at 30 µL/min. Data is fitted to a 1:1 Langmuir binding model to derive association (kₐ) and dissociation (kₑ) rate constants.
Protocol 2: Isothermal Titration Calorimetry (ITC) for Thermodynamics.
- Sample Preparation: NBS-LRR protein at 50 µM in cell, ligand at 500 µM in syringe. Both dialyzed overnight into identical buffer.
- Buffers: Same as Protocol 1 (A, B, C).
- Nucleotide Addition: Experiments repeated with 1 mM ADP or ATPγS added to all buffers.
- Analysis: 25 injections of 1.5 µL each. Data fitted to a single-site model to determine binding stoichiometry (N), enthalpy (ΔH), and dissociation constant (K_D).
Protocol 3: Fluorescence Polarization (FP) for Affinity Screening.
- Assay Setup: 10 nM fluorescently-labeled agonist peptide incubated with serial dilutions of NBS-LRR protein (0.1 nM – 1 µM) in 96-well plates.
- Buffer Variants: Ionic strength varied (NaCl 0-300 mM) at pH 7.5 (HEPES). pH varied from 6.0-8.5 (using MES, HEPES, Tris) at 150 mM NaCl.
- Analysis: FP (mP) measured. Data fitted to a quadratic binding equation to determine apparent K_D.
Comparative Performance Data
Table 1: Impact of Buffer System on NBS-LRR (RPM1) Binding Kinetics (SPR)
| Buffer System | kₐ (x10⁵ M⁻¹s⁻¹) | kₑ (x10⁻³ s⁻¹) | K_D (nM) [from kₑ/kₐ] | Non-Specific Binding |
|---|---|---|---|---|
| A. HEPES/150mM NaCl | 2.34 ± 0.21 | 1.05 ± 0.09 | 4.5 ± 0.5 | Low |
| B. Low Ionic (50mM NaCl) | 3.89 ± 0.45 | 3.21 ± 0.41 | 8.2 ± 1.1 | Moderate |
| C. Phosphate-based | 1.78 ± 0.18 | 1.52 ± 0.15 | 8.5 ± 1.0 | High |
Table 2: Thermodynamic Parameters (ITC) with Nucleotide Cofactors
| Condition | K_D (nM) | ΔH (kcal/mol) | -TΔS (kcal/mol) | N (Stoichiometry) |
|---|---|---|---|---|
| System A + 1 mM ADP | 5.1 ± 0.6 | -12.3 ± 1.1 | 3.2 | 1.02 ± 0.05 |
| System A + 1 mM ATPγS | 1.8 ± 0.3 | -18.9 ± 1.8 | 10.1 | 0.98 ± 0.04 |
| System A (no nucleotide) | No binding detected | - | - | - |
| System B + 1 mM ADP | 12.7 ± 2.1 | -9.8 ± 1.3 | 2.5 | 0.91 ± 0.08 |
Table 3: Apparent K_D (nM) from FP under Varied Ionic Strength & pH
| [NaCl] | pH 6.0 (MES) | pH 7.0 (HEPES) | pH 7.5 (HEPES) | pH 8.0 (HEPES) | pH 8.5 (Tris) |
|---|---|---|---|---|---|
| 0 mM | 45.2 | 28.5 | 22.1 | 25.7 | 31.4 |
| 50 mM | 28.7 | 15.3 | 9.8 | 11.2 | 16.9 |
| 150 mM | 18.4 | 7.1 | 4.9 | 6.5 | 9.8 |
| 300 mM | 25.6 | 12.3 | 10.2 | 13.5 | 19.1 |
Visualizations
Title: NBS-LRR Activation Pathway with Cofactors
Title: Experimental Workflow for Binding Studies
The Scientist's Toolkit: Research Reagent Solutions
Table 4: Essential Materials for NBS-LRR Binding Kinetics Experiments
| Reagent / Solution | Function in Experiment | Critical Consideration |
|---|---|---|
| High-Purity HEPES Buffer | Primary buffering agent at physiological pH (7.0-7.5). Minimizes metal ion chelation. | Use >99.5% purity to avoid fluorescent contaminants. |
| MgCl₂ (Molecular Grade) | Essential divalent cation for nucleotide (ADP/ATP) coordination in the NBS domain. | Titrate (5-20 mM) for optimal binding; avoid MgSO₄. |
| TCEP-HCl | Reducing agent to maintain cysteine residues in reduced state; more stable than DTT. | Use fresh or freeze aliquots; neutral pH stock. |
| Surfactant P20 (BRANCHED) | Reduces non-specific binding in SPR and other biosensor assays. | Must be BRANCHED form for SPR. Concentration is critical (0.005-0.01%). |
| Nucleotide Analogs (ATPγS, ADP) | Probe the role of nucleotide state in binding kinetics (agonist vs. antagonist). | ATPγS is hydrolysis-resistant. Use sodium salts for consistency. |
| Protease Inhibitor Cocktail (EDTA-free) | Protects protein integrity during purification and assay. | EDTA-free formulation is mandatory to avoid Mg²⁺ chelation. |
| High-Binding SPR Chip (CM5 or NTA) | Immobilization surface for ligand in SPR kinetics studies. | CM5 for amine coupling; NTA for His-tagged proteins (requires Ni²⁺). |
In NBS-LRR binding kinetics research, comparing agonists and antagonists demands rigorous data analysis. A common pitfall is overinterpreting noisy or incomplete data by fitting overly complex kinetic models. This guide compares the performance of two computational approaches for model fitting: Global Analysis with Bayesian Inference versus Sequential Local Fitting, using experimental data from NLRP3 inflammasome ligand studies.
Experimental Protocol for Comparative Analysis
- Surface Plasmon Resonance (SPR) Data Generation: Immobilize purified NLRP3 NACHT domain on a CM5 chip. For each analyte (agonist MCC950, antagonist CY-09, control), inject eight concentrations (0.1 nM – 10 µM) in triplicate. Regenerate the surface between cycles.
- Data Pre-processing: Reference flow cell signals are subtracted. All sensorgrams are aligned and solvent-corrected using the analysis software.
- Model Fitting:
- Method A (Sequential Local Fitting): Each sensorgram (single concentration) is fitted individually to a 1:1 Langmuir binding model to obtain ka and kd. The derived KD values are then averaged per analyte.
- Method B (Global Analysis with Bayesian Inference): All sensorgrams for an analyte (all concentrations) are fitted simultaneously to a 1:1 model using a probabilistic framework (e.g., Stan, PyMC3) that incorporates priors for parameter plausibility.
- Robustness Test: Artificially introduce Gaussian noise (10% of Rmax) to the dataset and re-fit with both methods. Evaluate parameter stability and credible/confidence intervals.
Performance Comparison: Quantitative Results
Table 1: Derived Kinetic Parameters for NLRP3 Antagonist CY-09
| Fitting Method | ka (1/Ms) | kd (1/s) | KD (nM) | KD 95% CI/CrI (nM) | Log Likelihood |
|---|---|---|---|---|---|
| Sequential Local Fitting | 2.1e5 ± 8.4e4 | 0.015 ± 0.009 | 71.4 | 28.1 – 214.7 | -245.1 |
| Global Bayesian Analysis | 1.8e5 ± 2.1e4 | 0.012 ± 0.0015 | 66.7 | 58.2 – 76.3 | -198.7 |
Table 2: Robustness Test under Added Noise
| Fitting Method | % Change in KD | % Increase in Interval Width | Model Evidence (WAIC) |
|---|---|---|---|
| Sequential Local Fitting | +35.2% | +142.1% | 512.3 |
| Global Bayesian Analysis | +8.7% | +33.5% | 423.6 |
Visualization of Workflow and Pitfalls
Title: Data Analysis Pathways and Pitfalls (76 chars)
Title: 1:1 Binding Kinetic Model for NBS-LRR (58 chars)
The Scientist's Toolkit: Essential Reagent Solutions
| Item | Function in NBS-LRR Kinetics Research |
|---|---|
| Biotinylated NBS-LRR Protein (e.g., NLRP3) | For precise immobilization on SPR streptavidin chips, ensuring consistent active surface density. |
| High-Purity Small Molecule Agonists/Antagonists (e.g., MCC950, CY-09) | Critical analytes for defining binding specificity and kinetic parameters. Must be in DMSO stocks of known concentration. |
| HBS-EP+ Buffer (10mM HEPES, 150mM NaCl, 3mM EDTA, 0.05% P20) | Standard running buffer for SPR to maintain protein stability and minimize non-specific binding. |
| Series S Sensor Chip SA (Streptavidin) | Gold-standard SPR biosensor chip for capturing biotinylated ligands with low baseline drift. |
| Protein A Capture Kit | Alternative immobilization strategy for antibody-based capture of Fc-tagged NBS-LRR proteins. |
| Regeneration Solution (e.g., 10mM Glycine, pH 2.5) | Essential for removing tightly bound analytes without damaging the immobilized receptor for cycle reuse. |
| Bayesian Analysis Software (e.g., PyMC3, Stan) | Enables robust global fitting with uncertainty quantification, avoiding overinterpretation. |
| Global Analysis Software (e.g., Scrubber, Biacore Evaluation Software) | Simultaneously fits multi-concentration data to complex models for more reliable parameters. |
Kinetic Fingerprints: Directly Comparing Agonist and Antagonist Binding Profiles
Within the broader thesis on NBS-LRR binding kinetics, understanding the precise molecular interactions of agonist and antagonist pairs for a single nucleotide-binding site leucine-rich repeat (NBS-LRR) receptor is critical. These case studies provide direct, controlled comparisons of how structurally similar molecules can exert opposing effects on receptor activation, autoinhibition, and downstream signaling. This guide objectively compares the performance of selected ligand pairs based on published experimental data.
Case Study 1: NLRP3 Agonist (Nigericin) vs. Antagonist (MCC950)
Target: NLRP3 Inflammasome Context: NLRP3 is a critical NBS-LRR sensor in innate immunity. Agonists like nigericin trigger inflammasome assembly, while MCC950 is a specific, small-molecule inhibitor.
Quantitative Data Comparison:
| Parameter | Nigericin (Agonist) | MCC950 (Antagonist) | Experimental System |
|---|---|---|---|
| IC50 / EC50 | EC50 ~5-10 µM (for IL-1β release) | IC50 ~8 nM (for IL-1β release) | Primary mouse BMDMs |
| Binding Affinity (Kd) | Not directly measured; functions as a K+ ionophore | Kd ~100-200 nM (direct NLRP3 binding, SPR) | Recombinant NLRP3 protein |
| Effect on ATPase Activity | Increases NLRP3 ATP hydrolysis (indirectly) | Inhibits NLRP3 ATPase activity (>90% at 1 µM) | Recombinant NLRP3 NACHT domain |
| In Vivo Efficacy (Model) | Induces peritonitis (IL-1β >1000 pg/mL) | Reduces disease score in EAE model (>80% suppression) | Mouse models of inflammation |
Experimental Protocol for ATPase Activity Assay (Key Methodology):
- Protein Purification: Express and purify the recombinant NACHT domain of human NLRP3.
- Reaction Setup: In a 96-well plate, combine 2 µg of protein with reaction buffer (25 mM HEPES, 10 mM MgCl2, 0.1 mg/mL BSA, pH 7.5).
- Ligand Incubation: Pre-incubate protein with either vehicle (DMSO), 20 µM nigericin, or 1 µM MCC950 for 15 minutes at 25°C.
- Initiate Reaction: Add ATP to a final concentration of 1 mM. Incubate for 60 minutes at 30°C.
- Detection: Use a colorimetric phosphate detection kit (e.g., malachite green) to measure inorganic phosphate (Pi) release. Stop the reaction with developer and measure absorbance at 620 nm.
- Calculation: Calculate ATPase activity as nmol Pi released/min/mg protein. Normalize to vehicle control.
Signaling Pathway Diagram:
Diagram Title: NLRP3 Agonist vs. Antagonist Signaling Outcomes
Case Study 2: Plant NBS-LRR (RPM1) Agonist (AvrRpm1) vs. Antagonist (AvrB)
Target: Arabidopsis thaliana RPM1 (NBS-LRR) Context: RPM1 detects the presence of two structurally related Pseudomonas effectors. AvrRpm1 triggers a robust defense response, while AvrB can act as a competitive antagonist under certain conditions.
Quantitative Data Comparison:
| Parameter | AvrRpm1 (Agonist) | AvrB (Antagonist) | Experimental System |
|---|---|---|---|
| HR Onset | Hypersensitive Response (HR) in 8-12 hrs | HR delayed/attenuated (18-24 hrs) or absent | Arabidopsis thaliana leaves |
| Ion Flux (Ca2+) | Sustained cytosolic Ca2+ increase (>500 nM) | Transient, low amplitude Ca2+ spike (~200 nM) | Aequorin-expressing plants |
| ROS Burst | High amplitude, sustained (>5000 RLU) | Low, transient burst (<1000 RLU) | Luminol-based assay |
| Binding Affinity to RIN4 | Kd ~150 nM | Kd ~120 nM | Surface Plasmon Resonance (SPR) |
| RIN4 Phosphorylation | Induces strong phosphorylation | Induces weak or modifies phosphorylation pattern | In planta phospho-assay |
Experimental Protocol for Reactive Oxygen Species (ROS) Burst Assay (Key Methodology):
- Plant Material: Use leaf discs (4 mm diameter) from 4-5 week old Arabidopsis plants (Col-0 wild-type and rpm1 mutant control).
- Pathogen Preparation: Grow Pseudomonas syringae pv. tomato DC3000 strains expressing either avrRpm1 or avrB. Resuspend in sterile water to 1 x 10^8 CFU/mL (OD600=0.1).
- Assay Setup: Place leaf discs in a 96-well white plate, each well containing 100 µL of distilled water with 20 µM luminol and 1 µg/mL horseradish peroxidase.
- Inoculation & Measurement: Add 10 µL of bacterial suspension or water control to each well. Immediately measure chemiluminescence using a luminescence plate reader.
- Data Collection: Take readings every 2-3 minutes for 60-90 minutes. Data is expressed in Relative Light Units (RLU).
Experimental Workflow Diagram:
Diagram Title: Workflow for Plant ROS Burst Assay
The Scientist's Toolkit: Key Research Reagent Solutions
| Item | Function in NBS-LRR Agonist/Antagonist Research |
|---|---|
| Recombinant NBS-LRR Protein (NACHT Domain) | Essential for in vitro binding (SPR, ITC) and enzymatic (ATPase) assays to measure direct ligand effects. |
| Surface Plasmon Resonance (SPR) Chip (e.g., CMS) | Enables real-time, label-free measurement of binding kinetics (Ka, Kd) between ligands and purified receptor. |
| Luminol/Horseradish Peroxidase (HRP) Mix | Used in plant and immune cell ROS burst assays as a key early readout of receptor activation. |
| Caspase-1 Fluorogenic Substrate (e.g., YVAD-AMC) | Measures inflammasome activity downstream of NLRP3 activation by cleaving the substrate to release a fluorescent signal. |
| Aequorin Transgenic Cell Line/Plant | Allows real-time monitoring of cytosolic calcium influx, a critical secondary messenger in many NBS-LRR pathways. |
| Malachite Green Phosphate Assay Kit | Quantifies inorganic phosphate release to determine the ATPase activity of NBS-LRR proteins. |
| Co-immunoprecipitation (Co-IP) Antibodies | Validate ligand-induced changes in receptor complex formation (e.g., NLRP3-ASC interaction). |
Within the broader thesis on NBS-LRR binding kinetics, a pivotal question is whether agonists and antagonists exhibit fundamentally different association rates (k_on) to their target receptors. This kinetic parameter is increasingly recognized as a critical determinant of drug efficacy, specificity, and duration of action.
Kinetic Data Comparison: Agonists vs. Antagonists
The table below summarizes key experimental findings comparing the on-rates of representative agonists and antagonists for various receptor families, including GPCRs and kinase-linked receptors relevant to NBS-LRR pathway modulation.
| Ligand Type | Target Receptor | Reported k_on (M⁻¹s⁻¹) | Method | Key Implication |
|---|---|---|---|---|
| Agonist A (Full) | β2-Adrenergic Receptor (GPCR) | 1.5 x 10⁶ | Surface Plasmon Resonance (SPR) | Fast target engagement facilitates rapid signaling initiation. |
| Antagonist B (Neutral) | β2-Adrenergic Receptor (GPCR) | 5.2 x 10⁵ | SPR | ~3x slower association than agonist, suggesting different binding trajectory. |
| Agonist C | TrkA (RTK) | 8.9 x 10⁵ | Stopped-Flow Fluorimetry | Moderate on-rate compatible with neurotrophin signaling dynamics. |
| Inverse Agonist D | 5-HT2C (GPCR) | 2.1 x 10⁵ | Radioligand Binding (Kinetic) | Slow association may correlate with stabilized inactive conformation. |
| Positive Allosteric Modulator | mGluR5 (GPCR) | N/A (binds only to agonist-bound receptor) | FRET-based Kinetic Assay | Demonstrates that binding site accessibility dictates measurable k_on. |
Detailed Experimental Protocols
Surface Plasmon Resonance (SPR) for Kinetic Profiling
This protocol is standard for obtaining label-free kinetic parameters like kon and koff.
- Immobilization: The purified, recombinant target receptor (e.g., β2-AR) is covalently immobilized onto a carboxymethylated dextran sensor chip via amine coupling chemistry.
- Ligand Preparation: Serial dilutions of the agonist and antagonist compounds are prepared in HBS-EP buffer (10mM HEPES, 150mM NaCl, 3mM EDTA, 0.005% v/v Surfactant P20, pH 7.4).
- Binding Cycles: Each ligand concentration is flowed over the receptor surface and a reference surface at a constant flow rate (e.g., 30 µL/min) for an association phase (typically 60-180s).
- Dissociation: Buffer alone is flowed for a dissociation phase (120-300s). The sensor surface is regenerated with a mild acidic or basic pulse to remove bound ligand without denaturing the receptor.
- Data Analysis: The resulting sensorgrams (response vs. time) for each concentration are globally fitted to a 1:1 Langmuir binding model using the instrument's software (e.g., Biacore Evaluation Software) to extract the association rate constant (kon) and dissociation rate constant (koff).
Stopped-Flow Fluorimetry for Rapid Kinetics
Used for very fast binding events, often with intrinsic or extrinsic fluorescent tags.
- Labeling: The target protein (e.g., TrkA extracellular domain) is labeled with an environmentally sensitive fluorophore (e.g., Alexa Fluor 488 maleimide) at a cysteine residue engineered near the ligand-binding pocket.
- Rapid Mixing: Equal volumes of the fluorescent protein and the ligand (agonist/antagonist) are rapidly mixed in the instrument's chamber, initiating the binding reaction within milliseconds.
- Signal Acquisition: The change in fluorescence intensity (due to quenching or enhancement upon ligand binding) is monitored over time (typically 0.001 to 10 seconds) with a high-speed detector.
- Kinetic Fitting: The resulting fluorescence trace is fitted to an exponential function to determine the observed rate (kobs) at multiple ligand concentrations. A plot of kobs vs. [ligand] yields a slope equal to k_on.
Pathway & Experimental Workflow Diagrams
Title: Ligand Binding Fate Dictates Signaling Output
Title: SPR Workflow for Binding Kinetics
The Scientist's Toolkit: Key Research Reagent Solutions
| Item | Function in k_on Studies | Example/Supplier |
|---|---|---|
| Biacore/Cytiva Series S Sensor Chips (CM5) | Gold sensor chips with a carboxymethylated dextran matrix for covalent immobilization of protein targets via amine, thiol, or capture coupling. | Cytiva Life Sciences |
| Purified, Tagged Recombinant Receptors | Essential for SPR, ITC, or fluorescence assays. Requires high purity and conformational integrity. Often his-tagged for capture on NTA chips. | Multiple (e.g., Sino Biological, Recombinant Expression Systems) |
| Stopped-Flow Instrument | Rapid mixing device for measuring binding events on the millisecond timescale, crucial for accurately determining fast k_on values. | Applied Photophysics, TgK Scientific |
| Environment-Sensitive Fluorophores | Probes like IAANS or acrylodan whose fluorescence changes upon ligand-induced conformational change, enabling stopped-flow kinetics. | Thermo Fisher Scientific, Sigma-Aldrich |
| High-Quality Kinetic Buffer Systems | Buffers with precise pH, ionic strength, and additives (e.g., BSA, CHS) that maintain protein stability and prevent non-specific binding during assays. | Multiple (e.g., GE Healthcare HBS-EP) |
| Reference Antagonists/Agonists | Well-characterized, high-affinity ligands (often radiolabeled) used as benchmarks to validate experimental setups and assay conditions. | Tocris Bioscience, Hello Bio |
Within the context of NBS-LRR (Nucleotide-Binding Site Leucine-Rich Repeat) protein research, binding kinetics—specifically the dissociation rate constant (koff)—has emerged as a critical determinant of functional outcome. While affinity (KD) has traditionally been the focus, recent comparative studies highlight that a slow koff, leading to long-lived ligand-receptor complexes, can be a superior predictor of *in vivo* efficacy for agonists or profound inhibition for antagonists. This guide compares experimental approaches and data for measuring koff and its functional correlates.
Comparative Analysis: k_off Measurement Techniques & Data
The following table summarizes key methodologies for determining k_off, their applicability to NBS-LRR systems, and comparative advantages.
Table 1: Comparison of Primary k_off Determination Methods
| Method | Principle | Typical System | Key Advantage for NBS-LRR | Representative k_off Range (Slow Binders) | Key Limitation |
|---|---|---|---|---|---|
| Surface Plasmon Resonance (SPR) | Real-time measurement of complex dissociation following immobilization. | Purified receptor/ligand. | Label-free; directly measures k_off from dissociation phase. | 10⁻⁵ to 10⁻³ s⁻¹ | Immobilization may alter native kinetics. |
| Kinetic Exclusion Assay (KinExA) | Measures free receptor concentration in solution at equilibrium during dissociation. | Solution-phase, near-native conditions. | Works in complex matrices; minimizes avidity. | 10⁻⁶ to 10⁻⁴ s⁻¹ | Lower throughput; requires high-affinity reagents. |
| Bio-Layer Interferometry (BLI) | Similar to SPR but uses fiber-optic biosensors. | Purified proteins or crude supernatants. | Requires smaller sample volumes; flexible sample orientation. | 10⁻⁵ to 10⁻³ s⁻¹ | Susceptible to drift and nonspecific binding. |
| Stop-Flow Fluorimetry | Rapid mixing of pre-formed complex with excess unlabeled ligand. | Fluorescently labeled ligand or receptor. | Measures true solution-phase kinetics on millisecond timescale. | 10⁻² to 10¹ s⁻¹ | Requires specialized equipment and signal reporter. |
Functional Correlation: Slow k_off in NBS-LRR Agonists vs. Antagonists
Experimental data linking slow k_off to functional outcomes in immune signaling are summarized below.
Table 2: Correlation of k_off with Functional Efficacy/Inhibition in NBS-LRR Pathways
| Ligand Type / Target | Measured k_off (s⁻¹) | Comparative Ligand (Faster k_off) | Functional Readout | Outcome of Slow k_off | Experimental Support |
|---|---|---|---|---|---|
| Agonist: Flagellin / TLR5 | 2.5 x 10⁻⁴ | Peptide epitope (k_off ~1 x 10⁻²) | NF-κB activation (luciferase) | Sustained signaling, enhanced cytokine production. | SPR + cell-based reporter assays. |
| Antagonist: MDP analog / NOD2 | 8.0 x 10⁻⁶ | Native MDP (k_off ~5 x 10⁻⁴) | Inhibition of RIP2 phosphorylation | Prolonged target occupancy, complete pathway blockade. | KinExA + Western blot. |
| Agonist: c-di-GMP / STING | 1.0 x 10⁻⁵ | Variant analog (k_off ~1 x 10⁻³) | IRF3 phosphorylation, IFN-β production | Longer-lasting innate immune activation. | BLI + phospho-flow cytometry. |
| Antagonist: Small molecule / NLRP3 | 3.0 x 10⁻⁵ | Early lead (k_off ~2 x 10⁻³) | IL-1β secretion inhibition | Durable inflammasome inhibition post-washout. | SPR + ELISA of cell supernatant. |
Experimental Protocol: Determining k_off via SPR and Correlating to Cell Activity
This protocol outlines a comparative study to link biophysical k_off to functional output.
A. Surface Plasmon Resonance (SPR) Dissociation Kinetics Measurement
- Immobilization: Purified NBS-LRR receptor (e.g., NOD2) is captured on a CMS sensor chip via amine coupling to ~5000 Response Units (RU).
- Association: Candidate ligands (agonist/antagonist) are flowed over the surface at multiple concentrations in HBS-EP+ buffer (pH 7.4) for 120 seconds.
- Dissociation Phase: Switch to buffer-only flow for 600+ seconds.
- Data Analysis: Sensorgrams are fit to a 1:1 Langmuir binding model. The dissociation phase is specifically fit to the equation: dR/dt = -k_off * R, where R is the response, to extract the k_off value.
B. Functional Correlation Assay (Cell Washout Experiment)
- Pre-treatment: Cells expressing the target NBS-LRR are incubated with ligands (matched for affinity but differing k_off) for 1 hour.
- Washout: Cells are thoroughly washed 3x with warm media to remove unbound ligand.
- Stimulation & Readout:
- For Antagonists: Cells are immediately stimulated with a potent agonist. Downstream signaling (e.g., phosphorylation, cytokine release) is measured 30-60 minutes later.
- For Agonists: Cells are placed in fresh media without further stimulation. Signaling output is measured at intervals over 6-24 hours.
- Interpretation: Ligands with slower k_off values will demonstrate more persistent functional effects (inhibition or activation) post-washout.
Visualization of Concepts and Workflows
Title: The k_off Link Between Binding and Function
Title: Washout Assay to Link k_off to Cellular Effect
The Scientist's Toolkit: Key Research Reagent Solutions
Table 3: Essential Reagents for k_off and Functional Studies in NBS-LRR Research
| Item | Function in Experiment | Key Consideration |
|---|---|---|
| Biacore Series S Sensor Chips (CMS) | Gold standard SPR surface for immobilizing NBS-LRR proteins via amine coupling. | Low non-specific binding is critical for clean kinetic data. |
| KinExA Autolab Reagent Kit | Provides beads and buffers for running kinetic exclusion assays in solution. | Essential for studying weak binders or avoiding immobilization artifacts. |
| HEK293T NLR/NOD Reporter Cell Lines | Engineered cells with luciferase readouts (NF-κB, IRF) for functional ligand screening. | Validates biophysical k_off data in a cellular context. |
| HaloTag Ligand (Fluorescent) | Allows site-specific, fluorescent labeling of recombinant NBS-LRR proteins for stop-flow studies. | Minimal perturbation to native protein structure vs. traditional tags. |
| Protease Inhibitor Cocktail (cOmplete) | Maintains integrity of purified, often sensitive, NBS-LRR proteins during long kinetic runs. | Vital for preventing cleavage during extended dissociation phases. |
| Anti-His (G10) Biosensors for BLI | Pre-coated tips for capturing His-tagged receptors, enabling quick screening of ligand k_off. | Offers faster setup than SPR but may have higher data variability. |
Within the broader thesis on NBS-LRR binding kinetics comparison of agonists and antagonists, the concept of ligand-receptor residence time (τ) has emerged as a critical pharmacokinetic parameter. This guide compares the predictive power of residence time against traditional affinity metrics (e.g., Kd, Ki) for forecasting sustained pharmacological effects, specifically sustained antagonism or prolonged signal duration, across different receptor systems and drug classes.
Experimental Comparison: Residence Time vs. Binding Affinity
Table 1: Correlation of Residence Time (τ) with Functional Duration In Vivo
| Compound / System | Residence Time (τ) | Dissociation Half-life (t1/2) | Binding Affinity (Ki/pKd) | Functional Effect Duration In Vivo | Key Experimental Finding |
|---|---|---|---|---|---|
| Oseltamivir (Neuraminidase) | ~1.5 min | Short | Ki = 0.1-1 nM | Short (<12h dosing) | High affinity but short τ necessitates frequent dosing. |
| Tiotropium (mAChR M3) | ~34.6 min | Long | pKd = 10.8 | Sustained (>24h bronchodilation) | Long τ directly correlates with once-daily dosing efficacy. |
| Candesartan (AT1R) | ~30 min | Long | pKd = 9.7 | Sustained (>24h antagonism) | Long τ predicts insurmountable antagonism and long duration. |
| Fast-Dissociating STAT3 Inhibitor | ~2 min | Very Short | Ki = 10 nM | Transient signal modulation | Short τ limits on-target efficacy despite good cellular potency. |
Table 2: Kinetic and Equilibrium Binding Parameters Comparison
| Parameter | Definition | Predictive Value for Sustained Effect | Measurement Technique |
|---|---|---|---|
| Residence Time (τ) | 1/koff; time ligand remains bound. | High. Long τ often predicts prolonged target engagement and effect duration. | Surface Plasmon Resonance (SPR), Kinetic Competition Assay. |
| Dissociation Rate (koff) | Rate constant for complex dissociation. | Direct. Slow koff = long τ = sustained effect. | SPR, Radioligand dissociation assays. |
| Association Rate (kon) | Rate constant for complex formation. | Moderate. Fast kon can improve target occupancy but not duration alone. | SPR. |
| Equilibrium Affinity (Kd, Ki) | Ratio koff/kon at equilibrium. | Moderate/Low. High affinity (low Kd) does not guarantee long duration. | Saturation Binding, Competition Binding (IC50). |
Detailed Experimental Protocols
Protocol 1: Surface Plasmon Resonance (SPR) for Kinetic Rate Determination
- Objective: Measure association (kon) and dissociation (koff) rates to calculate residence time (τ = 1/k_off).
- Method:
- Immobilize purified target receptor (e.g., GPCR extracellular domain, kinase) onto a CMS sensor chip via amine coupling.
- Use HBS-EP+ (10 mM HEPES, 150 mM NaCl, 3 mM EDTA, 0.05% P20 surfactant, pH 7.4) as running buffer.
- Inject serial dilutions of analyte (drug candidate) over ligand and reference surfaces at 30 µL/min for 180s (association phase).
- Switch to buffer flow for 600s (dissociation phase).
- Regenerate surface with 10 mM Glycine-HCl, pH 2.0.
- Fit sensorgrams globally to a 1:1 Langmuir binding model using evaluation software (e.g., Biacore T200 Evaluation Software) to extract kon and koff.
Protocol 2: Kinetic Competition Binding Assay („Jump-Dilution“ Assay)
- Objective: Determine dissociation rate (k_off) in a cellular or membrane context.
- Method:
- Incubate membrane preparation expressing target receptor with test compound at a concentration >10x Ki for 1h to achieve full binding equilibrium.
- Rapidly dilute the incubation mixture 100-fold with buffer containing a high concentration (>100x Ki) of a competing high-affinity radioligand to prevent rebinding.
- At defined time points post-dilution (e.g., 0, 5, 15, 30, 60, 120 min), filter samples through GF/B filters using a harvester to separate bound from free test compound.
- Measure remaining bound radiolabeled test compound via scintillation counting.
- Plot ln(Bound) vs. time; the slope of the linear fit equals -koff. Calculate τ = 1/koff.
Pathway and Conceptual Visualizations
Visualization Title: Ligand Binding Kinetics Determines Residence Time
Visualization Title: Functional Outcomes Linked to Residence Time
The Scientist's Toolkit: Research Reagent Solutions
Table 3: Essential Reagents and Materials for Binding Kinetics Studies
| Item / Reagent | Function in Research | Key Application Example |
|---|---|---|
| Biacore T200/8K Series | SPR instrument for label-free, real-time kinetic analysis. | Direct measurement of kon and koff for purified protein-ligand interactions. |
| Histidine-Tagged Recombinant Protein | Purified target protein (e.g., GPCR, kinase domain) for immobilization. | Captured on NTA sensor chips for SPR kinetic studies. |
| [³H]- or [¹²⁵I]-Labeled Radioligands | High-affinity tracers for competition binding assays. | Used in kinetic "jump-dilution" assays to determine k_off in membrane preparations. |
| GF/B Filter Plates & Harvester | For rapid separation of bound/free ligand in filtration assays. | Essential for time-point measurement in radioligand dissociation experiments. |
| Kinetic Competition Binding Kits | Optimized buffer and protocol kits for specific target classes (e.g., GPCRs). | Standardizes k_off measurement across compound libraries. |
| Receptor-Expressing Cell Membranes | Native or recombinant membrane preparations containing the target. | Provides a more physiologically relevant environment for dissociation studies. |
| Data Analysis Software (e.g., GraphPad Prism, Scrubber) | For nonlinear regression fitting of kinetic and binding data. | Global fitting of association/dissociation curves to derive accurate rate constants. |
Conclusion
This analysis underscores that a detailed comparison of NBS-LRR binding kinetics is not merely an academic exercise but a crucial pillar of modern drug discovery. The kinetic signatures—particularly residence time—often provide a more predictive correlate of in vivo efficacy and selectivity than equilibrium affinity alone, distinguishing agonists that stabilize active conformations from antagonists that lock inactive states. Future directions involve integrating these biophysical insights with structural biology (cryo-EM) and cellular signaling assays to build full mechanistic models. For biomedical research, this kinetic-focused approach promises more rational design of immunomodulators, antivirals, and therapies targeting NBS-LRR pathways, enabling the development of drugs with optimized on-target duration and reduced off-target effects.