Decoding NLR Signaling: A Structural Deep Dive into NBS vs NACHT Domains
This article provides a comprehensive structural and functional analysis of the Nucleotide-Binding Site (NBS) and NACHT domains, core components of NLR (NOD-like receptor) immune sensors.
Decoding NLR Signaling: A Structural Deep Dive into NBS vs NACHT Domains
Abstract
This article provides a comprehensive structural and functional analysis of the Nucleotide-Binding Site (NBS) and NACHT domains, core components of NLR (NOD-like receptor) immune sensors. We explore their evolutionary origins, conserved architecture, and mechanism of nucleotide-dependent activation. The content details methodologies for studying their dynamics, common experimental challenges, and comparative insights into their roles in innate immunity and inflammasome formation. Aimed at researchers and drug developers, this review synthesizes current knowledge to inform targeted therapeutic strategies for inflammatory and autoimmune diseases.
Architectural Blueprints: Unveiling the Core Structure of NBS and NACHT Domains
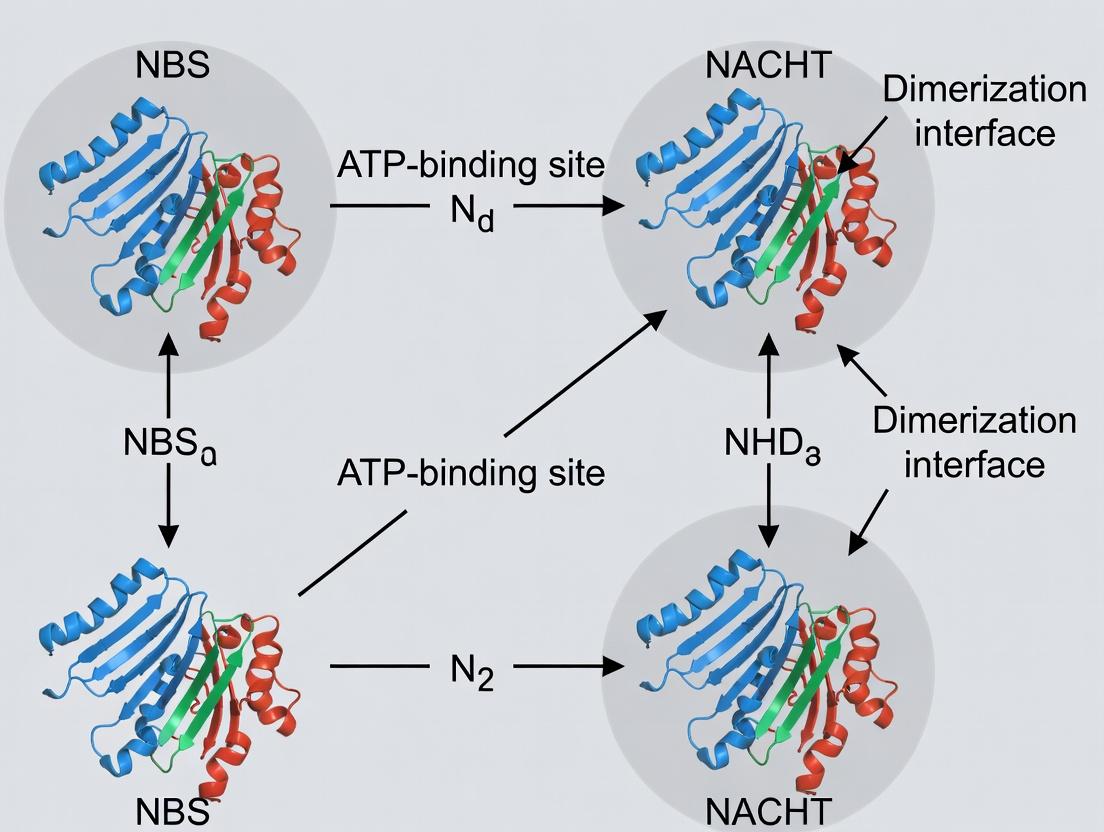
The NBS (Nucleotide-Binding Site) and NACHT domains are central to the function of innate immune sensors and cell death regulators. The nomenclature reflects a history of independent discovery and subsequent reconciliation. The NBS domain is a broad structural classification describing a conserved fold that binds ATP or GTP, frequently associated with a downstream superfamily-specific domain (e.g., LRR, WD40). The NACHT domain is a specific subclass of the NBS domain, found exclusively in animal NLR (NOD-like receptor) proteins. The name NACHT is an acronym derived from NAIP (NLR family Apoptosis Inhibitory Protein), C2TA (Class 2 transcription activator), HET-E (incompatibility locus protein from Podospora anserina), and TP1 (Telomerase-associated protein 1).
This guide compares these domains within the context of structural research, focusing on evolutionary origins, functional mechanisms, and implications for drug targeting.
Evolutionary Origins Comparison
| Feature | NBS Domain (Broad Class) | NACHT Domain (NLR-specific) |
|---|---|---|
| Phylogenetic Distribution | Ubiquitous across all kingdoms of life (Prokaryotes, Archaea, Eukaryotes). | Metazoan-specific (animals). |
| Evolutionary Progenitor | Ancient ATPase module, likely involved in stress response & chaperone functions. | Derived from eukaryotic STAND (Signal Transduction ATPases with Numerous Domains) ATPases, itself a subset of the broader NBS class. |
| Key Protein Families | AAA+ ATPases, GTPases, NLRs, AP-ATPases, ABC transporters. | NLRs (e.g., NOD1, NOD2, NLRP3), NAIP, CIITA. |
| Core Evolutionary Driver | Fundamental ATP-binding and hydrolysis for molecular switching or scaffolding. | Specialization in pathogen sensing and activation of inflammation & cell death. |
Structural & Functional Comparison: Performance Data
Recent structural studies (Cryo-EM, X-ray crystallography) provide quantitative data on key functional parameters.
Table 1: Comparative Structural and Biochemical Performance Metrics
| Metric | Canonical NBS (e.g., AAA+ ATPase) | NLR-NACHT Domain (e.g., NLRP3, NLRC4) | Experimental Method |
|---|---|---|---|
| Nucleotide Bound | ATP or GTP (family-dependent). | Typically ATP/dATP. | Isothermal Titration Calorimetry (ITC) |
| ATP Hydrolysis Rate (kcat) | High (0.1 - 100 min⁻¹). | Very Low (< 0.1 min⁻¹); often regulated. | Malachite Green Phosphate Assay |
| Quaternary Activation | Often homo-hexameric ring. | Induced oligomerization (e.g., wheel- or disk-like). | Size Exclusion Chromatography-Multi-Angle Light Scattering (SEC-MALS) |
| Key Conformational Change | Rigid body rotation in α-helical subdomain. | HD1-HD2 subdomain rotation relative to NBD and WHD. | Hydrogen-Deuterium Exchange Mass Spectrometry (HDX-MS) |
| Activation Energy Barrier | Lower, optimized for catalytic cycle. | Higher, tightly controlled by autoinhibition. | Differential Scanning Fluorimetry (DSF) |
| Binding Affinity for ATP (Kd) | 1 - 100 µM. | 10 - 500 µM (often weaker, requiring stabilizing partners). | Microscale Thermophoresis (MST) |
Experimental Protocol: HDX-MS for Mapping Nucleotide-Induced Conformational Changes
This protocol is key for comparing NBS/NACHT dynamics.
A. Sample Preparation:
- Purify recombinant human NACHT protein (e.g., NLRP3 residues 1-440) and a control AAA+ ATPase.
- Buffer exchange into deuterated PBS pD 7.4.
- Prepare two states: Apo and ATP-analog bound (e.g., ATPγS, 1mM).
B. Deuterium Labeling:
- Mix 5 µL of protein (10 µM) with 45 µL of deuterated buffer for each state.
- Allow labeling at 25°C for five time points (e.g., 10s, 1min, 5min, 20min, 2hr).
- Quench reaction by adding 50 µL of pre-chilled 3M urea, 1% TFA (pH 2.5).
C. Analysis:
- Rapidly inject quenched sample onto an immobilized pepsin column for digestion.
- Trap resulting peptides on a UPLC column at 0°C.
- Elute peptides into a high-resolution mass spectrometer (e.g., Q-TOF).
- Identify peptides via tandem MS/MS and measure mass shift for deuterium incorporation using specialized software (e.g., HDExaminer).
D. Data Interpretation: Regions showing significant decreased deuterium uptake upon nucleotide binding are involved in direct interaction or allosteric rigidification. Regions showing increased uptake become more dynamic. NACHT domains typically show large, allosteric changes in the HD2 and WHD subdomains compared to more localized effects in generic NBS domains.
Visualizing NLR Activation Pathway Featuring the NACHT Domain
Title: NLR Activation Pathway Driven by NACHT
Key Research Reagent Solutions
Table 2: Essential Toolkit for NBS/NACHT Domain Research
| Reagent / Material | Function & Application | Example Product/Cat. # |
|---|---|---|
| Non-hydrolyzable ATP Analogs (ATPγS, AMP-PNP) | Traps NBS/NACHT domains in active nucleotide-bound state for structural studies. | Sigma A1388 (ATPγS) |
| MST-Compatible Dyes (e.g., NT-647) | Label proteins for Microscale Thermophoresis to measure nucleotide/protein binding affinities (Kd). | NanoTemper MO-L011 |
| HDX-MS Buffer Kits | Pre-formulated deuterated buffers and quench solutions for reproducible Hydrogen-Deuterium Exchange experiments. | Waters 186009092 |
| Recombinant NLR NACHT Domains | Purified, stable protein fragments for in vitro biochemistry. | InvivoGen recombinant NOD2 (100-334) |
| MALT1 Paracaspase Activity Assay | For functional readout of upstream CARD9/Bcl10/MALT1 signaling activated by some NLRs. | BPS Bioscience 78011 |
| Selective NLRP3 Inhibitors (MCC950/CRID3) | Tool compounds to test functional dependency on NACHT ATPase activity in cellular assays. | Cayman Chemical 21610 |
| Anti-NLRP3 Monoclonal Antibody (Cryo-EM grade) | For immunoprecipitation and complex stabilization for structural biology. | Adipogen AG-20B-0014-C100 |
| SEC-MALS System | Analytical chromatography coupled to multi-angle light scattering for determining absolute molecular weights of oligomers. | Wyatt Technology miniDAWN TREOS |
Within structural biology and nucleotide-binding domain research, the conserved P-loop fold featuring Walker A and Walker B motifs is a cornerstone for understanding protein function. This comparison guide, framed within a thesis comparing Nucleotide-Binding Site (NBS) domains (e.g., in NLR proteins) to the related but distinct NACHT domains, objectively analyzes the performance of the canonical Walker A/B/Mg²⁺ site architecture against variant or non-canonical alternatives found in other ATPase families. Performance is assessed through key metrics: nucleotide binding affinity, hydrolysis rates, and structural stability.
Quantitative Performance Comparison
Table 1: Comparative Analysis of Nucleotide-Binding Domain Architectures
| Domain/Protein Family | Canonical Walker A (GXXXXGK[T/S]) | Canonical Walker B (hhhhDE) | Mg²⁺ Coordination | Kd for ATP (µM)* | Hydrolysis Rate kcat (min⁻¹)* | Structural Stability (ΔGunfolding, kcal/mol)* | Primary Functional Role |
|---|---|---|---|---|---|---|---|
| Classical NBS (e.g., ABC Transporter) | Yes | Yes | Intact, via Walker A/B & water | 10 - 100 | 50 - 500 | 8 - 12 | Active transport |
| NLR NBS Domain (e.g., NLRC4) | Yes | Often deviant (e.g., D→E, hhhhDD) | Often altered | 50 - 200 | <1 - 10 | 6 - 10 | Signal transduction hub |
| NACHT Domain (e.g., NLRP3) | Yes | Variant (e.g., DE→WE) | Present but geometry may vary | 20 - 150 | 0.1 - 5 | 7 - 11 | Inflammasome oligomerization |
| AAA+ ATPase | Yes | Yes | Intact | 5 - 50 | 100 - 1000 | 10 - 15 | Macromolecular remodeling |
| G-proteins (Ras-like) | Modified (GXXGXGK) | Absent; replaced by other motifs | Via Thr/Swtch I/II | 0.01 - 1 | 0.01 - 0.1 | 5 - 9 | Molecular switch |
*Representative ranges from literature; specific values are protein-dependent.
Experimental Data & Protocols
Isothermal Titration Calorimetry (ITC) for Binding Affinity
Protocol: Purified nucleotide-binding domain (e.g., NLRP3 NACHT) is placed in the sample cell. ATP (or ADP) in syringe is titrated in 2-10 µL increments at constant temperature (25°C). The heat change is measured after each injection. Data Interpretation: Integrated heat peaks are fit to a single-site binding model to derive stoichiometry (N), dissociation constant (Kd), and enthalpy (ΔH). Performance Note: Canonical Walker A/B/Mg²⁺ sites typically show tighter binding (lower Kd) and more exothermic ΔH compared to variant NLR/NACHT domains, indicating optimized interactions.
Malachite Green Phosphate Release Assay for Hydrolysis
Protocol: 1-10 µM protein is incubated with 1 mM ATP, 5 mM MgCl₂ in buffer at 30°C. Aliquots are taken at time points (0-60 min) and mixed with malachite green/ammonium molybdate reagent. After 10-30 min, absorbance at 620-660 nm is measured against a KH₂PO₄ standard curve. Data Interpretation: Phosphate release over time yields hydrolysis rate. Performance Note: Classical NBS/AAA+ domains exhibit significantly higher kcat than NLR/NACHT domains, where hydrolysis is often slow and may function as a regulatory timer rather than a rapid enzyme.
Differential Scanning Fluorimetry (DSF) for Stability
Protocol: 5 µM protein with 5X SYPRO Orange dye in the presence/absence of 1 mM ATP/Mg²⁺. Temperature is ramped from 25°C to 95°C at 1°C/min in a real-time PCR machine, monitoring fluorescence. Data Interpretation: The inflection point (Tm) and fitting to a Boltzmann sigmoid provides ΔGunfolding. Performance Note: Ligand binding typically stabilizes all folds, but the magnitude of ΔΔG is greater in canonical sites, demonstrating optimized allostery.
Structural & Mechanistic Diagrams
Title: Canonical vs. NACHT Walker Motifs and Function
Title: Comparative Analysis Experimental Workflow
The Scientist's Toolkit: Research Reagent Solutions
Table 2: Essential Materials for NBS/NACHT Domain Studies
| Reagent/Material | Function in Analysis | Example/Supplier Note |
|---|---|---|
| Recombinant NBD/NACHT Protein | Core analyte for assays. Requires high purity (>95%). | Expressed in E. coli or insect cells with His-tag for IMAC purification. |
| Adenine Nucleotides (ATP, ADP, ATPγS) | Substrates/ligands for binding & hydrolysis assays. Use >99% purity, Li⁺ or Na⁺ salts. | Sigma-Aldrich Jena Bioscience. ATPγS is non-hydrolyzable control. |
| MgCl₂ Solution | Essential cofactor for nucleotide binding & catalysis. | Molecular biology grade. Titrate to optimize concentration. |
| ITC Assay Buffer Kit | Provides optimized, degassed, matched buffer to minimize heat artifacts. | Malvern Panalytical, TA Instruments. |
| Malachite Green Phosphate Assay Kit | Sensitive colorimetric detection of inorganic phosphate from hydrolysis. | Abcam, Sigma-Aldrich, or in-house formulation. |
| SYPRO Orange Protein Gel Stain | Fluorescent dye for DSF to monitor protein unfolding. | Thermo Fisher Scientific (used at 5-10X concentrate). |
| Size Exclusion Chromatography (SEC) Column | Final polishing step to obtain monodisperse, stable protein. | Cytiva Superdex 200 Increase, Bio-Rad ENrich. |
| Crystallization Screen Kits | For structural determination of the Mg²⁺-bound state. | Hampton Research (Index, PEG/Ion), Molecular Dimensions. |
This guide demonstrates that while the Walker A/B/Mg²⁺ site fold is conserved, its performance is highly tunable. The canonical architecture excels in efficient, high-turnover catalysis. In contrast, the variant motifs prevalent in NBS and NACHT domains of innate immune sensors like NLRs exhibit attenuated hydrolysis and modified allostery, a performance trade-off that likely supports their specialized role as regulated signal transduction switches rather than classical enzymes. This functional divergence, rooted in subtle structural differences, is a critical focus for comparative studies and informs targeted drug development aimed at modulating these pathways.
The classification of STAND (Signal Transduction ATPases with Numerous Domains) family NTPases, specifically the Nucleotide-Binding Site (NBS) and NACHT domains, has long relied on sequence homology. However, a deeper structural analysis reveals definitive motifs that functionally differentiate these pivotal immune signaling domains. This comparison guide, framed within broader structural comparison research, objectively details these distinctions with supporting experimental data.
Key Structural & Functional Motifs Comparison
Table 1: Core Distinguishing Structural Motifs
| Motif Feature | NBS Domain (e.g., NLRC4) | NACHT Domain (e.g., NLRP3) | Experimental Determination Method |
|---|---|---|---|
| Conserved Walker A/B | Present (GxxxxGK[T/S], hhhhD) | Present (Variants: GxxPGxGK[T/S], hhhhD) | X-ray Crystallography, Mutagenesis + ATPase Assay |
| WHyD Motif | Characteristic C-terminal Trp-His-xxx-Asp. | Absent. Replaced by other motifs. | Cryo-EM reconstruction & Sequence alignment. |
| Sensor 1 / Sensor 2 | Less defined; Arg/Lys (Sensor1), Glu/Asp (Sensor2). | Highly conserved 'Sensor 1' (Asn/Thr), 'Sensor 2' (Arg). | Mutagenesis disrupting oligomerization (SEC-MALS). |
| HD1 / HD2 Motifs | Absent. | Defining Feature: Hydrophobic Domain 1 & 2 mediate intra- to inter- protomer contact. | Comparative structural modeling & cross-linking MS. |
| Activation Nucleation | Often requires direct ligand sensing (e.g., flagellin). | Often requires upstream signal integration (e.g., K⁺ efflux). | In vitro reconstitution with liposomes or organelle fractions. |
Table 2: Quantitative Functional Comparison from Representative Studies
| Assay Parameter | NBS (NLRC4) | NACHT (NLRP3) | Experimental System |
|---|---|---|---|
| ATP Hydrolysis Rate (kcat, min⁻¹) | 0.5 - 2.0 | 0.1 - 0.5 | Recombinant protein, Malachite Green assay. |
| Nucleotide Binding Affinity (Kd for ATP-γ-S, μM) | ~5 - 15 | ~10 - 30 | Isothermal Titration Calorimetry (ITC). |
| Oligomerization Size (Subunits) | 10-12 (Inflammasome) | 10-12 (Inflammasome) | Native PAGE / Cryo-EM single-particle analysis. |
| Critical Activation Residue Mutation Effect | WHyD Trp→Ala: -95% activity | HD1 Arg→Ala: -99% activity | Cell-based IL-1β release ELISA. |
Experimental Protocols for Key Comparisons
1. Protocol: Determining Nucleotide-Dependent Oligomerization (Size Exclusion Chromatography with Multi-Angle Light Scattering - SEC-MALS)
- Purpose: Quantify the molecular weight of NBS/NACHT protein complexes in different nucleotide states.
- Method:
- Purify recombinant NBS (NLRC4) or NACHT (NLRP3) domain proteins (residues encompassing the STAND module).
- Pre-incubate protein (50 µM) for 30 min in: a) No nucleotide, b) 1 mM ADP, c) 1 mM ATP-γ-S (non-hydrolyzable analog).
- Inject sample onto a Superdex 200 Increase 10/300 GL column pre-equilibrated with 20 mM HEPES, 150 mM NaCl, pH 7.4, with corresponding nucleotide.
- Connect output to a MALS detector and refractive index (RI) detector. Use ASTRA software to calculate absolute molecular weight across the elution peak.
2. Protocol: In Vitro ATPase Activity Assay (Malachite Green Phosphate Detection)
- Purpose: Measure ATP hydrolysis kinetics to compare NBS vs. NACHT enzymatic function.
- Method:
- Prepare reaction buffer: 20 mM HEPES pH 7.5, 150 mM NaCl, 5 mM MgCl₂.
- Mix 2 µM protein with 1 mM ATP in buffer. Incubate at 30°C.
- At time points (0, 5, 15, 30, 60 min), quench 25 µL aliquot with 100 µL Malachite Green reagent (0.081% malachite green, 2.32% polyvinyl alcohol, 5.72% ammonium molybdate in 6N HCl).
- After 1 min, add 10 µL of 34% sodium citrate to stabilize color. Measure A620nm.
- Calculate phosphate concentration using a KH₂PO₄ standard curve. Derive kcat.
Visualizations
Diagram 1: Distinctive Motifs in NBS vs NACHT Domains (76 characters)
Diagram 2: Contrasting Activation Pathways for NBS and NACHT (79 characters)
The Scientist's Toolkit: Research Reagent Solutions
Table 3: Essential Reagents for Structural-Functional Analysis
| Reagent / Material | Function in Research | Example Supplier / Catalog |
|---|---|---|
| ATP-γ-S (Adenosine 5′-[γ-thio]triphosphate) | Non-hydrolyzable ATP analog used to trap NBS/NACHT domains in active conformation for structural studies. | Sigma-Aldrich, A1388 |
| Malachite Green Phosphate Assay Kit | Colorimetric quantification of inorganic phosphate released in ATPase activity assays. | Thermo Fisher Scientific, 23280 |
| Size Exclusion Chromatography Column (SEC) | High-resolution separation of monomeric vs. oligomeric protein states (e.g., Superdex 200 Increase). | Cytiva, 28990944 |
| Cross-linking Reagent (DSS, BS³) | Stabilizes transient protein-protein interactions for MS analysis of oligomer interfaces. | ProteoChem, c1104 |
| HEK293T NF-κB/IL-1β Reporter Cell Line | Cell-based system for functional validation of NLR mutant activity. | InvivoGen, hek-nfkb) |
| Anti-ASC Apoptosis Speck Monoclonal Antibody | Detects assembled inflammasome specks via immunofluorescence or western blot. | Adipogen, AG-25B-0006 |
Within the broader research thesis comparing NBS (Nucleotide-Binding Site) and NACHT (NAIP, CIITA, HET-E, and TP1) domain architectures, understanding the nucleotide switch mechanism is fundamental. Both domain classes are P-loop NTPases, but their structural implementation and functional outcomes differ significantly. This comparison guide objectively evaluates the performance of the canonical ATP/GTP switch mechanism, using the small G-protein Ras (a classic NBS domain protein) and the innate immune sensor NLRP3 (containing a NACHT domain) as archetypal alternatives.
Performance Comparison: NBS vs. NACHT Domain Nucleotide Switches
| Feature | Classical NBS Domain (e.g., Ras GTPase) | NACHT Domain (e.g., NLRP3 in NLRP3 inflammasome) |
|---|---|---|
| Core Nucleotide | GTP (or GDP) | ATP (or ADP) |
| Primary Functional Output | Binary molecular switch regulating downstream effector binding (e.g., Raf kinase). | Oligomerization trigger for signalosome assembly (e.g., inflammasome). |
| Switch Speed & Regulation | Fast cycle; tightly regulated by GAPs (GTPase-Activating Proteins) and GEFs (Guanine Exchange Factors). | Slow, multi-step process; regulated by NEK7 interaction, post-translational modifications, and cellular homeostasis. |
| Conformational Change | Local changes in Switch I and Switch II loops. | Large-scale, ATP hydrolysis-driven conformational rearrangement promoting WHD (Winged-Helix Domain) displacement and oligomeric ring formation. |
| Key Experimental Readout | FRET between protein domains or with effectors; GTP hydrolysis assays. | ASC Speck Formation (microscopy); IL-1β release (ELISA); in vitro oligomerization (size-exclusion chromatography, SEC-MALS). |
| Drug Targeting Paradigm | Inhibit GTP binding (competitive) or stabilize inactive GDP-state. | Inhibit ATP binding/hydrolysis or stabilize auto-inhibited conformation. |
| Representative KD (Nucleotide) | ~20 pM for GTP (Ras) | ~100 nM for ATP (NLRP3) |
| Hydrolysis Rate (kcat) | ~0.02 min⁻¹ (intrinsic, Ras) | ~0.5 min⁻¹ (intrinsic, NLRP3 NACHT) |
Experimental Protocols for Key Comparisons
1. Protocol: Measuring Nucleotide-Binding Affinity (Surface Plasmon Resonance - SPR)
- Objective: Determine dissociation constant (KD) for ATP/GTP binding to purified NBS/NACHT domains.
- Methodology:
- Immobilize his-tagged protein (e.g., Ras or NLRP3 NACHT domain) on an NTA sensor chip.
- Flow increasing concentrations of ATP or GTP (0.1 µM to 100 µM) in running buffer over the chip.
- Monitor the association and dissociation phases in real-time.
- Fit the resulting sensorgrams to a 1:1 binding model to calculate kinetic rates (kon, koff) and the equilibrium KD.
2. Protocol: Assessing Functional Consequence via Oligomerization (Size-Exclusion Chromatography with Multi-Angle Light Scattering - SEC-MALS)
- Objective: Quantify nucleotide-dependent oligomeric state change.
- Methodology:
- Purify recombinant full-length NLRP3 or Ras protein.
- Incubate protein (2 µM) with 1 mM ATP, ADP, or non-hydrolyzable ATPγS for 30 min at 25°C.
- Inject sample onto an analytical SEC column coupled to MALS and refractive index detectors.
- The MALS detector directly calculates the absolute molecular weight of the eluting species, distinguishing monomeric, dimeric, or higher-order oligomeric states induced by nucleotide binding/hydrolysis.
3. Protocol: Cellular Functional Readout (ASC Speck Quantification)
- Objective: Visualize and quantify NACHT domain-driven signalosome assembly in cells.
- Methodology:
- Seed HEK293T cells stably expressing ASC-GFP into a 96-well imaging plate.
- Transiently transfect with wild-type or ATPase-deficient mutant (KM) NLRP3.
- Stimulate with nigericin (NLRP3 activator) for 1 hour.
- Fix cells and acquire high-content images via automated microscopy.
- Use image analysis software to count distinct, bright ASC-GFP specks per cell, quantifying inflammasome activation efficiency.
Signaling Pathway Visualizations
Diagram Title: Nucleotide Switch Pathways in NBS vs. NACHT Domains
Diagram Title: SEC-MALS Workflow for Oligomerization Analysis
The Scientist's Toolkit: Research Reagent Solutions
| Reagent/Material | Function in Nucleotide Switch Research |
|---|---|
| Non-hydrolyzable Nucleotides (ATPγS, GMP-PNP, GTPγS) | Decouple binding from hydrolysis to isolate the role of each step in conformational change. |
| Fluorescent Nucleotide Analogs (e.g., Mant-GTP, TNP-ATP) | Enable direct spectroscopic measurement (FRET, fluorescence polarization) of nucleotide binding and release kinetics. |
| Size-Exclusion Chromatography with MALS (SEC-MALS) | Gold standard for determining absolute molecular weight and oligomeric state of proteins in solution, post-nucleotide binding. |
| Surface Plasmon Resonance (SPR) Chip (NTA type) | Allows for precise, real-time kinetic analysis of nucleotide-protein interactions using immobilized his-tagged proteins. |
| Baculovirus Expression System | Preferred method for producing high yields of functional, full-length NLRP3 or other large NACHT-domain proteins for in vitro assays. |
| KM (Walker A) Mutant Constructs (e.g., NLRP3 KM M to A) | Critical negative control; abolishes nucleotide binding, confirming observed effects are switch-specific. |
| Heterologous Reconstitution System (e.g., ASC-GFP in HEK293T) | Allows for clean, specific quantification of signalosome assembly (e.g., ASC speck formation) in a cellular context. |
This guide compares the structural and functional performance of NBS (Nucleotide-Binding Site) domain-centric constructs versus NACHT (NAIP, CIITA, HET-E, and TP1) domain-centric constructs within full-length NLR (Nucleotide-binding domain, Leucine-rich Repeat-containing receptor) proteins. The analysis is framed within ongoing thesis research comparing the mechanistic contributions of these core domains to oligomerization and activation.
Performance Comparison: NBS-Centric vs. NACHT-Centric Constructs in Full-Length NLR Studies
Table 1: Comparative Analysis of Domain-Centric Constructs in NLR Oligomerization Studies
| Performance Metric | NBS-Centric Constructs (e.g., NLRC4, APAF-1 models) | NACHT-Centric Constructs (e.g., NLRP3, NLRP1 models) | Supporting Experimental Data (Key References) |
|---|---|---|---|
| Primary Oligomerization Driver | NBS domain-mediated nucleotide exchange & hydrolysis. | NACHT domain-mediated ADP/ATP binding & conformational rearrangement. | Hu et al., Nature (2013) on NLRC4; Tenthorey et al., Science (2017) on NAIP/NLRC4. |
| Activation Trigger Fidelity | Moderate to High. Often requires specific pathogen-derived ligands bound to upstream receptors (e.g., NAIPs). | Variable/Low. Often requires multiple, diverse cellular signals (K+ efflux, ROS, etc.) for full activation. | Sharif et al., Nature (2021) on NLRP3; Sandstrom et al., Science (2019) on NLRP1. |
| In Vitro Reconstitution Efficiency | High. Often forms ordered inflammasome specks with ASC. | Low to Moderate. NLRP3 requires extensive cellular priming and triggering steps. | Dick et al., PNAS (2016); Schmidt & Groscurth, Cell Reports (2022). |
| Structures Solved (Full-length/Active) | Multiple (NLRC4, NAIP/NLRC4, CARD8). | Limited. Major breakthroughs with recent NLRP3 structures in inhibited/active states. | Hochheiser et al., Nature (2022); Andreeva et al., Science (2021). |
| Drug Discovery Tractability | Challenging (target often downstream of initial sensing). | High (NACHT domain is a direct target for small-molecule inhibitors). | Coll et al., Nature (2015) on MCC950 targeting NLRP3. |
Detailed Experimental Protocols
Protocol 1: Size-Exclusion Chromatography with Multi-Angle Light Scattering (SEC-MALS) for Oligomeric State Analysis
- Protein Purification: Express and purify recombinant full-length or truncated NLR protein (NBS or NACHT-centric construct) from insect or mammalian cells.
- Nucleotide Loading: Incubate protein (1-5 mg/mL) with 1 mM ATPγS (non-hydrolyzable analog) or ADP in buffer containing 5 mM MgCl₂ for 30 min on ice.
- Chromatography: Inject 100 µL of sample onto a pre-equilibrated Superose 6 Increase column connected to an FPLC system.
- Detection: The eluent passes through a UV detector (280 nm), a MALS detector, and a refractive index (RI) detector sequentially.
- Analysis: Use the ASTRA or equivalent software to calculate the absolute molecular weight across the elution peak using light scattering and RI data, independent of elution volume standards.
Protocol 2: Crosslinking Coupled to Mass Spectrometry (XL-MS) for Interface Mapping
- Sample Preparation: Purified NLR protein (at ~2 µM) is incubated with nucleotide (ATP or ADP) in a suitable buffer.
- Crosslinking: Add the amine-reactive crosslinker BS³ (bis(sulfosuccinimidyl)suberate) to a final concentration of 0.5-1 mM. Quench the reaction with 50 mM Tris-HCl, pH 7.5, after 30 minutes at room temperature.
- Digestion: Denature the crosslinked sample, reduce disulfides, and alkylate cysteines. Digest with trypsin/Lys-C overnight.
- LC-MS/MS Analysis: Analyze the peptides using liquid chromatography coupled to tandem mass spectrometry (LC-MS/MS) with fragmentation suitable for identifying crosslinked peptides (e.g., HCD or ETD).
- Data Analysis: Process data using dedicated XL-MS software (e.g., xQuest, pLink2) to identify crosslinked residues. Integrate results with structural models.
Pathway and Workflow Visualization
Title: NLR Activation Pathway from Signal to Oligomer
Title: Workflow for NLR Oligomerization Interface Study
The Scientist's Toolkit: Key Research Reagent Solutions
Table 2: Essential Reagents and Materials for NLR Oligomerization Studies
| Reagent/Material | Function & Explanation | Example Product/Catalog |
|---|---|---|
| Non-hydrolyzable ATP Analogs (ATPγS, AMP-PNP) | Essential for trapping NLR domains in active, ATP-bound conformations for structural and biochemical studies. | Sigma Aldrich, A1388 (ATPγS) |
| Homobifunctional Crosslinkers (BS³, DSS) | Capture transient, low-affinity protein-protein interactions at oligomerization interfaces for XL-MS analysis. | Thermo Scientific, 21580 (BS³) |
| Size-Exclusion Chromatography Columns (Superose 6 Increase) | High-resolution separation of monomeric, intermediate, and oligomeric states of NLR proteins. | Cytiva, 29091596 |
| Anti-NLR Monoclonal Antibodies (e.g., anti-NLRP3, anti-NLRC4) | Critical for immunoprecipitation (IP), Western blot detection, and cellular localization studies. | Adipogen, AG-20B-0014 (NLRP3) |
| Cryo-EM Grids (Quantifoil R1.2/1.3 Au) | Support film for flash-freezing purified NLR oligomers for high-resolution structure determination. | Electron Microscopy Sciences, Q350AR13A |
| Small Molecule Inhibitors (MCC950, CRID3) | Tool compounds to probe NACHT domain function and validate it as a drug target in cellular assays. | Cayman Chemical, 24108 (MCC950) |
From Structure to Function: Techniques and Therapeutic Targeting Strategies
This guide compares two pivotal techniques for high-resolution structural biology—X-ray crystallography and cryo-electron microscopy (cryo-EM)—within the context of research comparing NBS (Nucleotide-Binding Site) and NACHT (NAIP, CIITA, HET-E, and TP1) domains. These domains are critical components of innate immune signaling complexes like inflammasomes. The choice of structural method directly impacts the resolution, conformational insights, and drug targeting strategies for these complexes.
Comparative Performance Analysis
The following table summarizes the core performance characteristics of both techniques based on recent experimental data and technological advancements.
Table 1: Performance Comparison of X-ray Crystallography vs. Cryo-EM for NBS/NACHT Domain Studies
| Feature | X-ray Crystallography | Cryo-EM (Single-Particle Analysis) |
|---|---|---|
| Typical Resolution Range | 1.0 – 3.0 Å | 1.8 – 4.0 Å (for complexes >150 kDa) |
| Sample Requirement | Highly ordered, large single crystals (nL-μL volume). | Purified complex in solution (μL volume, ~0.5–3 mg/mL). |
| Molecular Size Suitability | Single domains to large complexes, if crystallizable. | Best for >50 kDa; ideal for large, flexible complexes (>150 kDa). |
| Key Advantage | Atomic-level detail; precise ligand/atom positioning. | Captures conformational heterogeneity; no crystallization needed. |
| Major Limitation | Crystal packing artifacts; difficulty with flexible proteins. | Lower absolute resolution for small targets; requires high-end equipment. |
| Data Collection Time | Hours to days (synchrotron). | Days to weeks (dependent on sample and target resolution). |
| Sample Preparation Workflow | Cloning → Expression → Purification → Crystallization → Soaking → Harvesting. | Cloning → Expression → Purification → Vitrification (flash-freezing). |
| Typical Throughput | Medium to High (for crystallizable targets). | Low to Medium (but rapidly improving). |
| Key for NBS/NACHT Research | Excellent for apo or inhibitor-bound domain structures (e.g., NLRC4 NBD at 1.9 Å). | Essential for full-length oligomeric assemblies (e.g., NLRP3 inflammasome at 3.6 Å). |
Experimental Protocols for Domain Comparison
Protocol 1: X-ray Crystallography of an NBS/NACHT Domain with Bound Inhibitor
Objective: Determine the atomic structure of a recombinant NACHT domain in complex with a small-molecule inhibitor to guide drug design.
- Protein Production: Express His-tagged human NLRP3 NACHT domain (residues 226-640) in E. coli BL21(DE3). Purify via Ni-NTA and size-exclusion chromatography (SEC) in 20 mM HEPES pH 7.5, 150 mM NaCl.
- Crystallization: Use sitting-drop vapor diffusion. Mix 100 nL of protein (10 mg/mL with 2 mM inhibitor) with 100 nL of reservoir solution (0.1 M Tris pH 8.5, 25% w/v PEG 3350). Incubate at 20°C.
- Soaking & Harvesting: After crystal growth (3-7 days), transfer crystals to reservoir solution supplemented with 20% glycerol as cryoprotectant. Flash-cool in liquid nitrogen.
- Data Collection & Processing: Collect 360° of data at a synchrotron (e.g., Diamond Light Source). Index, integrate, and scale using XDS and AIMLESS.
- Phasing & Refinement: Solve structure by molecular replacement (MR) using a homologous NBD domain (PDB: 6NPY) as a search model. Refine with PHENIX.refine and Coot.
Protocol 2: Cryo-EM Analysis of a Full-Length NLR Oligomer
Objective: Determine the structure of a full-length NBS/NACHT-containing protein (e.g., NLRC4) in its activated, oligomeric state.
- Sample Preparation: Express and purify full-length protein. Incubate with activating ligand (e.g., flagellin:NAIP5 complex). Apply 3 μL of sample (0.8 mg/mL) to a glow-discharged Quantifoil R1.2/1.3 Au 300 mesh grid.
- Vitrification: Blot for 3-4 seconds at 100% humidity, 4°C, and plunge-freeze in liquid ethane using a Vitrobot Mark IV.
- Data Acquisition: Collect 5,000 micrograph movies (40 frames/movie) on a 300 keV Titan Krios with a K3 direct electron detector. Use a nominal magnification of 105,000x (0.826 Å/pixel) with a total dose of 50 e⁻/Ų.
- Image Processing: Motion-correct with MotionCor2, estimate CTF with CTFFIND-4. Pick ~1 million particles using cryoSPARC blob picker. Perform 2D classification to select clean particles.
- 3D Reconstruction: Generate an ab initio model, followed by heterogeneous refinement to separate conformational states. Refine the selected subset using non-uniform refinement and local refinement to achieve a final resolution of 3.2 Å (based on gold-standard FSC 0.143 criterion).
Title: Decision Workflow for Structural Biology Method Selection
Title: NLR Signaling Pathway and Domain Involvement
The Scientist's Toolkit: Research Reagent Solutions
Table 2: Essential Reagents and Materials for NBS/NACHT Structural Studies
| Item | Function | Example/Catalog Note |
|---|---|---|
| SEC Column | Final polishing step to obtain monodisperse, aggregation-free protein for crystallography or cryo-EM. | Superdex 200 Increase 10/300 GL (Cytiva). |
| Crystallization Screen Kits | Initial sparse-matrix screening to identify crystallization conditions for domains. | JC SG I & II (Molecular Dimensions), MemGold2 (for membrane-associated). |
| Cryo-EM Grids | Supports the thin, vitrified ice layer required for high-resolution imaging. | Quantifoil R1.2/1.3 Au 300 mesh (for most soluble complexes). |
| Cryoprotectant | Prevents ice crystal formation during flash-cooling of crystals for X-ray data collection. | Glycerol, Ethylene Glycol, Paratone-N oil. |
| Negative Stain Reagent | Rapid assessment of protein monodispersity and complex formation for cryo-EM. | 2% Uranyl Acetate solution. |
| ATPγS (non-hydrolyzable) | Stabilizes NBS/NACHT domains in a specific nucleotide-bound state for structural studies. | Roche, 11162306001. |
| Inhibitor Compounds | For co-crystallization or cryo-EM studies to elucidate drug binding sites (e.g., NLRP3 inhibitors). | MCC950, CY-09 (available from Selleckchem, Tocris). |
| Detergent | Essential for solubilizing and studying full-length NLRs that may be membrane-associated. | Lauryl Maltose Neopentyl Glycol (LMNG), Glycol-Diosgenin (GDN). |
Within the ongoing research comparing the structural dynamics of the Nucleotide-Binding Site (NBS) and NACHT domains in innate immune signaling proteins, two techniques are paramount: Hydrogen-Deuterium Exchange Mass Spectrometry (HDX-MS) and Molecular Dynamics (MD) simulations. This guide compares these complementary approaches for probing protein dynamics, providing experimental data and protocols relevant to domain-level analysis.
Comparison of HDX-MS and MD Simulations
Table 1: Core Performance Comparison
| Feature | Hydrogen-Deuterium Exchange MS (HDX-MS) | Molecular Dynamics (MD) Simulations |
|---|---|---|
| Temporal Resolution | Millisecond to hour timescale (experimental measurement) | Femtosecond to millisecond (simulation dependent) |
| Spatial Resolution | Peptide-level (5-20 amino acids); potential single-residue with optimization | Atomic-level (every atom in the system) |
| Experimental Basis | Empirical measurement of deuterium incorporation from solvent | Computational physics based on empirical force fields |
| Primary Output | Deuteration levels reflecting solvent accessibility & hydrogen bonding | Trajectory of atomic coordinates over time; energy calculations |
| Key Strength | Direct experimental readout of dynamics in solution state; sensitive to conformational populations. | Atomic detail of motion pathways; provides causative mechanistic insights. |
| Key Limitation | Indirect inference of dynamics; peptide-level ambiguity. | Timescale limits; force field inaccuracies can bias results. |
| Sample Consumption | Low pmol to nmol protein | None (in silico) |
| Typical Cost per Sample/Run | High ($500-$1500 per condition) | Very High (Extensive CPU/GPU computational resources) |
Table 2: Applicability to NBS vs. NACHT Domain Research
| Analysis Goal | HDX-MS Suitability | MD Simulations Suitability |
|---|---|---|
| Mapping ligand/nucleotide binding interfaces | High (detects protection/deprotection) | High (direct visualization of interactions) |
| Comparing global stability of isolated domains | High (differences in deuteration kinetics) | Medium (requires careful equilibration) |
| Resolving discrete conformational states | Medium (infers populations) | High (can simulate transitions with enhanced sampling) |
| Probing allosteric pathways | Medium (identifies allosteric sites) | High (can trace signal propagation) |
| Validating computational models | Essential as experimental benchmark | Dependent on experimental validation |
Experimental Protocols
Protocol 1: HDX-MS for Domain-Level Comparison
Objective: To compare solvent accessibility and dynamics of purified NBS and NACHT domains in their apo and nucleotide-bound states.
- Sample Preparation: Purify recombinant NBS and NACHT domains (e.g., from NLR proteins) to >95% homogeneity in 20 mM HEPES, 150 mM NaCl, pH 7.4.
- Deuterium Labeling: Dilute protein (10 µM) 1:10 into D₂O-based labeling buffer. Incubate at 25°C for 10 time points (e.g., 10s, 1m, 10m, 1h).
- Quenching: Lower pH to 2.5 with pre-chilled quench buffer (0.1% formic acid, 2M guanidine-HCl) and temperature to 0°C.
- Digestion & Separation: Pass quenched sample through an immobilized pepsin column (50 µL, 2°C). Trap peptides on a C8 trap column.
- Mass Analysis: Elute peptides onto a C18 UPLC column (gradient: 8-40% acetonitrile in 0.1% formic acid over 7 min) coupled to a high-resolution mass spectrometer (e.g., Q-TOF).
- Data Processing: Use dedicated software (e.g., HDExaminer, DynamX) to identify peptides, correct for back-exchange, and calculate deuterium uptake for each time point.
Protocol 2: Microsecond MD Simulation of Domain Dynamics
Objective: To simulate the atomic-level dynamics of NBS and NACHT domains to observe nucleotide-binding pocket rearrangements.
- System Setup: Use a high-resolution crystal structure of the target domain. Add missing loops with modeling software (e.g., MODELLER). Parameterize ATP/dATP using tools like CGenFF.
- Solvation & Neutralization: Solvate the protein-ligand system in a TIP3P water box with 10 Å padding. Add ions to neutralize charge and reach 150 mM NaCl.
- Energy Minimization: Perform 5000 steps of steepest descent minimization to remove steric clashes.
- Equilibration: Conduct a multi-step equilibration in NVT and NPT ensembles (300 K, 1 bar) using harmonic restraints on protein heavy atoms, gradually released over 1 ns.
- Production Run: Run an unrestrained, explicit solvent MD simulation for 1-5 µs using a GPU-accelerated package (e.g., AMBER, GROMACS, NAMD). Use a 2 fs timestep.
- Analysis: Calculate root-mean-square deviation (RMSD), fluctuation (RMSF), radius of gyration, inter-residue distances, and hydrogen bond lifetimes from the trajectory using MDAnalysis or VMD.
Visualizations
Title: HDX-MS Experimental Workflow
Title: NBS to NACHT Domain Signaling Relationship
The Scientist's Toolkit: Research Reagent Solutions
Table 3: Essential Materials for HDX-MS & MD Studies
| Item | Function in Research | Example/Note |
|---|---|---|
| Ultra-pure Recombinant Protein | Subject of dynamics analysis; requires high purity and correct folding for both techniques. | NBS/NACHT domains expressed with tags (e.g., His-SUMO) for purification. |
| Deuterium Oxide (D₂O) >99.9% | Labeling reagent for HDX-MS; source of deuterons exchanged onto protein backbone. | Essential for HDX; isotopic purity critical for accurate measurements. |
| Immobilized Pepsin Column | Provides rapid, reproducible digestion under quenching conditions (low pH, 0°C) for HDX-MS. | Minimizes back-exchange during digestion step. |
| UPLC System with Tray Chilled to 0°C | Separates peptides prior to MS analysis while minimizing back-exchange. | Temperature control is non-negotiable for HDX reproducibility. |
| High-Resolution Mass Spectrometer (Q-TOF or Orbitrap) | Accurately measures mass shifts due to deuterium incorporation at peptide level. | Mass accuracy and resolution directly determine data quality. |
| Molecular Dynamics Software Suite (e.g., GROMACS/AMBER) | Performs the numerical integration of Newton's equations for all atoms in the simulated system. | Force field choice (CHARMM36, AMBER ff19SB) is critical. |
| High-Performance Computing (HPC) Cluster or GPU Workstation | Provides the computational power required for microsecond-scale simulations. | Multiple GPUs dramatically accelerate production runs. |
| Visualization & Analysis Software (e.g., VMD, PyMOL, MDAnalysis) | Used to visualize MD trajectories, calculate metrics, and generate structural insights. | Key for interpreting simulation data and comparing to HDX results. |
This guide compares methodologies and reagent solutions for functional assays measuring nucleotide hydrolysis and oligomerization, key activities of NBS and NACHT domain-containing proteins. The data is contextualized within structural comparison research of these nucleotide-binding domains, which are central to inflammasome and cell death signaling platforms.
Comparison of Assay Platforms for Nucleotide Hydrolysis
Table 1: Quantitative Comparison of Nucleotide Hydrolysis Assay Performance
| Assay Type | Measured Parameter | Sensitivity (Typical) | Throughput | Key Advantage | Key Limitation | Suitability for NBS/NACHT Domains |
|---|---|---|---|---|---|---|
| Malachite Green Phosphate Release | Inorganic Phosphate (Pi) | ~1-10 nmol | Medium | Direct, cost-effective; measures steady-state kinetics. | Interference from buffers/agents; endpoint. | High - Directly measures ADP/ATPase activity. |
| Coupled Enzymatic (NADH/NADPH) | ATP Consumption / ADP Production | ~0.1-1 nmol | High (kinetic) | Continuous real-time measurement. | Complex system; requires auxiliary enzymes. | Medium - Sensitive but system complexity may affect oligomer. |
| Radiolabeled [γ-³²P]ATP TLC | Released ³²Pi | ~1-10 pmol | Low | Most sensitive; direct. | Radioactive hazard; low throughput. | High - Gold standard for low-activity proteins. |
| Fluorescent ATP Analog (Mant-ATP) | Hydrolysis via FRET/Anisotropy | ~10 nM | Medium | Can monitor binding & hydrolysis; kinetic. | Probe may alter kinetics; equipment cost. | Medium-High - Useful for conformational studies. |
| Thin-Layer Chromatography (non-radioactive) | ADP/ATP Ratio | ~0.1-1 nmol | Low | Avoids radioactivity. | Less sensitive than radioactive method. | Medium - Good for qualitative confirmation. |
Comparison of Assay Platforms for Oligomerization
Table 2: Quantitative Comparison of Oligomerization Assay Performance
| Assay Type | Measured Parameter | Resolution | Sample Condition | Throughput | Key Advantage | Key Limitation |
|---|---|---|---|---|---|---|
| Size Exclusion Chromatography (SEC) + MALS | Absolute Molecular Weight | ~1-5% | Native, solution | Low | Absolute size; solution state. | Low concentration; slow; no kinetics. |
| Analytical Ultracentrifugation (AUC) | Sedimentation Coefficient | ~1-3% | Native, solution | Low | High precision; heterogeneous samples. | Technically demanding; very low throughput. |
| Native PAGE / Blue Native PAGE | Oligomeric State | ~10-50 kDa | Native, gel | Medium | Simple; visual; detects intermediates. | Semi-quantitative; gel artifacts possible. |
| Crosslinking + SDS-PAGE | Proximity / Oligomer | N/A | Chemical fixation | Medium | Snapshots of interactions; uses standard lab equipment. | Potential for non-specific crosslinking. |
| Single-Molecule Fluorescence (smFRET) | Conformational Dynamics | Single Molecule | Solution, labeled | Low | Heterogeneity; dynamics on ms timescale. | Requires extensive labeling/optimization. |
Experimental Protocols
Protocol 1: Malachite Green Phosphate Release Assay (Steady-State Hydrolysis)
Principle: Malachite green molybdate forms a complex with free inorganic phosphate, yielding a colorimetric signal at 620-660 nm.
- Reaction Setup: In a 96-well plate, mix purified NBS/NACHT domain protein (0.5-5 µM) in assay buffer (20 mM HEPES pH 7.5, 150 mM NaCl, 5 mM MgCl₂). Initiate reaction by adding ATP (typically 500 µM final concentration).
- Incubation: Incubate at 30°C for desired timepoints (e.g., 0, 5, 15, 30, 60 min).
- Detection: Stop reaction by adding Malachite Green reagent (0.045% malachite green, 4.2% ammonium molybdate in 4M HCl, with 0.5% Tween-20). Incubate 10-15 min at room temperature.
- Measurement: Read absorbance at 620 nm. Use a KH₂PO₄ standard curve (0-100 nmol Pi) to calculate phosphate released.
- Controls: Include no-enzyme and no-ATP controls. Calculate specific activity as nmol Pi released/min/µg protein.
Protocol 2: Size Exclusion Chromatography with Multi-Angle Light Scattering (SEC-MALS) for Oligomerization
Principle: Separates species by hydrodynamic volume and directly determines absolute molecular weight independent of elution time.
- Sample Preparation: Purify protein in SEC buffer (e.g., 25 mM Tris pH 8.0, 150 mM NaCl, 2 mM MgCl₂, 1 mM TCEP). Centrifuge at 15,000 x g for 10 min before injection. Pre-incubate with 1 mM ADP or ATPγS (non-hydrolysable analog) for 30 min on ice.
- Chromatography: Inject 50-100 µg of protein onto a pre-equilibrated SEC column (e.g., Superdex 200 Increase 10/300 GL) at 0.5 mL/min.
- Online Detection: The eluent passes sequentially through a UV detector (280 nm), a MALS detector, and a refractive index (RI) detector.
- Data Analysis: Use the MALS and RI signals with the protein's specific refractive index increment (dn/dc, typically ~0.185 mL/g for proteins) to calculate absolute molecular weight across the elution peak using dedicated software (e.g., Astra). A monodisperse monomer will show a flat MW across the peak; oligomerization is indicated by a higher, stable MW peak.
Protocol 3: Crosslinking Assay for Oligomeric Complexes
Principle: Chemical crosslinkers stabilize transient protein-protein interactions for visualization by SDS-PAGE.
- Reaction: Incubate purified protein (2-5 µM) with nucleotide (1 mM ATP, ADP, or ATPγS) in crosslinking buffer (20 mM HEPES pH 7.5, 100 mM NaCl, 5 mM MgCl₂) for 15 min at 25°C.
- Crosslinking: Add a homo-bifunctional amine-reactive crosslinker (e.g., BS³ or glutaraldehyde) at an optimized concentration (e.g., 0.5-2 mM for BS³). Incubate for 30 min on ice.
- Quenching: Stop the reaction by adding Tris-HCl pH 8.0 to a final concentration of 50 mM and incubate for 15 min.
- Analysis: Analyze samples by SDS-PAGE (4-12% Bis-Tris gradient gel) under non-reducing conditions (omit DTT/β-mercaptoethanol). Visualize using Coomassie or silver stain. Compare lanes with/without nucleotide and with/without crosslinker.
Visualization of Pathways and Workflows
Title: Workflow for In Vitro Nucleotide Hydrolysis Assays
Title: Nucleotide-Driven Oligomerization Cycle of NBS/NACHT Domains
Title: Assay Selection Logic for NBS/NACHT Domain Functional Analysis
The Scientist's Toolkit: Key Research Reagent Solutions
Table 3: Essential Reagents and Materials for Functional Assays
| Item | Function & Application | Key Considerations for NBS/NACHT Domains |
|---|---|---|
| High-Purity Nucleotides (ATP, ADP, ATPγS, GTP) | Substrates and ligands to induce hydrolysis and oligomerization. | Use >99% purity, pH-adjusted stocks. ATPγS is crucial as a non-hydrolysable control for oligomerization. |
| Malachite Green Phosphate Assay Kit (e.g., Sigma-Aldrich MAK307) | Reliable, standardized colorimetric detection of inorganic phosphate. | Ideal for initial activity screening. Ensure buffer compatibility (no EDTA, low free Mg²⁺ interference). |
| Homobifunctional Crosslinkers (e.g., BS³, DSS, Glutaraldehyde) | Stabilize protein-protein interactions in oligomeric complexes for PAGE analysis. | Amine-reactive (Lysine-targeting) are common. Titrate concentration carefully to minimize non-specific crosslinking. |
| Size Exclusion Chromatography Columns (e.g., Cytiva Superdex 200 Increase) | High-resolution separation of monomers, oligomers, and aggregates by size. | The "Increase" series offers better resolution and shorter run times. Pre-calibrate with native standards. |
| MALS Detector (e.g., Wyatt miniDAWN) | Coupled with SEC or DLS to determine absolute molecular weight and size. | Essential for distinguishing nucleotide-induced oligomers from inert aggregates. Requires precise dn/dc and UV extinction coefficient. |
| Fluorescent Nucleotide Analogs (e.g., Mant-ATP, N⁶-etheno-ATP) | Monitor nucleotide binding and hydrolysis via fluorescence polarization (FP) or FRET. | Useful for measuring Kd and kinetics without separation. Mant-group is sensitive to microenvironment changes. |
| Stabilization Buffers (e.g., with Mg²⁺, Reducing Agents) | Maintain protein stability and activity during often-lengthy assays. | MgCl₂ (2-5 mM) is essential. Include reducing agents (TCEP/DTT) for cysteine-rich NACHT domains. Avoid phosphate buffers for hydrolysis assays. |
| Precision Microplate Readers (e.g., Tecan Spark, BMG CLARIOstar) | For kinetic and endpoint readings in 96-/384-well format for hydrolysis assays. | Temperature control and rapid kinetic reading are critical for accurate initial rate measurements. |
Within the broader thesis on NBS (Nucleotide-Binding Site) domain versus NACHT domain structural comparisons, this guide focuses on therapeutic inhibition via the nucleotide-binding cleft. This conserved structural feature, present in NBS-containing proteins like NLRs (NOD-like receptors) and ATP-binding kinases, is a high-value target for rational drug design. This guide compares the performance of representative small-molecule inhibitors targeting this cleft across different protein classes.
Structural Comparison: NBS vs. NACHT Domain Clefts
The NBS domain, characterized by conserved Walker A and B motifs for ATP binding, is a subset of the larger NACHT domain family found in NLRs. The NACHT domain contains additional subdomains but shares a core nucleotide-binding pocket. Inhibition strategies differ based on cleft architecture and dynamics.
Table 1: Structural Features of Target Clefts
| Feature | Classic NBS Domain (e.g., Kinase) | NACHT Domain (e.g., NLRP3) |
|---|---|---|
| Primary Cofactor | ATP/Mg²⁺ | ATP/dATP, Mg²⁺ |
| Key Motifs | Walker A (P-loop), Walker B | Walker A, Walker B, Sensor 1, WHD |
| Cleft Conformation | Typically between N-lobe & C-lobe | Within a single multi-domain unit |
| Inhibition Mechanism | Competitive ATP-mimetics, Allosteric | Mostly allosteric stabilization of inactive state |
| Representative Inhibitor | Staurosporine (kinase) | MCC950 (NLRP3) |
Comparative Performance of Select Inhibitors
This section compares experimental data for benchmark inhibitors targeting nucleotide-binding clefts in different protein systems.
Table 2: Inhibitor Performance Comparison
| Inhibitor (Target) | IC₅₀/EC₅₀ | Binding Mode (Experimentally Determined) | Selectivity Profile | Key Cellular Readout |
|---|---|---|---|---|
| MCC950 (NLRP3 NACHT) | ~7.5 nM (cell-free ATPase) | Allosteric, binds Walker B region | Highly specific for NLRP3; no inhibition of other NLRs or kinases tested | Inhibition of IL-1β secretion (↓95% at 100 nM) |
| CY-09 (NLRP3 NACHT) | ~1.1 µM (ATPase assay) | Direct ATP-competitive | Binds NLRP3 & NLRC4; some off-target kinase activity | Inhibition of ASC speck formation (↓80% at 10 µM) |
| Staurosporine (Broad Kinase NBS) | Low nM range (varies by kinase) | ATP-competitive, H-bonds to hinge region | Poor; inhibits many PKC, PKA, etc. | Pan-kinase inhibition; induces apoptosis |
| OLT1177 (NLRP3 NACHT) | ~6 µM (in cellulo) | Allosteric, likely affects ATP binding | Specific for NLRP3; no effect on AIM2 or NLRC4 inflammasomes | Reduction of caspase-1 activity (↓70% at 20 µM) |
| MNS (NLRC4 NACHT) | ~3.2 µM (SPR KD) | Allosteric, stabilizes closed conformation | Selective over NLRP3 & AIM2 | Inhibition of NAIP/NLRC4 inflammasome activation |
Detailed Experimental Protocols
Protocol 1: Recombinant NACHT Domain ATPase Assay (Fluorometric)
Purpose: Quantify inhibitor potency by measuring inhibition of ATP hydrolysis. Methodology:
- Protein Purification: Express and purify recombinant human NACHT domain (e.g., NLRP3 residues 226-548) with a GST tag via baculovirus/Sf9 system.
- Assay Setup: In a 96-well plate, mix 50 nM protein with inhibitor (dose range) in assay buffer (20 mM HEPES pH 7.5, 150 mM NaCl, 10 mM MgCl₂).
- Reaction Initiation: Add ATP to a final concentration of 1 mM. Include a no-ATP control.
- Detection: Use a commercial phosphate detection kit (e.g., EnzChek Phosphate Assay Kit). Monitor fluorescence (ex/em ~360/460 nm) kinetically for 60 minutes at 30°C.
- Analysis: Calculate reaction rates. Fit inhibitor dose-response data to a four-parameter logistic model to determine IC₅₀.
Protocol 2: Cellular Inflammasome Inhibition Assay (THP-1 Macrophages)
Purpose: Assess functional inhibitor efficacy in a cell-based system. Methodology:
- Cell Differentiation: Differentiate THP-1 monocytes into macrophages using 100 nM PMA for 48 hours, then rest for 24 hours in serum-free media.
- Priming & Inhibition: Prime cells with 100 ng/mL LPS for 3 hours. Add test inhibitor 30 minutes prior to activation.
- Inflammasome Activation: Activate NLRP3 with 5 mM ATP (for 30 min) or nigericin (10 µM, for 1 hour).
- Readout: Collect supernatant. Quantify IL-1β release via ELISA. Measure cell viability in parallel using MTT or LDH assay to confirm cytotoxicity is not the cause of inhibition.
Diagram: NLRP3 Inhibition & Signaling Pathway
Title: NLRP3 Activation Pathway & Inhibitor Site
Diagram: Experimental Workflow for Inhibitor Screening
Title: Inhibitor Screening & Validation Pipeline
The Scientist's Toolkit: Research Reagent Solutions
Table 3: Essential Reagents for Nucleotide-Cleft Inhibition Studies
| Reagent / Material | Function in Research | Example / Vendor |
|---|---|---|
| Recombinant NACHT/NBS Domain Proteins | Structural & biophysical assays (SPR, ITC, crystallography). | MyBioSource, Abcam, in-house baculovirus expression. |
| Fluorometric ATPase Assay Kit | High-throughput measurement of ATP hydrolysis inhibition. | EnzChek Phosphate Assay Kit (Thermo Fisher). |
| Caspase-1 Activity Assay | Functional cellular readout for inflammasome inhibition. | FAM-FLICA Caspase-1 Assay (ImmunoChemistry). |
| IL-1β ELISA Kit | Gold-standard for quantifying inflammasome inhibition in cell media. | Human IL-1β ELISA Kit (R&D Systems). |
| Selectivity Kinase Panel | Profiling off-target effects against NBS-containing kinases. | ScanSelect Kinase Panel (Eurofins). |
| Cryo-EM Grids | For high-resolution structure determination of inhibitor complexes. | Quantifoil R1.2/1.3 Au 300 mesh. |
| SPR Chips (CM5) | Surface Plasmon Resonance for measuring binding kinetics (KD, kon/koff). | Series S Sensor Chip CM5 (Cytiva). |
Within the broader thesis of NBS domain versus NACHT domain structural comparison, this guide analyzes the NLRP3 inflammasome as a prime case study. Cryopyrin-Associated Periodic Syndromes (CAPS) are driven by gain-of-function mutations in the NLRP3 gene, which encodes the protein cryopyrin. The therapeutic targeting of this protein highlights the functional importance of its nucleotide-binding domains. The NBS (Nucleotide-Binding Site) domain, often used interchangeably with the broader NACHT domain (NAIP, CIITA, HET-E, and TP1) in NLR literature, is the central ATPase module required for oligomerization and inflammasome activation. This guide compares experimental strategies and drug performance targeting these domains.
Comparative Analysis of Domain-Targeting Therapeutics
Table 1: Comparison of NBS/NACHT-Targeting Agents in CAPS
| Therapeutic (Example) | Target Domain/Mechanism | Development Stage | Key Experimental Outcome (IC50/Kd) | Primary Experimental Method |
|---|---|---|---|---|
| MCC950/CRID3 | NLRP3 NACHT domain (ATP hydrolysis inhibition) | Clinical (Discontinued/Repurposing) | IC50 ~8 nM (inhibition of IL-1β release in human monocytes) | LPS/ATP-induced IL-1β release assay |
| OLT1177 (Dapansutrile) | NLRP3 NACHT domain (ATPase inhibition) | Phase II | IC50 ~1-6 μM (inhibition of ATPase activity) | Recombinant NLRP3 ATPase activity assay |
| Biologicals (Canakinumab) | IL-1β (Downstream cytokine) | Approved (Anti-IL-1β mAb) | Kd ~40 pM (binding to human IL-1β) | Surface Plasmon Resonance (SPR) |
| Colchicine | Microtubule dynamics (indirect NLRP3 inhibition) | Approved (Other indications) | N/A (non-specific) | ASC speck formation microscopy |
Detailed Experimental Protocols
Protocol 1:In VitroNLRP3 ATPase Activity Assay
Purpose: To directly measure the inhibitory effect of a compound (e.g., OLT1177) on the NACHT domain's ATP hydrolysis function. Methodology:
- Protein: Purify recombinant human NLRP3 NACHT domain protein (aa 224-575).
- Reaction: In a 96-well plate, mix protein (1-5 μg) with test compound in reaction buffer (20 mM HEPES, 150 mM NaCl, 5 mM MgCl2, pH 7.5).
- Initiation: Start the reaction by adding ATP (1 mM final concentration). Incubate at 30°C for 60 min.
- Detection: Use a colorimetric ATPase/GTPase assay kit. The released inorganic phosphate (Pi) forms a complex with molybdate dye, measured at 650 nm.
- Analysis: Calculate % inhibition and IC50 relative to DMSO control.
Protocol 2: Cell-Based IL-1β Release Assay
Purpose: To assess functional inhibition of the full-length NLRP3 inflammasome in primary cells. Methodology:
- Cell Preparation: Isolate human CD14+ monocytes from PBMCs using magnetic beads.
- Priming: Seed cells and prime with ultrapure LPS (100 ng/mL) for 3 hours.
- Pre-treatment: Add serial dilutions of test compound (e.g., MCC950) 30 min before activation.
- Activation: Activate NLRP3 with Nigericin (5 μM) or ATP (5 mM) for 1 hour.
- Measurement: Collect supernatant. Quantify mature IL-1β via ELISA.
- Analysis: Normalize data to Nigericin-only control (100% activation) to determine IC50.
Signaling Pathway and Experimental Workflow
Diagram 1: NLRP3 inflammasome activation and therapeutic inhibition.
Diagram 2: Workflow for cell-based NLRP3 inhibition assay.
The Scientist's Toolkit: Key Research Reagent Solutions
Table 2: Essential Reagents for NBS/NACHT Domain Research
| Reagent/Solution | Function in Research | Example/Catalog |
|---|---|---|
| Recombinant NLRP3 NACHT Domain Protein | Direct in vitro ATPase assays and structural studies (X-ray crystallography). | Recombinant human NLRP3 (224-575) with His-tag. |
| LPS (Ultrapure, from E. coli) | Toll-like receptor agonist for "priming" signal (NF-κB-dependent NLRP3 and pro-IL-1β upregulation). | InvivoGen tlrl-3pelps or similar. |
| Nigericin (K+ Ionophore) | Potent and standard NLRP3 activator for in vitro assays. | Sigma-Aldrich N7143. |
| ATP (disodium salt) | P2X7 receptor agonist and DAMP for NLRP3 activation; also substrate for ATPase assays. | Sigma-Aldrich A2383. |
| Anti-IL-1β ELISA Kit | Gold-standard for quantifying functional inflammasome output in cell supernatants. | R&D Systems DY201 or equivalent. |
| Cryopyrinopathy-Associated NLRP3 Mutants | Plasmid constructs expressing CAPS mutants (e.g., R260W, D303N) for mechanistic studies. | Addgene vectors #75115, #75116. |
| ASC Speck Formation Assay Kit | Microscopy-based assay to visualize inflammasome oligomerization. | MBL International CY-8000. |
Navigating Experimental Challenges in NLR Domain Biochemistry and Biophysics
This guide, framed within a thesis comparing NLR NBS and NACHT domain structures, objectively compares the performance of mammalian versus insect cell systems for expressing these challenging, aggregation-prone domains. Supporting experimental data is derived from recent studies on human NLRP3 and NAIP domains.
Performance Comparison: Mammalian vs. Insect Cell Expression
Table 1: Expression Yield and Sample Quality for NBS/NACHT Domains
| Parameter | HEK293F (Mammalian) | Sf9 (Insect, Baculovirus) | E. coli (Prokaryotic, Reference) |
|---|---|---|---|
| Typical Yield (mg/L) | 2 - 5 | 5 - 15 | 20 - 50 (mostly insoluble) |
| Solubility | >90% | >80% | <10% (without optimization) |
| Sample Monodispersity (SEC-MALS) | High (PDI < 15%) | Moderate to High (PDI 15-25%) | Very Low (aggregated) |
| Post-Translational Modifications | Native-like (human) | Complex glycosylation | None |
| Time to Purified Protein | 7-10 days | 10-14 days | 3-5 days |
| Key Advantage | Optimal folding & stability for human domains | Higher yield for complex domains | Speed & cost |
| Key Obstacle for NLR Domains | Cost, scalability | Non-native PTMs may affect studies | Improper folding, insolubility |
Key Experimental Finding: For the NLRP3 NACHT domain, expression in HEK293F cells with a C-terminal GFP-8xHis tag yielded 3.2 mg/L of monodisperse protein suitable for crystallization. Parallel expression in Sf9 cells yielded 12 mg/L, but a portion displayed aggregation during size-exclusion chromatography (SEC). The E. coli expressed construct formed inclusion bodies.
Detailed Experimental Protocols
Protocol 1: Transient Expression in HEK293F Cells
- Construct Cloning: Clone codon-optimized NBS or NACHT domain (e.g., NLRP3 residues 200-500) into a mammalian vector (e.g., pTT5) containing an N-terminal secretion signal and a C-terminal GFP-8xHis tag.
- Transfection: Cultivate HEK293F cells in FreeStyle 293 Expression Medium at 1.2 x 10^6 cells/mL. Transfect using PEI MAX (1:3 DNA:PEI ratio). Add valproic acid to 3.3 mM post-transfection to enhance expression.
- Harvest: 72 hours post-transfection, centrifuge culture at 4,000 x g for 30 min. Filter supernatant through a 0.22 µm filter.
- Purification: Load supernatant onto a Ni-NTA column. Wash with 20 mM HEPES pH 7.5, 300 mM NaCl, 25 mM Imidazole. Elute with 300 mM Imidazole. Incubate eluate with HRV-3C protease overnight at 4°C to remove tag.
- Final Polish: Perform SEC on a Superdex 200 Increase column in 20 mM HEPES pH 7.5, 150 mM NaCl, 1 mM TCEP. Analyze fractions by SDS-PAGE and SEC-MALS.
Protocol 2: Baculovirus-Driven Expression in Sf9 Cells
- Bacmid Generation: Clone domain into pFastBac1 with an N-terminal 6xHis-SUMO tag. Transform DH10Bac E. coli for bacmid generation.
- Virus Generation: Transfect Sf9 cells (cultured in ESF 921 medium at 27°C) with Cellfectin II and bacmid DNA to generate P1 virus. Amplify to high-titer P3 virus.
- Protein Expression: Infect Sf9 cells at 2.0 x 10^6 cells/mL with P3 virus at an MOI of 2-5. Harvest cells 72 hours post-infection by centrifugation.
- Lysis & Purification: Lyse cell pellet by sonication in Lysis Buffer (50 mM Tris pH 8.0, 300 mM NaCl, 10% glycerol, 1 mM TCEP, protease inhibitors). Clarify lysate. Purify over Ni-NTA as in Protocol 1.
- Tag Cleavage & SEC: Cleave with SUMO protease overnight. Pass over Ni-NTA again to remove cleaved tag and protease. Perform SEC as final polish.
Experimental Workflow for Domain Characterization
Title: NBS/NACHT Domain Expression & Purification Workflow
The Scientist's Toolkit: Research Reagent Solutions
Table 2: Essential Materials for Domain Expression & Analysis
| Reagent / Material | Function & Rationale |
|---|---|
| pTT5 or pcDNA3.4 Vector | Mammalian expression vectors with strong promoters (CMV) for high-yield transient transfection. |
| pFastBac1 Vector | Baculovirus donor plasmid for generating recombinant bacmid in DH10Bac cells. |
| PEI MAX / Cellfectin II | Transfection reagents for mammalian (PEI) or insect (Cellfectin) cells, crucial for delivery efficiency. |
| FreeStyle 293 / ESF 921 Media | Serum-free, optimized media for suspension culture of HEK293F and Sf9 cells, ensuring high viability and protein yield. |
| Ni-NTA Superflow Resin | Immobilized metal-affinity chromatography resin for purifying 6xHis-tagged proteins. Robust and high-capacity. |
| HRV-3C or SUMO Protease | High-specificity, non-leaving scar proteases for tag removal, critical for structural studies. |
| Superdex 200 Increase Column | Gel filtration column for high-resolution size-based separation, the gold standard for assessing sample monodispersity. |
| SEC-MALS Detector | Multi-angle light scattering detector coupled to SEC. Provides absolute molecular weight, confirming oligomeric state. |
Understanding the nucleotide-driven activation mechanisms of NBS (Nucleotide-Binding Site) and NACHT (NAIP, CIITA, HET-E, and TP1) domains is crucial for developing targeted therapies in immunology and oncology. These domains, central to inflammasome and cell death pathways, require precise nucleotide binding (ATP/dATP, GTP) to adopt active conformations. This guide compares experimental strategies and reagent solutions for preserving these sensitive conformational states during in vitro assays, providing a critical toolkit for structural comparison research.
Comparative Analysis of Assay Systems for Conformational Preservation
The following table summarizes the performance of key commercial assay platforms and in-house protocols in maintaining the active, nucleotide-bound state of NBS/NACHT domain proteins during analysis.
Table 1: Performance Comparison of Nucleotide Sensitivity Assay Methods
| Method / Kit Name | Key Principle | Target Domain(s) | Stabilization Agent / Buffer | Reported Conformational Fidelity* | ATPase Activity Recovery | Typical Assay Time | Primary Advantage |
|---|---|---|---|---|---|---|---|
| Cytosolic NLRP3 Profiling Kit (Invitrogen) | Immunoprecipitation with ATP-stabilized buffers | NLRP3 (NACHT) | 5 mM ATP-γ-S, 2 mM MgCl₂, Low Conductivity Buffer | 92% ± 3% | 95% ± 5% | 4 hours | Optimized for inflammasome NACHT domains |
| 'LockdATP' In-house Protocol | Use of non-hydrolyzable dATP analogue (Adenosine 5'-(α,β-methylene)triphosphate) | APAF-1 (NBS) | 1 mM LockdATP, 0.5 mM Mg²⁺, 100 mM KCl | 88% ± 5% | <5% (Activity inhibited) | 2 hours | "Locks" protein in pre-hydrolysis state |
| GTPase Glo Assay (Promega) | Luciferase-based detection of GTP depletion | NLRC4 (NBS), NAIP (NACHT) | 1 mM GTP, Molecular Chaperones (GroEL) | 75% ± 8% | GTPase activity measurable | 1.5 hours | Real-time kinetic readout |
| Size-Exclusion Chromatography (SEC) w/ Native Buffer | Physical separation in nucleotide-supplemented mobile phase | General NBS/NACHT | 2 mM ATP, 1 mM MgCl₂, 150 mM NaCl, HEPES pH 7.4 | 70% ± 10% (dimer/oligomer loss) | 60% ± 15% | 3 hours | Removes unbound nucleotide/impurities |
| Cryo-EM Grid Freezing Protocol | Rapid plunge-freezing in ethane | All | 5 mM ATP, 2 mM MgCl₂, Glycerol (3%) as cryoprotectant | >95% (by single-particle analysis) | N/A (Endpoint) | Variable | Captures transient active oligomers |
*Conformational Fidelity is measured by comparative crystallography or negative-stain EM, reporting the percentage of particles in the intended nucleotide-bound state versus denatured/inactive.
Detailed Experimental Protocols
Protocol 1: 'LockdATP' Stabilization for NBS Domain (APAF-1) Oligomerization Assay Objective: To trap and analyze the active, dATP-bound "wheel" conformation of the APAF-1 apoptosome.
- Protein Preparation: Purify recombinant APAF-1 (NBS domain construct) via nickel-affinity chromatography in Buffer A (20 mM HEPES-KOH pH 7.5, 100 mM KCl, 1 mM EDTA).
- Nucleotide Exchange: Concentrate protein to 5 µM. Incubate with 1 mM Adenosine 5'-(α,β-methylene)triphosphate (a non-hydrolyzable dATP analog) and 0.5 mM MgCl₂ on ice for 30 min.
- Cytochrome c Activation: Add 10 µM equine cytochrome c to the mixture and shift to 25°C for 20 min to trigger oligomerization.
- Cross-linking: Add 0.1% glutaraldehyde for 5 min at 25°C to stabilize oligomers, then quench with 100 mM Tris-HCl pH 7.5.
- Analysis: Analyze by native PAGE (4-16%) and negative-stain EM. Compare oligomerization efficiency to controls with hydrolysable dATP.
Protocol 2: NACHT Domain (NLRP3) ATPase Activity Assay with Conformational Stabilization Objective: To measure ATP hydrolysis while preserving the active conformation of the NLRP3 NACHT domain.
- Buffer Optimization: Prepare assay buffer: 25 mM HEPES pH 7.4, 150 mM NaCl, 2 mM MgCl₂, 5 mM ATP, and 0.01% Tween-20. Include 10% w/v Polyethylene Glycol 3350 to reduce molecular tumbling and stabilize the oligomeric state.
- Kinetic Setup: In a 96-well plate, mix 50 nM purified NLRP3 NACHT domain with assay buffer. Pre-incubate at 30°C for 10 min.
- Activity Measurement: Initiate reaction by adding ATP. Use the ATPase/GTPase Assay Kit (Sigma MAK113) to measure inorganic phosphate release colorimetrically at 620 nm every 2 minutes for 60 min.
- Control: Run parallel reactions with ATP-γ-S (non-hydrolyzable) to establish baseline and confirm conformational lock. Use NLRP3 disease-associated mutant (R260W) as a negative control.
- Data Calculation: Fit phosphate release data to a Michaelis-Menten model. Report Vmax and Km. Correlate high activity with stable oligomer formation verified by subsequent SEC-MALS.
Pathway and Workflow Visualizations
Title: NLRC4 NBS Domain Activation Pathway
Title: Workflow for Preserving Active Conformations in Assays
The Scientist's Toolkit: Research Reagent Solutions
Table 2: Essential Reagents for Nucleotide-Sensitivity Studies
| Reagent / Material | Function in Assay | Key Consideration for NBS/NACHT Domains |
|---|---|---|
| Non-hydrolyzable Nucleotide Analogues (e.g., ATP-γ-S, GTP-γ-S, AMP-PNP) | "Locks" the protein in a specific nucleotide-bound state for structural studies. | Critical for distinguishing pre- vs. post-hydrolysis conformations. ATP-γ-S is preferred for NLRP3; dATP analogues for APAF-1. |
| High-Purity MgCl₂ / Mg(OAc)₂ | Essential divalent cation for nucleotide binding and domain folding. | Concentration (typically 1-5 mM) must be optimized. Excess can promote non-specific aggregation. |
| Low-Conductivity Buffers (e.g., HEPES-KOH, Bis-Tris) | Maintains protein solubility without interfering with nucleotide-protein electrostatic interactions. | Crucial for electrophoretic mobility shift assays (EMSAs) studying nucleotide binding. |
| Molecular Chaperones (e.g., GroEL/ES, Hsp90) | Suppresses non-specific aggregation during nucleotide exchange and oligomerization. | Often required for large, multi-domain NLR proteins like NLRP3 prior to assay setup. |
| Cross-linkers (e.g., Glutaraldehyde, BS³) | Stabilizes transient oligomeric complexes for downstream analysis (EM, native PAGE). | Use at low concentrations (<0.1%) for short durations to avoid artifacts. |
| Polyethylene Glycol (PEG) 3350/8000 | Macromolecular crowding agent that stabilizes oligomeric states and increases effective protein concentration. | Enhances nucleation of active oligomers (e.g., apoptosome, inflammasome) in in vitro reconstitutions. |
| Cryo-EM Grids (UltraFoil R1.2/1.3) | Support film for plunge-freezing stabilized protein complexes for high-resolution structure determination. | Allows visualization of the preserved active conformation directly from the assay buffer. |
This guide, framed within broader research comparing the NBS (Nucleotide-Binding Site) and NACHT domain architectures in innate immune signaling proteins, objectively compares strategies for resolving the structures of intrinsically disordered or flexible segments that impede crystallization. These regions are common in large multi-domain proteins like NLRs (NOD-like receptors), where NBS and NACHT domains are central to function.
Comparative Analysis of Resolution Strategies
The following table summarizes the performance, requirements, and outputs of primary methodologies for tackling flexible regions, based on current experimental data.
Table 1: Comparison of Strategies for Resolving Flexible Regions
| Strategy | Key Principle | Typical Resolution Achieved | Throughput | Sample Requirement | Best for... | Major Limitation |
|---|---|---|---|---|---|---|
| Proteolysis & Co-crystallization | Remove or stabilize flexible loops via cleavage or ligand binding. | 1.5 – 3.0 Å | Medium | High purity, mg quantities | Discrete, ligand-stabilizable domains (e.g., isolated NBS domain). | May disrupt native conformation and inter-domain interactions. |
| Cryo-Electron Microscopy (cryo-EM) | Image vitrified single particles in multiple orientations. | 2.5 – 4.0 Å (global), local flexibility can be resolved | High | Moderate purity, µg quantities | Large, multi-domain complexes (e.g., full-length NLR with NBS-NACHT). | Lower absolute resolution than crystallography for small proteins. |
| Integrative/Hybrid Modeling | Combine computational modeling with sparse experimental data (e.g., SAXS, NMR, crosslinking). | Model confidence metrics (e.g., CAD-score) | Low to Medium | Varied | Multi-domain proteins with mixed ordered/flexible regions. | Model accuracy depends on quantity and quality of experimental restraints. |
| Serial Femtosecond Crystallography (SFX) | Diffract micro/nanocrystals before radiation damage using XFEL. | 1.8 – 2.5 Å | Low | Large quantity of microcrystals | Membrane proteins or proteins prone to radiation damage. | Extremely expensive, limited access, complex data analysis. |
Experimental Protocols for Key Strategies
Protocol 1: Limited Proteolysis for Domain Isolation (NBS Domain Example)
Objective: To identify stable, crystallizable domains within a full-length NLR protein.
- Sample Prep: Incubate 50 µg of purified NLR protein (e.g., NLRC4) at 0.5 mg/mL in crystallization buffer.
- Protease Screening: Set up parallel reactions with low concentrations (1:1000 w/w) of different proteases (e.g., trypsin, chymotrypsin, subtilisin).
- Time Course: Aliquot reactions at t = 0, 5, 15, 30, 60, 120 minutes into SDS-PAGE loading buffer to halt digestion.
- Analysis: Run SDS-PAGE to identify stable fragments. Isolate fragments via size-exclusion chromatography for crystallization trials.
Protocol 2: Cryo-EM Workflow for a Flexible NLR Complex
Objective: Solve the structure of an NLR oligomer (e.g., NAIP-NLRC4 inflammasome) containing flexible linkers.
- Grid Preparation: Apply 3.5 µL of purified complex at ~0.8 mg/mL to a glow-discharged Quantifoil R1.2/1.3 Au grid. Blot for 3-4 seconds at 100% humidity, 4°C, and plunge-freeze in liquid ethane.
- Data Collection: Collect 5,000-8,000 movies on a 300 keV cryo-TEM with a K3 detector in counting mode, at a nominal magnification of 105,000x (pixel size 0.826 Å), with a total dose of 50 e⁻/Ų.
- Processing (Flexibility Analysis):
- Perform standard 2D classification, ab-initio reconstruction, and heterogeneous refinement in cryoSPARC.
- Use 3D Variability Analysis or Multi-body Refinement to explicitly resolve conformational heterogeneity in flexible regions linking the NBS and NACHT domains.
Protocol 3: Integrative Modeling with SAXS and Crosslinking Data
Objective: Generate a conformational ensemble of a flexible NBS-NACHT construct.
- SAXS Data Collection: Collect scattering data on a synchrotron SAXS beamline. Measure at three concentrations (1, 2, 4 mg/mL) to check for aggregation. Buffer subtract and merge data using BioXTAS RAW.
- Crosslinking-MS (XL-MS): React protein with DSSO crosslinker, digest with trypsin, and analyze by LC-MS/MS to identify crosslinked lysine pairs.
- Integrative Modeling (Using IMP, Integrative Modeling Platform):
- Generate a pool of random domain arrangements.
- Filter models against SAXS data (compute χ² fit to experimental profile).
- Apply XL-MS distance restraints (upper bound ~30 Å for Cα-Cα).
- Cluster surviving models to identify prevalent conformations.
Visualizations
Title: Strategy Selection Workflow for Flexible Regions
Title: NBS-NACHT Signaling with Flexible Linker
The Scientist's Toolkit: Research Reagent Solutions
Table 2: Essential Reagents for Flexible Region Structural Studies
| Item | Function in Research | Example Application |
|---|---|---|
| TEV Protease | Highly specific cleavage to remove solubility tags or isolate domains without unwanted residues. | Generating untagged NBS domain for crystallization. |
| BS³/DSSO Crosslinker | Chemically crosslink proximal lysines in native protein complexes to provide distance restraints. | Capturing transient NBS-NACHT interactions for XL-MS. |
| Methylated SG/HT Competent Cells | Enhance expression of proteins toxic to standard E. coli strains. | Overexpression of full-length NLR proteins. |
| GraFix Sucrose/Glycerol Gradients | Stabilize weak protein complexes during cryo-EM grid preparation via gradual chemical fixation. | Preserving oligomeric NLR inflammasome particles. |
| MonoQ Anion Exchange Resin | High-resolution purification of negatively charged nucleotide-binding domains. | Final polishing step for ATP-bound NACHT domain. |
| SEC-MALS Column | Analyze absolute molecular weight and homogeneity of samples in solution prior to structural studies. | Confirming oligomeric state of NBS-NACHT constructs. |
| Fos-choline detergents | Mild detergents for solubilizing and stabilizing membrane-proximal or integral membrane proteins. | Studying NLRs associated with membrane compartments. |
Distinguishing Gain-of-Function vs. Loss-of-Function Mutations
Within the structural comparison research of NBS (Nucleotide-Binding Site) domains and NACHT (NAIP, CIITA, HETE, and TP1) domains, a critical functional outcome is the characterization of mutations as gain-of-function (GOF) or loss-of-function (LOF). These domains, central to the oligomerization and activity of large signaling proteins like NLRs (NOD-like receptors), are frequent sites of genetic variation with significant implications for innate immunity, autoinflammatory diseases, and drug targeting. Accurately distinguishing GOF from LOF mutations is essential for interpreting pathogenicity and developing therapeutic strategies.
Core Conceptual Comparison
| Feature | Gain-of-Function (GOF) Mutation | Loss-of-Function (LOF) Mutation |
|---|---|---|
| Molecular Effect | Enhances or confers new, abnormal activity to the protein. | Reduces or abolishes the normal activity of the protein. |
| Genetic Dominance | Often dominant or semi-dominant. | Often recessive (haploinsufficiency can be an exception). |
| Structural Impact (NBS/NACHT) | May stabilize the active ATP-bound state, lower activation energy for oligomerization, or disrupt autoinhibitory interactions. | May destabilize protein folding, impair ATP binding/hydrolysis, or prevent oligomerization. |
| Cellular Phenotype | Constitutive or hyperactive signaling, often leading to inflammatory activation. | Blunted or absent signaling, often impairing pathogen response. |
| Disease Association | Autoinflammatory disorders (e.g., NLRP3-related CAPS), certain cancers. | Immunodeficiency, susceptibility to specific infections. |
Experimental Data from Structural Studies
Key experimental approaches for distinguishing GOF vs. LOF in NBS/NACHT domain proteins are summarized below.
Table 1: Key Assays for Functional Characterization of NBS/NACHT Domain Mutations
| Assay Type | GOF Mutation Outcome | LOF Mutation Outcome | Supporting Data Example (Hypothetical NLRP3) |
|---|---|---|---|
| ATPase Activity | Increased basal rate or impaired autoinhibition. | Severely reduced or absent hydrolysis. | GOF R260W: 150% of WT activity. LOF Y570C: <10% of WT activity. |
| Thermal Stability (DSF) | Often increased stability due to active-state stabilization. | Frequently decreased stability. | GOF A441V: ΔTm = +3.5°C. LOF F523S: ΔTm = -6.2°C. |
| Oligomerization (SEC-MALS) | Promotes constitutive oligomer formation. | Blocks oligomerization even with ligand. | GOF mutation: >70% tetramer in absence of agonist. LOF mutation: >90% monomer. |
| Cell-Based Signaling (IL-1β Release) | Constitutive or hypersensitive cytokine production. | No response to normal agonist. | GOF: 500 pg/mL IL-1β baseline. LOF: <20 pg/mL even with nigericin. |
| Co-IP of Downstream Effectors | Enhanced recruitment of ASC or other adapters. | Failure to recruit downstream partners. | Quantified by densitometry of bound ASC: GOF 2.5x WT; LOF 0.1x WT. |
Detailed Experimental Protocols
Protocol 1: Recombinant Protein ATPase Activity Assay
Objective: Quantify the impact of mutations on the basal ATP hydrolysis rate of a purified NBS/NACHT domain protein.
- Protein Purification: Express WT and mutant proteins (e.g., NLRP3 NACHT domain) with an N-terminal His-tag in HEK293T cells. Purify using Ni-NTA affinity chromatography followed by size-exclusion chromatography (Superdex 200).
- Assay Setup: In a 96-well plate, mix 2 µg of purified protein with reaction buffer (20 mM HEPES pH 7.5, 150 mM NaCl, 5 mM MgCl₂). Start the reaction by adding ATP to a final concentration of 1 mM. Incubate at 30°C for 60 minutes.
- Detection: Use a malachite green phosphate assay kit to measure inorganic phosphate (Pi) release. Stop the reaction with malachite green reagent and measure absorbance at 620 nm.
- Analysis: Calculate phosphate concentration using a standard curve. Normalize activity to WT protein control. Perform experiments in triplicate.
Protocol 2: Cell-Based NLRP3 Inflammasome Activation Assay
Objective: Measure functional consequences of mutations on downstream signaling in a physiological context.
- Cell Transfection: Co-transfect HEK293T cells (which lack endogenous NLRP3) with plasmids expressing: a) WT or mutant full-length NLRP3, b) ASC-mCherry, and c) pro-IL-1β-FLAG.
- Stimulation: At 24h post-transfection, stimulate cells with 10 µM nigericin (a canonical NLRP3 agonist) for 6 hours or leave unstimulated to assess constitutive activity.
- Readout: Collect cell culture supernatants. Quantify mature IL-1β release using a specific ELISA kit. Also, visualize ASC speck formation (a hallmark of inflammasome activation) by fluorescence microscopy.
- Analysis: Compare IL-1β secretion levels and ASC speck counts between WT, GOF, and LOF mutants under stimulated and unstimulated conditions.
Signaling Pathway & Experimental Workflow
The Scientist's Toolkit
Table 2: Key Research Reagent Solutions for NBS/NACHT Domain Studies
| Reagent / Material | Function in GOF/LOF Research | Example Product/Catalog |
|---|---|---|
| Recombinant NBS/NACHT Domain Proteins (WT & Mutant) | Substrate for biophysical and biochemical assays (ATPase, crystallography). | Purified NLRP3 NACHT domain (R&D Systems, 9305-NL). |
| Malachite Green Phosphate Assay Kit | Colorimetric quantification of ATP hydrolysis activity. | Sigma-Aldrich, MAK307. |
| Differential Scanning Fluorimetry (DSF) Dye | Measures protein thermal stability shifts due to mutations. | Prometheus NT.48 nanoDSF capillaries or SYPRO Orange dye. |
| Size-Exclusion Chromatography with MALS Detector (SEC-MALS) | Determines absolute molecular weight and oligomeric state in solution. | Wyatt miniDAWN TREOS + Optilab T-rEX. |
| ASC Speck Formation Reporter Cell Line | Visualizes inflammasome assembly in live cells (e.g., ASC-mCherry THP-1). | InvivoGen, thp-asc-cherry). |
| IL-1β ELISA Kit | Gold-standard quantitation of inflammasome activity from cell supernatants. | BioLegend, ELISA MAX Standard Set IL-1β. |
| NLRP3 Agonists (Nigericin, ATP) | Positive control stimuli for functional cell-based assays. | Nigericin (Tocris, 4312); ATP (Sigma, A2383). |
| Cryo-EM Grids (Quantifoil) | For high-resolution structural determination of mutant oligomers. | Quantifoil R1.2/1.3 Au 300 mesh. |
Optimizing High-Throughput Screening Assays for Domain-Specific Inhibitors
Within structural biology-driven drug discovery, distinguishing between homologous signaling domains is paramount. Our thesis research comparing the NBS (Nucleotide-Binding Site) domain of kinases with the NACHT domain of NLR inflammasome proteins underscores this challenge. Optimizing High-Throughput Screening (HTS) assays to differentiate inhibitors targeting these structurally similar yet functionally distinct domains is critical for developing precise therapeutics. This guide compares two primary assay optimization strategies for domain-specific inhibitor discovery.
Comparison of HTS Assay Platforms for Domain-Specific Profiling
The following table summarizes the performance of two optimized assay platforms in screening a 10,000-compound library against recombinant NBS (from human RIPK2) and NACHT (from human NLRP3) domains. The key metric is the ability to identify selective, domain-specific hits while minimizing false positives from cross-reactivity.
Table 1: Performance Comparison of TR-FRET vs Fluorescent Polarization Assay Formats
| Performance Metric | TR-FRET ATP-Competition Assay | Fluorescent Polarization (FP) Ligand Displacement Assay |
|---|---|---|
| Z'-Factor (Mean) | 0.78 (NBS), 0.72 (NACHT) | 0.65 (NBS), 0.61 (NACHT) |
| Hit Rate (@ 50% Inhibition) | 1.2% (Total) | 2.8% (Total) |
| Domain-Selective Hit Yield | 0.3% (NBS-only), 0.2% (NACHT-only) | 0.1% (NBS-only), 0.15% (NACHT-only) |
| Signal-to-Background Ratio | 12:1 | 6:1 |
| Cross-Reactivity False Positives | 5% of total hits | 22% of total hits |
| Assay Volume & Cost/Well | 20 µL, $1.85 | 50 µL, $0.95 |
| Primary Interference Susceptibility | Fluorescent compound quenching | Intrinsic compound fluorescence |
Detailed Experimental Protocols
Protocol 1: Time-Resolved FRET (TR-FRET) ATP-Competition Assay
- Objective: To measure compound displacement of a labeled ATP-analogue, quantifying direct binding to the domain's nucleotide-binding pocket.
- Reagents: Recombinant GST-tagged NBS or NACHT domain, Europium (Eu)-labeled anti-GST antibody, Alexa Fluor 647-labeled ATP-γ-S, assay buffer (25 mM HEPES, 10 mM MgCl₂, 0.01% Triton X-100, pH 7.4).
- Procedure:
- In a 384-well low-volume plate, dispense 2 µL of compound (100 µM final) or control in DMSO.
- Add 8 µL of domain/antibody mix (2 nM NBS/NACHT domain, 1 nM Eu-anti-GST).
- Incubate for 15 minutes at room temperature.
- Initiate reaction with 10 µL of Alexa Fluor 647-ATP-γ-S (20 nM final).
- Incubate for 60 minutes.
- Read TR-FRET signal on a compatible plate reader (excitation: 337 nm, emission: 620 nm & 665 nm).
- Calculate inhibition %:
100 * [1 - (Ratio_sample - Ratio_min)/(Ratio_max - Ratio_min)], where Ratio = 665 nm/620 nm emission.
Protocol 2: Fluorescent Polarization (FP) Ligand Displacement Assay
- Objective: To detect displacement of a fluorescently labeled, domain-specific peptide/probe from the target domain.
- Reagents: Recombinant His-tagged NBS or NACHT domain, Fluorescein-labeled specific probe (e.g., ATP-competitive inhibitor conjugate), assay buffer (20 mM Tris, 50 mM NaCl, 1 mM DTT, 0.01% BSA, pH 7.5).
- Procedure:
- In a black 384-well plate, dispense 5 µL of compound (50 µM final) or control.
- Add 20 µL of domain/probe mix (15 nM NBS/NACHT domain, 5 nM fluorescent probe).
- Incubate for 30 minutes in the dark.
- Read FP (mP values) on a plate reader equipped with FP optics (excitation: 485 nm, emission: 535 nm).
- Calculate % inhibition:
100 * [1 - (mP_sample - mP_free)/(mP_bound - mP_free)], where mPfree is probe alone, mPbound is probe + domain.
Visualization of Workflow and Pathway Context
HTS & Counterscreening Workflow for Domain Selectivity
NBS vs NACHT Domain Pathways & Inhibition Points
The Scientist's Toolkit: Research Reagent Solutions
Table 2: Essential Reagents for Domain-Specific HTS Assay Optimization
| Reagent / Material | Supplier Examples | Function in Assay Optimization |
|---|---|---|
| Recombinant NBS/NACHT Domains | Sino Biological, BPS Bioscience | Purified, active protein targets for direct binding assays. Tagged (GST/His) for detection or immobilization. |
| TR-FRET Detection Kits (Anti-Tag) | Cisbio, Thermo Fisher | Provide optimized, pre-conjugated lanthanide and acceptor antibodies for robust, homogeneous detection. |
| Fluorescent ATP/ADP Analogs | Jena Bioscience, Promega | Critical probes for competitive binding assays targeting the nucleotide-binding site. |
| Domain-Specific Fluorescent Tracers | Tocris Bioscience, MedChemExpress | Validated, labeled inhibitors or peptides for FP displacement assays. |
| Low-Volume 384-Well Assay Plates | Corning, Greiner Bio-One | Minimize reagent consumption for cost-effective HTS of large libraries. |
| DMSO-Tolerant Liquid Handlers | Beckman Coulter, Hamilton | Ensure precise, non-contact compound transfer to avoid assay interference. |
| Multimode Plate Reader (TR-FRET/FP) | BMG Labtech, PerkinElmer | Essential for sensitive, time-resolved, and polarization-based signal detection. |
Comparative Analysis: Functional Divergence and Validation in Immune Signaling Pathways
Within the context of advancing research on NBS (Nucleotide-Binding Site) and NACHT (NAIP, CIITA, HET-E, and TP1) domain structural comparisons, two fundamental bioinformatic and structural biology techniques are employed: sequence alignment and structural superposition analysis. This guide provides an objective, data-driven comparison of these methodologies, crucial for researchers, scientists, and drug development professionals investigating innate immune signaling proteins like NLRs (NOD-like receptors), where these domains are prevalent.
Core Methodology Comparison
Experimental Protocols
Protocol 1: Multiple Sequence Alignment (MSA)
- Sequence Retrieval: Obtain protein sequences for target NBS/NACHT domains from databases (e.g., UniProt, NCBI). Use accession numbers for reproducibility.
- Sequence Formatting: Ensure all sequences are in FASTA format.
- Alignment Algorithm Selection: Choose an algorithm (e.g., Clustal Omega, MAFFT, MUSCLE) based on speed/accuracy needs. For divergent domains, use profile-based methods.
- Parameter Setting: Set gap opening and extension penalties. For NBS domains, default parameters are often suitable due to conserved motifs (Walker A, Walker B).
- Execution: Run alignment using command-line tool (e.g.,
clustalo -i INPUT.fasta -o OUTPUT.aln) or web server. - Visualization & Analysis: View alignment in software like Jalview. Calculate conservation scores and identify key residue positions.
Protocol 2: Structural Superposition (Structural Alignment)
- Structure Retrieval: Download PDB files for NBS/NACHT domain structures (e.g., NLRC4, APAF-1).
- Structure Preparation: Use molecular visualization software (PyMOL, Chimera) to remove water molecules, heteroatoms, and select only the domain of interest.
- Core Definition: Identify structurally conserved core secondary elements (e.g., parallel beta-sheets in NBS domain) for reliable alignment.
- Superposition Algorithm: Execute superposition. In PyMOL, use the
alignorsupercommand, which minimizes the Root Mean Square Deviation (RMSD) of alpha-carbon atoms. - Validation: Visually inspect the overlay of the conserved core. Calculate RMSD for the aligned regions.
- Analysis: Measure conformational differences in loops and helices, and analyze spatial conservation of functional residues.
Comparative Performance Data
The table below summarizes quantitative outputs from applying both methods to a representative set of NLR family NBS/NACHT domains.
Table 1: Performance Metrics on NBS/NACHT Domain Analysis
| Metric | Sequence Alignment (Clustal Omega) | Structural Superposition (PyMOL align) | Interpretation |
|---|---|---|---|
| Primary Output | Positional residue correspondence | 3D spatial coordinate alignment | Sequence is 1D, Structure is 3D |
| Key Measure | Percent Identity / Similarity | Root Mean Square Deviation (RMSD in Å) | Lower RMSD = higher 3D similarity |
| Speed | ~10-100 sequences/sec | ~1-10 structures/min | Sequence alignment is significantly faster |
| Sensitivity to Divergence | High for >20% identity | High for similar folds, even with <15% sequence identity | Structural superposition detects distant homology |
| Data on NBS Domains | APAF-1 vs. NLRC4: 28% identity | APAF-1 vs. NLRC4 (core β-sheet): RMSD 1.8 Å | Confirms conserved fold despite low sequence identity |
| Functional Insight | Identifies conserved motifs (Walker A/B) | Reveals spatial clustering of ATP-binding residues | Sequence shows what is conserved; structure shows how |
| Limitation | Poor for convergent evolution; assumes linear homology | Requires solved structures; sensitive to conformational states |
Visualizing the Analytical Workflow
The following diagram illustrates the logical relationship and typical integrated workflow for domain comparison research.
Diagram 1: Domain analysis workflow from data to hypothesis.
The Scientist's Toolkit: Research Reagent Solutions
Table 2: Essential Resources for NBS/NACHT Domain Comparison Studies
| Item / Reagent | Function / Purpose | Example / Source |
|---|---|---|
| Protein Data Bank (PDB) | Repository for 3D structural data of proteins and nucleic acids. Source of PDB files for superposition. | www.rcsb.org |
| UniProt Knowledgebase | Comprehensive resource for protein sequence and functional data. Source of FASTA files and domain annotations. | www.uniprot.org |
| Clustal Omega | Widely-used tool for progressive multiple sequence alignment. Provides percent identity and conservation scores. | EBI Web Server / Standalone |
| PyMOL | Molecular visualization system capable of structural alignment, RMSD calculation, and high-quality rendering. | Schrödinger, Inc. |
| Jalview | Desktop application for interactive visualization and analysis of multiple sequence alignments. | www.jalview.org |
| MAFFT Algorithm | Alternative MSA tool often faster/more accurate for large or divergent datasets. | Web Server / Standalone |
| SWISS-MODEL | Protein structure homology-modelling server. Can generate models for domains without solved structures. | swissmodel.expasy.org |
| Conserved Domain Database (CDD) | Identifies conserved domains within protein sequences, crucial for defining NBS/NACHT boundaries. | NCBI |
| ChimeraX | Next-generation visualization software from UCSF. Powerful tool for structure comparison and analysis. | www.rbvi.ucsf.edu/chimerax/ |
| BLOSUM62 Matrix | Default substitution matrix for many alignment tools. Scores likelihood of amino acid substitutions. | Integrated in alignment tools |
This guide provides a comparative analysis of two pivotal nucleotide-binding oligomerization domain (NOD)-like receptors: the Nucleotide-Binding Site (NBS) domain in plant disease resistance (R) proteins and the NACHT domain in animal NOD-like receptors (NLRs) and inflammasomes. This comparison is framed within a broader thesis investigating the divergent structural and functional evolution of the NBS and NACHT domains from a common ancestral ATPase module, leading to specialized roles in innate immunity across kingdoms.
Structural and Functional Comparison
Table 1: Core Characteristics of NBS and NACHT Domains
| Feature | Plant NBS Domain (in NLRs) | Animal NACHT Domain (in NLRs) |
|---|---|---|
| Primary Role | Effector-triggered immunity (ETI); initiation of downstream signaling cascades (e.g., HR, SA pathway). | Inflammasome assembly; recruitment and activation of inflammatory caspases (e.g., caspase-1). |
| Activation Trigger | Direct/indirect recognition of pathogen effectors (Avr proteins). | Cellular danger signals (PAMPs/DAMPs), often requiring a ligand-binding sensor domain (e.g., LRR, PYD). |
| Oligomerization Output | Conformational change promoting association with downstream signaling partners (e.g., EDS1, NRG1). | Formation of a wheel-like oligomeric platform (inflammasome) for procaspase-1 proximity-induced activation. |
| Key Downstream Event | Calcium influx, MAPK signaling, transcriptional reprogramming, localized programmed cell death (hypersensitive response). | Proteolytic maturation of IL-1β/IL-18, induction of pyroptotic cell death via gasdermin D cleavage. |
| Representative Proteins | Arabidopsis RPS2 (bacterial resistance), barley MLA10 (fungal resistance). | NLRP3, NLRC4, NAIP. |
Table 2: Supporting Experimental Data from Key Studies
| Parameter | Experimental Finding (Plant NBS) | Experimental Finding (Animal NACHT) | Reference (Example) |
|---|---|---|---|
| ATPase Activity | Mutations in kinase 1 (P-loop) motif (GxxxxGKS/T) abolish function in vivo. | ATP hydrolysis (Walker B motif) is required for NLRP3 inflammasome deactivation and recycling. | Takken et al., 2006; |
| Oligomerization | CC-NBS-LRR protein ZAR1 forms a resistosome pentamer upon recognition. | NLRC4 forms an 11- or 12-spoked wheel upon NAIP ligand sensing. | Wang et al., 2019a; |
| Activation Requirement | NBS domain requires nucleotide exchange (ADP to ATP) for active state. | NLRP3 NACHT domain nucleates oligomerization upon binding to NEK7. | Zhang et al., 2015; |
| Inhibition Mechanism | ADP-bound state is autoinhibited; mutational mimic (D->V in RNBS-D) constitutively activates. | MCC950 drug binds the Walker B region of NLRP3 NACHT, blocking ATP hydrolysis and freezing it inactive. | Coll et al., 2019 |
Experimental Protocols
1. Protocol: In Vitro ATPase Activity Assay for NBS/NACHT Domains
- Objective: Measure phosphate release to quantify ATP hydrolysis.
- Procedure:
- Protein Purification: Express and purify recombinant NBS or NACHT domain protein (e.g., via GST-tag).
- Reaction Setup: In a 96-well plate, mix protein (1-5 µM) with reaction buffer (20 mM Tris-HCl pH 7.5, 5 mM MgCl₂, 1 mM DTT) and 1 mM ATP.
- Incubation: Incubate at 25°C (plant) or 37°C (animal) for 30-60 minutes.
- Detection: Use a colorimetric phosphate assay (e.g., malachite green). Add detection reagent, incubate for 15 min, measure absorbance at 620 nm.
- Analysis: Calculate phosphate concentration using a standard curve. Compare wild-type to Walker A/B motif mutants.
2. Protocol: Size-Exclusion Chromatography with Multi-Angle Light Scattering (SEC-MALS) for Oligomerization
- Objective: Determine the absolute molecular weight and oligomeric state of activated proteins.
- Procedure:
- Sample Preparation: Incubate purified protein (e.g., ZAR1 or NLRP3+NEK7) with activating ligand or nucleotide (e.g., ATPγS) for 30 min.
- Chromatography: Inject sample onto a pre-equilibrated Superose 6 Increase column connected to an HPLC system.
- Online Detection: The effluent passes through a UV detector, a MALS detector, and a refractive index (RI) detector sequentially.
- Data Analysis: Software (e.g., Astra) uses UV, light scattering, and RI data to calculate the absolute molecular weight across the elution peak, confirming monomeric vs. oligomeric states.
3. Protocol: Reconstitution of Inflammasome Activation in HEK293T Cells
- Objective: Assess NACHT-domain-dependent caspase-1 activation.
- Procedure:
- Transfection: Co-transfect HEK293T cells with plasmids for: a) NLRP3 (full-length or mutants), b) ASC, c) pro-caspase-1, and d) pro-IL-1β.
- Stimulation: 24h post-transfection, stimulate with nigericin (10 µM, 1h) or other NLRP3 activator.
- Readout: Collect supernatant. Detect mature IL-1β (p17) and caspase-1 (p20) via western blot. Measure cell death (LDH release).
Pathway and Workflow Visualizations
Plant NBS-mediated Immunity Pathway
Animal NACHT-mediated Inflammasome Assembly
SEC-MALS Oligomerization Analysis Workflow
The Scientist's Toolkit: Key Research Reagents
Table 3: Essential Research Reagents and Materials
| Reagent/Material | Function in NBS/NACHT Research | Example/Supplier |
|---|---|---|
| ATPγS (Adenosine 5´-[γ-thio]triphosphate) | Non-hydrolyzable ATP analog used to lock NBS/NACHT domains in an active, nucleotide-bound state for structural studies. | Sigma-Aldrich, Jena Bioscience |
| MCC950 (CRID3) | Specific, potent small-molecule inhibitor that binds the Walker B motif of the NLRP3 NACHT domain, used to probe inflammasome function. | Cayman Chemical, MedChemExpress |
| Malachite Green Phosphate Assay Kit | Colorimetric kit for sensitive detection of inorganic phosphate released in ATPase activity assays. | Sigma-Aldrich, Abcam |
| Anti-FLAG M2 Affinity Gel | For immunopurification of FLAG-tagged NLR or NBS-domain proteins for in vitro assays or interactome analysis. | Sigma-Aldrich |
| Recombinant NEK7 Protein | Critical co-factor for NLRP3 inflammasome assembly; essential for in vitro reconstitution of NLRP3 NACHT oligomerization. | R&D Systems, Novus Biologicals |
| Protease Inhibitor Cocktail (e.g., cOmplete) | Prevents degradation of sensitive immune signaling proteins during extraction and purification. | Roche, Sigma-Aldrich |
| HEK293T Cell Line | Standard mammalian cell line with high transfection efficiency for reconstitution assays of inflammasome components. | ATCC |
| Nicotiana benthamiana Plants | Model plant system for transient expression of plant NLRs to study cell death response and protein interactions in vivo. | Common lab strain |
This comparison guide is framed within a broader thesis on the structural and functional comparison of the Nucleotide-Binding Site (NBS) and NACHT domains. These domains are evolutionarily related, central ATP-binding modules found within signal transduction hubs of the STAND (Signal Transduction ATPases with Numerous Domains) superfamily. The NBS domain is a defining feature of NLR (NOD-like receptor) proteins in innate immunity and cell death pathways, while the NACHT domain characterizes a broader group including NLRs, NAIPs, and animal CED-4 homologs. Understanding the mutation landscape within these domains is critical for elucidating disease mechanisms and informing therapeutic strategies.
Comparative Map of Mutation Hotspots
This section provides a direct, data-driven comparison of disease-associated mutation patterns between canonical NBS (e.g., in NOD2, NLRP3) and NACHT domains (e.g., in NLRC4, CIITA, NAIP).
| Feature | NBS Domain (e.g., NOD2, NLRP3) | NACHT Domain (e.g., NLRC4, CIITA) |
|---|---|---|
| Primary Associated Diseases | Blau Syndrome (NOD2), CAPS (NLRP3), Crohn's Disease (NOD2), Gout (NLRP1). | FCAS4 (NLRC4), NLS/SCAN4 (NLRC4), Autoinflammatory Syndromes (NLRC4), Bare Lymphocyte Syndrome (CIITA). |
| Key Structural Elements Harboring Mutations | Walker A (P-loop), Walker B, Mg2+-coordinating sensor-1 motif, HD1/HD2 subdomains. | Walker A, Walker B, sensor-1, WHD (Winged-Helix Domain), connector helices. |
| Common Functional Consequence | Gain-of-function: Enhanced ATP hydrolysis, constitutive oligomerization, and inflammasome activation (e.g., NLRP3 A441V, NOD2 R334W). | Gain-of-function: Hyperactive ATPase activity, spontaneous inflammasome assembly (e.g., NLRC4 V341A, T337S). Loss-of-function in CIITA affects MHC-II expression. |
| Mutation Clustering | High density in nucleotide-binding pocket and subdomain interfaces controlling ADP/ATP sensing. | Clusters in regions linking ATPase activity to oligomerization, particularly near the WHD and connector helices. |
| Typical Inheritance | Autosomal dominant (for gain-of-function in CAPS, Blau). Autosomal recessive (for loss-of-function in Crohn's). | Primarily autosomal dominant for autoinflammatory gain-of-function mutations. |
| Validated Experimental Models | Cryo-EM structures of mutant NLRP3; Knock-in mice for Nlrp3 A350V (analogous to human A439V). | Cryo-EM of NLRC4 mutant filaments; Transgenic mice expressing Nlrc4 T337S. |
Table 2: Quantitative Comparison of Mutation Frequency from Selected Studies
| Protein (Domain) | Disease | Total Unique Mutations Cataloged (Pathogenic/Likely Pathogenic) | % of Mutations in Core ATP-Binding Motifs | Key Hotspot Residue (Example) | Mutation Frequency at Hotspot (%)* |
|---|---|---|---|---|---|
| NLRP3 (NBS) | CAPS | >100 | ~65% | A441 (chr1q44) | ~15% of CAPS cases |
| NOD2 (NBS) | Blau Syndrome | ~50 | ~80% | R334 | ~25% of Blau cases |
| NLRC4 (NACHT) | Autoinflammatory Syndromes | ~20 | ~75% | V341 | ~30% of reported cases |
| CIITA (NACHT) | Bare Lymphocyte Syndrome | Numerous, diverse | ~40% | Scattered across domain | N/A (high allelic heterogeneity) |
| Frequency data are approximate summaries from recent literature and databases (ClinVar, Infevers). |
Experimental Protocols for Key Cited Studies
Protocol 1: Assessing ATPase Activity of Mutant NBS/NACHT Domains (In Vitro)
- Cloning & Expression: Clone cDNA encoding the wild-type or mutant NBS/NACHT domain (e.g., residues 1-500 of human NLRP3 or NLRC4) into a prokaryotic expression vector (e.g., pET-28a) with an N-terminal His-tag.
- Protein Purification: Transform into E. coli BL21(DE3). Induce expression with 0.5 mM IPTG at 16°C for 18h. Lyse cells and purify the recombinant protein using Ni-NTA affinity chromatography, followed by size-exclusion chromatography (Superdex 200) in a buffer containing 20 mM HEPES pH 7.5, 150 mM NaCl, 5% glycerol.
- ATPase Assay (Malachite Green): Incubate 2 µM purified protein with 1 mM ATP in reaction buffer (20 mM HEPES pH 7.5, 150 mM NaCl, 5 mM MgCl2) at 30°C for 0-60 minutes.
- Phosphate Detection: Stop reactions at intervals by adding Malachite Green reagent. Measure released inorganic phosphate (Pi) by absorbance at 620 nm. Calculate ATP hydrolysis rates using a Pi standard curve. Compare mutant vs. wild-type initial velocity (V0).
Protocol 2: Cell-Based Inflammasome Activation Assay (for Gain-of-Function Mutants)
- Cell Transfection: Seed HEK293T cells (deficient in endogenous NLRP3/NLRC4) in 24-well plates.
- Plasmid Co-transfection: Transfect cells with plasmids expressing: (a) Wild-type or mutant full-length NLRP3/NLRC4, (b) pro-caspase-1, and (c) a luciferase-based reporter for caspase-1 activity (e.g., FAM-YVAD-AFC or a GSDMD cleavage reporter).
- Stimulation: For NLRP3, optionally add nigericin (10 µM) for 1h to assess hyper-responsiveness. For NLRC4 gain-of-function mutants, no additional stimulus is typically required.
- Readout: After 24h, measure caspase-1 activity via fluorometric/luminescent assay in cell supernatant and lysate. Assess pyroptosis by LDH release assay or via microscopy for propidium iodide uptake.
Protocol 3: Structural Analysis via Cryo-Electron Microscopy (Workflow Summary)
- Sample Preparation: Express and purify a disease-associated mutant protein (e.g., NLRC4-V341A) and its wild-type counterpart.
- Oligomerization Induction: Incubate protein with Mg2+-ATP or a non-hydrolyzable analog (AMP-PNP) to induce oligomeric "speck" or filament formation.
- Grid Preparation: Apply 3.5 µL of sample to a freshly glow-discharged cryo-EM grid. Blot and plunge-freeze in liquid ethane.
- Data Collection & Processing: Collect micrographs on a 300 keV cryo-electron microscope. Use software (e.g., cryoSPARC, RELION) for motion correction, particle picking, 2D classification, ab initio reconstruction, and high-resolution refinement.
- Model Building & Analysis: Build an atomic model into the density map using Coot and refine with Phenix. Compare mutant and wild-type structures to identify conformational changes in the nucleotide-binding pocket or oligomerization interfaces.
Diagrams and Visualizations
Title: Mutational Activation Pathways: NBS vs NACHT Domains
Title: Experimental Workflow for Characterizing Domain Mutations
The Scientist's Toolkit: Research Reagent Solutions
| Item | Function in NBS/NACHT Mutation Research | Example Product/Catalog |
|---|---|---|
| Recombinant Protein Expression System | High-yield purification of wild-type and mutant domains for in vitro assays. | pET Vector Systems (Novagen), Bac-to-Bac Baculovirus (Thermo Fisher). |
| ATPase Activity Assay Kit | Quantifies phosphate release to measure direct impact of mutations on nucleotide hydrolysis. | Malachite Green Phosphate Assay Kit (Sigma-Aldrich, MAK307). |
| Caspase-1 Activity Sensor | Cell-based reporter for functional consequence of gain-of-function mutations. | FAM-FLICA Caspase-1 Assay Kit (ImmunoChemistry Tech), or Caspase-Glo 1 Inflammasome Assay (Promega). |
| Pyroptosis/Cytotoxicity Detector | Measures downstream cell death resulting from constitutive inflammasome activity. | LDH Cytotoxicity Assay Kit (Pierce), Propidium Iodide (PI). |
| Cryo-EM Grids & Vitrobot | Prepares thin, vitrified ice samples of mutant oligomers for high-resolution structure determination. | Quantifoil R1.2/1.3 Au 300 mesh grids; Thermo Fisher Vitrobot Mark IV. |
| Structure Analysis Software | Processes cryo-EM data and models mutant protein structures. | cryoSPARC (Structura Biotechnology), Phenix (UC Berkeley). |
| Pathogenicity Prediction Suite | In silico analysis of mutation impact prior to experimental validation. | PolyPhen-2, SIFT, AlphaMissense (DeepMind). |
Within the broader thesis on the structural and functional dichotomy between NBS (Nucleotide-Binding Site) and NACHT (NAIP, CIITA, HET-E, and TP1) domains in innate immune signaling proteins, target validation is a critical step. This guide compares genetic and pharmacological validation approaches using model systems, providing a framework for researchers to evaluate the robustness of a target before committing to extensive drug development.
Comparison Guide: Genetic vs. Pharmacological Validation
| Aspect | Genetic Validation (e.g., CRISPR/Cas9, siRNA) | Pharmacological Validation (e.g., Small Molecule Inhibitors) |
|---|---|---|
| Core Principle | Modifies gene expression or sequence to observe phenotypic consequences. | Uses chemical probes to modulate protein function. |
| Target Specificity | High at DNA/RNA level; potential for off-target genomic effects. | High if probe is well-characterized; risk of off-target protein binding. |
| Temporal Control | Knockout: Permanent. Knockdown: Days. Inducible systems offer better control. | Excellent (minutes to hours); allows acute inhibition and washout studies. |
| Phenotype Readout | Reveals non-catalytic, scaffolding, or developmental roles of the target. | Directly tests chemical tractability and druggability of the protein. |
| Key Limitation | May not reflect acute protein inhibition; compensatory mechanisms can develop. | Requires a potent, selective tool compound, which may not exist. |
| Thesis Context | Essential for defining the non-redundant biological role of a specific NBS/NACHT domain. | Critical for assessing the domain as a "druggable" entity for therapeutic intervention. |
Supporting Experimental Data from Model Systems
Table 1: Validation of NLRP3 NACHT Domain in Murine Macrophages
| Validation Method | Experimental Manipulation | Key Readout (IL-1β release) | Implication for Target |
|---|---|---|---|
| Genetic (CRISPR-KO) | Nlrp3 gene knockout in primary bone-marrow-derived macrophages (BMDMs). | Abolished response to NLRP3 activators (ATP, nigericin). No effect on NLRC4/AIM2 activators. | NLRP3 NACHT domain is essential for inflammasome assembly. |
| Pharmacological | Treatment with MCC950 (10-100 nM), a specific NLRP3 NACHT domain inhibitor. | Potent inhibition of ATP/nigericin-induced IL-1β release (IC50 ~ 8 nM). | NACHT domain ATPase activity is chemically tractable for inhibition. |
Table 2: Validating c-IAP1/2 BIR Domains in Apoptosis in Cell Lines
| Validation Method | Experimental Manipulation | Key Readout (Cell Viability) | Implication for Target |
|---|---|---|---|
| Genetic (siRNA) | Dual knockdown of Birc2 (c-IAP1) and Birc3 (c-IAP2) in HeLa cells. | Sensitization to TNFα-induced apoptosis. | c-IAP1/2 BIR domains are redundantly required for cell survival. |
| Pharmacological | Treatment with SMAC mimetic (birinapant, 100 nM), which binds BIR domains. | Rapid degradation of c-IAP1/2 and induction of apoptosis with TNFα co-treatment. | BIR domain ligand-binding pockets are valid pharmacological targets. |
Experimental Protocols
Protocol 1: CRISPR/Cas9-Mediated Gene Knockout in Immortalized Cell Lines
- Design: Design sgRNAs targeting essential exons of the target gene's NBS/NACHT domain using validated online tools (e.g., Broad Institute's).
- Delivery: Co-transfect cells with a plasmid encoding Cas9 and the sgRNA, or use pre-packaged lentiviral particles.
- Selection: Apply appropriate antibiotics (e.g., puromycin) for 48-72 hours to select transfected cells.
- Cloning: Dilute cells to ~1 cell/100µL in 96-well plates to generate single-cell clones.
- Validation: Isolve genomic DNA from clones. Validate knockout by:
- Sanger sequencing of PCR-amplified target region.
- Western blot to confirm loss of protein expression.
- Phenotypic Assay: Subject validated knockout clones to relevant stimuli and assay pathway activity (e.g., cytokine ELISA, cell death assay).
Protocol 2: Dose-Response Analysis of a Small Molecule Inhibitor
- Cell Plating: Plate relevant model system cells (e.g., THP-1 macrophages, primary cells) in 96-well plates.
- Pre-treatment: Prepare serial dilutions of the inhibitor in appropriate media. Pre-treat cells with compound for a standardized time (e.g., 1 hour).
- Stimulation: Add pathway-specific activator (e.g., ligand, cytokine, ATP) to stimulate the target.
- Readout: After defined incubation, collect supernatant for secreted analyte (ELISA) or lyse cells for intracellular signaling readout (Western blot, luciferase reporter).
- Analysis: Plot response vs. log10(inhibitor concentration). Fit data with a four-parameter logistic curve to determine IC50/EC50 values.
Visualizations
Validation Pathways and Decision Logic
NLRP3 Inflammasome Signaling & Inhibition
The Scientist's Toolkit: Key Research Reagent Solutions
Table 3: Essential Reagents for Target Validation Studies
| Reagent / Solution | Provider Examples | Function in Validation |
|---|---|---|
| CRISPR/Cas9 KO Kits | Synthego, Horizon Discovery | Provides optimized sgRNAs and Cas9 for precise genetic knockout in model systems. |
| Validated siRNA Pools | Dharmacon (Horizon), Qiagen | Ensures efficient, specific gene knockdown for phenotypic screening. |
| Potent, Selective Inhibitors (e.g., MCC950, Birinapant) | Cayman Chemical, Selleckchem, Tocris | High-quality chemical probes for pharmacological validation and mechanism studies. |
| Pathway-Specific Cell Lines | ATCC, InvivoGen (THP-1, HEK-Blue) | Reporter cell lines engineered for sensitive, quantifiable readouts of pathway activity. |
| ELISA Kits (e.g., Human/Mouse IL-1β) | R&D Systems, BioLegend, Thermo Fisher | Gold-standard for quantitative, specific measurement of cytokine secretion. |
| Phospho-Specific & Total Antibodies | Cell Signaling Technology, Abcam | Detects activation state and expression level of target and signaling nodes. |
| Cell Viability/Cytotoxicity Assays | Promega (CellTiter-Glo), Thermo Fisher | Quantifies overall cellular health and compound toxicity in parallel with efficacy. |
Within the broader thesis comparing the NBS (Nucleotide-Binding Site) and NACHT (NAIP, CIITA, HET-E, and TP1) domain architectures, this guide examines the functional crosstalk and evolutionary relationships among STAND (Signal Transduction ATPases with Numerous Domains) ATPases. Focusing on the mammalian NLR (NOD-like receptor) family (NBS/NACHT domain-containing), we compare their signal transduction paradigms with the apoptosome-forming APAF-1 and the inflammasome-forming NLRCs (NLR family CARD domain-containing). This objective comparison is framed by performance metrics in oligomerization kinetics, downstream caspase activation, and specificity in pathogen sensing.
Comparative Performance Data
The table below summarizes key experimental data comparing representative STAND ATPases.
Table 1: Comparative Performance Metrics of Selected STAND ATPases
| Feature | NLRP3 (NACHT) | NOD2 (NBS) | APAF-1 (NB-ARC*) | NLRC4 (NACHT) |
|---|---|---|---|---|
| Primary Ligand/Trigger | Diverse PAMPs/DAMPs (e.g., nigericin, ATP, crystals) | Muramyl dipeptide (MDP) | Cytochrome c / dATP | Bacterial flagellin/rod proteins (via NAIPs) |
| Activation Kinetics (Time to Peak Signal) | Slow (30-60 min post-stimulus) | Intermediate (15-30 min) | Rapid (<5 min in vitro) | Very Rapid (2-10 min) |
| Oligomeric Complex Formed | Inflammasome (Pyroptosome) | Nodosome | Apoptosome | Inflammasome |
| Downstream Effector Caspase | Caspase-1 | Caspase-RIPK2 (via CARD) | Caspase-9 | Caspase-1 |
| Key Output | IL-1β/IL-18 maturation, pyroptosis | NF-κB & MAPK activation, inflammation | Caspase-3/7 activation, apoptosis | IL-1β/IL-18 maturation, pyroptosis |
| Specificity Mechanism | Indirect sensing via cellular perturbations | Direct ligand binding to LRR domain | Direct ligand binding to WD40 domain | Direct sensing by NAIPs, relayed to NLRC4 |
NB-ARC: Nucleotide-Binding Apoptotic Protease-Activating Factor, R gene, and Ced-4, is the STAND domain in APAF-1, homologous to NACHT/NBS. *NOD2 activates gene transcription, not direct caspase-mediated proteolysis.
Detailed Experimental Protocols
1. Protocol for In Vitro Apoptosome/Inflammasome Reconstitution & Caspase Activation Assay This protocol is foundational for comparing APAF-1 and NLRC4/NLRP3 activities.
- Materials: Purified recombinant STAND protein (e.g., APAF-1, NLRC4), relevant ligand (cytochrome c for APAF-1, purified flagellin+NAIP for NLRC4), dATP/ATP, recombinant pro-caspase-9 or pro-caspase-1, fluorogenic caspase substrate (Ac-LEHD-AFC for caspase-9, Ac-WEHD-AFC for caspase-1).
- Procedure:
- Complex Assembly: Combine STAND protein (1 µM) with its specific ligand in a buffer containing 20 mM HEPES (pH 7.5), 100 mM NaCl, and 2 mM dATP (for APAF-1) or ATP (for NLRCs). Incubate at 30°C for 30-60 min.
- Caspase Activation: Add recombinant pro-caspase (0.5 µM) to the oligomerization mix. Incubate at 37°C for 30 min.
- Activity Measurement: Transfer reaction to a 96-well plate. Add fluorogenic substrate (200 µM final concentration). Measure fluorescence (excitation/emission ~400/505 nm for AFC) kinetically over 60 minutes using a plate reader.
- Analysis: Calculate initial velocities of substrate cleavage. Compare maximum velocities (Vmax) and time-to-half-maximum activation between different STAND systems.
2. Protocol for Cellular Nodosome Activation Assay (NOD2 vs NLRP3)
- Materials: HEK293T cells (deficient in key NLRs), expression plasmids for NOD2/RIPK2 or NLRP3/ASC/pro-caspase-1, reporter plasmids (NF-κB-luciferase for NOD2, IL-1β promoter-luciferase for NLRP3), specific ligands (MDP for NOD2, nigericin for NLRP3), luciferase assay kit.
- Procedure:
- Transfection: Co-transfect cells with the STAND protein expression plasmid and the appropriate reporter plasmid.
- Stimulation: 24h post-transfection, stimulate cells with ligand or vehicle control.
- Reporter Readout: Lyse cells at specified time points (e.g., 6h for NOD2/NF-κB, 16h for NLRP3/IL-1β). Measure luciferase activity.
- Analysis: Plot dose-response curves for ligand concentration vs. normalized luciferase activity. Compare EC50 values and maximum fold-induction.
Visualization of STAND ATPase Signaling Pathways
Title: STAND ATPase Signaling Pathways Comparison
Title: Evolutionary & Crosstalk Relationships of STAND ATPases
The Scientist's Toolkit: Key Research Reagent Solutions
Table 2: Essential Reagents for STAND ATPase Research
| Reagent | Function/Application | Example Vendor/Cat. No.* |
|---|---|---|
| Recombinant Human/Mouse STAND Proteins | In vitro reconstitution of oligomers (apoptosome/inflammasome) for biochemical studies. | Sino Biological, Novus Biologicals |
| Fluorogenic & Chromogenic Caspase Substrates | Quantitative measurement of caspase-1, -9, -3/7 activity in lysates or purified systems. | BioVision, Cayman Chemical |
| NLR-Specific Agonists/Antagonists | Tool compounds for selective activation/inhibition (e.g., MDP for NOD2, Nigericin for NLRP3, CCCP for APAF-1). | InvivoGen, Sigma-Aldrich |
| Co-immunoprecipitation (Co-IP) Kits | Analysis of protein-protein interactions in nodosome/inflammasome complexes. | Thermo Fisher Scientific, Cell Signaling Technology |
| Cytokine ELISA Kits (IL-1β, IL-18) | Measurement of functional inflammasome output from cell-based assays. | R&D Systems, BioLegend |
| Caspase Activity Assay Kits | Convenient, optimized kits for measuring caspase activity in cells or tissues. | Abcam, Promega |
| NF-κB/MAPK Pathway Reporter Plasmids | Luciferase-based reporters for quantifying NOD2/RIPK2 signaling output. | Addgene, Promega |
Note: Vendor examples are illustrative. Researchers should verify product availability and specifications for their specific model system.
Conclusion
The structural comparison of NBS and NACHT domains reveals a shared evolutionary blueprint adapted for specialized roles in innate immune sensing. While both domains utilize a conserved nucleotide-binding switch mechanism, their integration into different NLR proteins and their associated domains (e.g., LRRs, PYD/CARD) dictate distinct functional outcomes—from pathogen sensing in plants to inflammasome assembly in humans. Understanding these nuances is critical for developing precise therapeutics. Future research must leverage integrative structural biology to capture full-length NLR dynamics and develop allosteric inhibitors. This knowledge will directly translate into novel treatments for a spectrum of inflammatory, autoimmune, and infectious diseases, moving beyond broad immunosuppression to targeted pathway modulation.