Decoding the ATP Hydrolysis Switch in NBS-LRR Proteins: Mechanisms, Methods, and Therapeutic Implications
This article provides a comprehensive analysis of the ATP hydrolysis molecular switch within plant NBS-LRR (Nucleotide-Binding Site Leucine-Rich Repeat) immune receptors, a critical regulatory mechanism for immune signaling.
Decoding the ATP Hydrolysis Switch in NBS-LRR Proteins: Mechanisms, Methods, and Therapeutic Implications
Abstract
This article provides a comprehensive analysis of the ATP hydrolysis molecular switch within plant NBS-LRR (Nucleotide-Binding Site Leucine-Rich Repeat) immune receptors, a critical regulatory mechanism for immune signaling. We explore the foundational structural biology and evolutionary conservation of the NBS domain, detailing the role of specific Walker A, B, and catalytic motifs in nucleotide binding and hydrolysis. Methodologically, we review current biochemical, biophysical, and computational approaches for characterizing ATPase activity, including key assays and potential drug discovery applications. The guide addresses common experimental pitfalls, optimization strategies for kinetic measurements, and techniques for distinguishing hydrolysis from binding events. Finally, we cover validation methods, compare NBS-LRR ATP hydrolysis to related ATPases like AAA+ proteins and animal NLRs, and discuss therapeutic implications. This resource is designed for researchers, structural biologists, and drug development professionals working on plant immunity, innate immune receptors, and nucleotide-driven molecular switches.
Unlocking the ATPase Core: The Structural and Evolutionary Basis of the NBS-LRR Molecular Switch
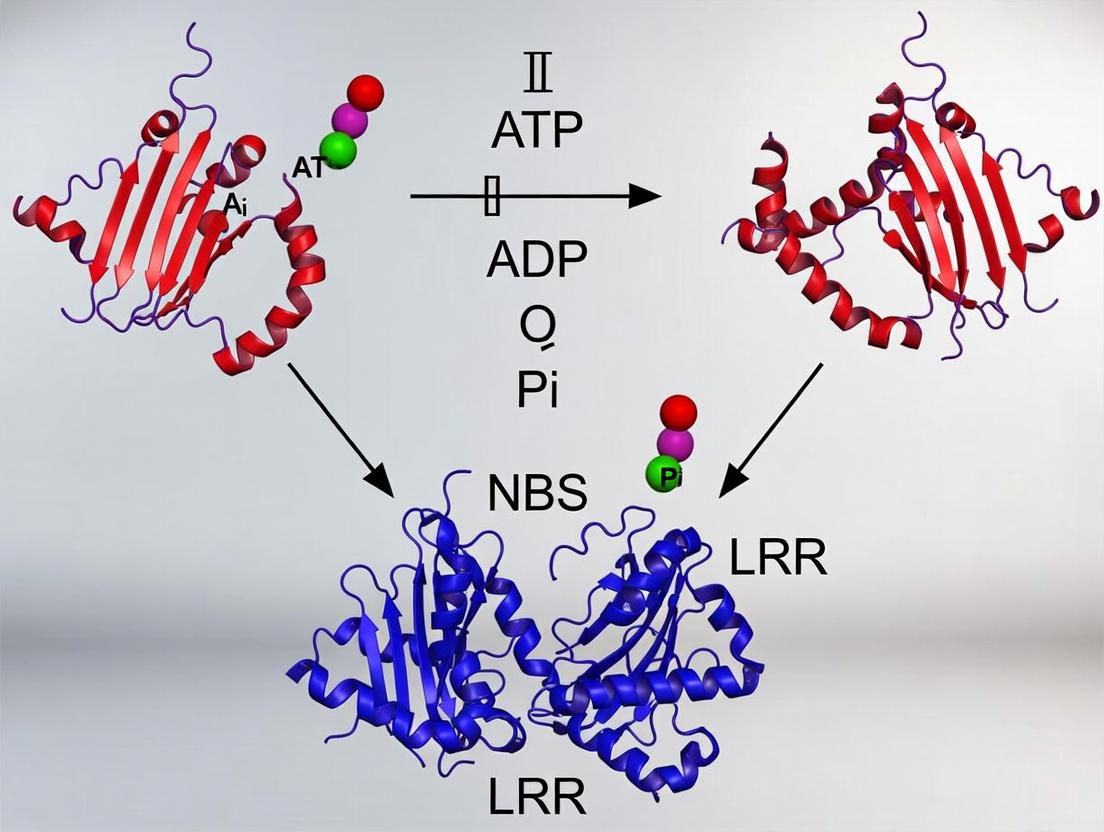
Nucleotide-binding site leucine-rich repeat (NBS-LRR) proteins, encoded by the majority of plant disease resistance (R) genes, constitute the frontline intracellular immune receptors in plant innate immunity. They directly or indirectly perceive specific pathogen effector molecules, triggering a robust defense response known as effector-triggered immunity (ETI). Within the context of advancing molecular switch research, the NBS domain—a conserved molecular engine—undergoes conformational changes and ATP hydrolysis to act as a nucleotide-dependent switch, a critical regulatory node for immune signal transduction.
Molecular Architecture and Classification
NBS-LRR proteins are modular, typically comprising an N-terminal signaling domain, a central nucleotide-binding adaptor shared by APAF-1, R proteins, and CED-4 (NB-ARC) domain, and a C-terminal leucine-rich repeat (LRR) domain.
Table 1: Primary Classification of NBS-LRR Proteins
| Class | N-terminal Domain | Representative Subfamilies | Key Features |
|---|---|---|---|
| TNL | TIR (Toll/Interleukin-1 Receptor) | TIR-NBS-LRR (TNL) | Signals via EDS1/PAD4; common in dicots. |
| CNL | CC (Coiled-Coil) | CC-NBS-LRR (CNL) | Signals via NRG1/ADR1; found in all plants. |
| RNL | RPW8-like CC | RPW8-NBS-LRR (RNL) | Often act as helper NLRs for sensor NLRs. |
The NB-ARC Domain as a Molecular Switch
The NB-ARC domain is a member of the STAND (Signal Transduction ATPases with Numerous Domains) family. Its switch function is governed by nucleotide (ADP/ATP) binding and hydrolysis.
Table 2: Nucleotide-Dependent States of the NB-ARC Molecular Switch
| State | Bound Nucleotide | Conformation | LRR Domain | Signaling Output |
|---|---|---|---|---|
| "Off" (Inactive) | ADP | Closed, autoinhibited | Monitors for effector | Suppressed |
| "On" (Active) | ATP | Open, activated | Effector-bound | Initiated (Oligomerization) |
| Intermediate | ATP hydrolysis transition | Dynamic | - | Signal amplification & termination |
Experimental Protocols for Studying NBS-LRR Activation & ATP Hydrolysis
In VitroATPase Activity Assay (Radioactive)
Objective: Quantify ATP hydrolysis by purified recombinant NBS domain or full-length NBS-LRR protein. Protocol:
- Protein Purification: Express His-tagged NBS protein in E. coli or insect cells. Purify via Ni-NTA affinity chromatography followed by size-exclusion chromatography.
- Reaction Setup: In a 50 µL reaction containing ATPase buffer (20 mM HEPES pH 7.5, 50 mM NaCl, 5 mM MgCl₂), add 1-5 µg purified protein and 1 µCi [γ-³²P]ATP + cold ATP to a final concentration of 100 µM.
- Incubation: Incubate at 25°C for 30-60 minutes.
- Termination & Detection: Stop reaction by adding 50 µL of 5% activated charcoal in 50 mM HCl. Centrifuge. Measure radioactivity in the supernatant (containing released ³²Pi) by liquid scintillation counting.
- Analysis: Calculate hydrolyzed ATP pmol/min/µg protein. Compare mutant (non-hydrolytic, e.g., Walker B mutant D→A) to wild-type.
In PlantaImmune Activation Assay (Agroinfiltration)
Objective: Assess the functional requirement of ATP hydrolysis for immune signaling in vivo. Protocol:
- Construct Cloning: Clone cDNA of wild-type and ATPase-deficient mutant (e.g., K→R in P-loop, D→A in Walker B motif) NBS-LRR into a binary vector under a constitutive promoter (e.g., 35S).
- Agrobacterium Transformation: Transform constructs into Agrobacterium tumefaciens strain GV3101.
- Infiltration: Grow cultures to OD₆₀₀=0.5, resuspend in infiltration buffer (10 mM MES, 10 mM MgCl₂, 150 µM acetosyringone). Pressure-infiltrate into leaves of Nicotiana benthamiana.
- Phenotyping: Monitor hypersensitive response (HR) cell death (collapsed, bleached tissue) at 24-72 hours post-infiltration. Measure ion leakage as a quantitative HR readout.
- Validation: Perform immunoblot to confirm equal protein expression.
Key Diagrams
Diagram Title: NBS-LRR Activation and ATP Hydrolysis Cycle (78 chars)
Diagram Title: In Vitro ATPase Activity Assay Protocol (53 chars)
The Scientist's Toolkit: Research Reagent Solutions
Table 3: Essential Materials for NBS-LRR Molecular Switch Studies
| Item | Function / Application | Example/Supplier Note |
|---|---|---|
| Recombinant NBS Protein | In vitro biochemical assays (ATPase, ITC, SPR). | Purified from E. coli or insect cell expression systems. |
| Anti-Tag Antibodies | Detection and immunoprecipitation of tagged recombinant proteins. | Anti-His, Anti-GST, Anti-FLAG. |
| [γ-³²P]ATP | Radioactive tracer for sensitive quantification of ATP hydrolysis. | PerkinElmer or Hartmann Analytic. |
| ATPase Assay Kit (Colorimetric) | Non-radioactive alternative for phosphate release measurement. | Malachite Green-based kits (e.g., Innova Biosciences). |
| Agrobacterium tumefaciens GV3101 | Transient in planta expression of NBS-LRR constructs. | Standard strain for plant infiltration. |
| Binary Expression Vectors | Cloning and expression of NBS-LRR genes in plants. | pCambia, pEAQ, or pBIN vectors with 35S promoter. |
| Site-Directed Mutagenesis Kit | Generating point mutations in NBS motifs (P-loop, Walker B). | Q5 Site-Directed Mutagenesis Kit (NEB). |
| Size-Exclusion Chromatography Column | Purifying protein oligomers and analyzing complex formation. | Superdex 200 Increase (Cytiva). |
| Conductivity Meter | Quantifying ion leakage as a measure of hypersensitive response (HR). | Essential for in planta functional assays. |
| EDS1/PAD4/NRG1 Antibodies | Validating downstream signaling components in TNL/CNL pathways. | For immunoblot analysis in plant extracts. |
This whitepaper situates the nucleotide-binding site (NBS) domain architecture within the broader thesis of understanding molecular switching and ATP hydrolysis in NBS-LRR (Nucleotide-Binding Site Leucine-Rich Repeat) proteins, central to plant immunity and human innate immunity (e.g., NLR proteins). The NBS domain is a specialized variant of the ancient P-loop NTPase fold, repurposed for regulatory functions in molecular switches. Its adaptations govern the ATP-bound "on" state and hydrolysis-driven "off" state, a cycle critical for immune activation and regulation.
Core Architecture and Quantitative Comparisons
The canonical P-loop NTPase fold comprises a central beta-sheet flanked by alpha-helices, with conserved motifs for nucleotide binding and hydrolysis. The NBS domain retains this core but introduces key sequence and structural modifications tailored for signal transduction.
Table 1: Comparison of Conserved Motifs in Canonical P-loop NTPases vs. NBS Domains
| Motif Name | Canonical P-loop NTPase Function | NBS Domain Adaptation | Proposed Role in NBS-LRR Switching |
|---|---|---|---|
| P-loop (Walker A) | Binds phosphate of NTP | Conserved (GxxxxGK[T/S]) | Binds ATP; mutation locks protein in "on" state. |
| Walker B | Coordinates Mg²⁺, catalyzes hydrolysis | Often degenerate (hhhhDE) | Altered hydrolysis kinetics; D->A mutation stabilizes ATP state. |
| Sensor I | Sense γ-phosphate state | R/C residue in RNBS-A | Confirmation sensor for bound nucleotide. |
| Sensor II | Interdomain communication | K/R residue in RNBS-B | Salt bridge with Walker B glutamate; stabilizes post-hydrolysis state. |
| Switch II (G2) | Conformational change post-hydrolysis | GNMS/T in RNBS-C | Nucleotide-dependent rotation of the WHD domain. |
| MHD Motif | Not present | Conserved Met-His-Asp in RNBS-D | Unique to NLRs; acts as "hydrolysis latch"; His essential for function. |
Table 2: Kinetic Parameters for Selected NBS Domain ATP Hydrolysis
| Protein (Organism) | kcat (min⁻¹) | KM for ATP (µM) | Method | Reference Context |
|---|---|---|---|---|
| Human NLRP1 NBS | ~0.5 - 2 | ~50 - 200 | Malachite Green Phosphate Assay | Basal hydrolysis rate in vitro. |
| Arabidopsis RPS5 NBS | ~1.8 | ~110 | TLC-based ATPase Assay | Autoinhibited state. |
| Mouse NLRC4 NBS | < 0.5 | N/D | In vivo complementation | Tightly autoinhibited; requires activation. |
| Zymoseptoria tritici AvrStb6 | N/A | Binds but does not hydrolyze | Isothermal Titration Calorimetry | Effector co-opts NBS as a binding module. |
Detailed Experimental Protocols
Protocol 1: Malachite Green Phosphate Release Assay for NBS Domain Hydrolysis Principle: Measures inorganic phosphate (Pi) release from ATP over time.
- Protein Purification: Express recombinant NBS domain (e.g., residues 1-200 of NLR protein) with a His-tag in E. coli. Purify via Ni-NTA affinity chromatography followed by size-exclusion chromatography (SEC) in buffer: 20 mM HEPES pH 7.5, 150 mM NaCl, 2 mM MgCl₂, 1 mM TCEP.
- Reaction Setup: In a 96-well plate, mix purified NBS protein (1-5 µM final) in assay buffer (20 mM HEPES pH 7.5, 150 mM NaCl, 5 mM MgCl₂). Initiate reaction by adding ATP (final 1 mM, spiked with [γ-³²P]ATP for validation if needed). Incubate at 30°C.
- Phosphate Detection: At time points (0, 5, 15, 30, 60 min), stop 50 µL reaction by adding 100 µL of Malachite Green reagent (0.045% malachite green, 4.2% ammonium molybdate in 4N HCl, with 0.05% Tween-20). Incubate 1-5 min at RT.
- Quantification: Measure A620nm. Compare to a standard curve of K2HPO4 (0-100 nmol Pi). Calculate rate (nmol Pi min⁻¹ µg⁻¹) and derive kcat.
Protocol 2: Crystallography of NBS Domain-Nucleotide Complexes Principle: Determine atomic structure to visualize adaptations.
- Complex Formation: Incubate purified NBS domain with 5 mM ATP or ADP, plus 10 mM MgCl₂/AlCl₃/NaF to generate transition-state analogs (e.g., ADP•AlF3).
- Crystallization: Use vapor diffusion in sitting drops. Common condition: 0.1 M MES pH 6.5, 12-18% PEG 3350, 0.2 M Ammonium acetate.
- Data Collection & Analysis: Flash-freeze crystals in liquid N2. Collect data at synchrotron source (>2.0 Å resolution). Solve structure by molecular replacement using a canonical P-loop NTPase fold (e.g., PDB: 1G3P) as a search model. Analyze differences in motifs (Walker B, MHD) and domain orientations.
Visualizations
Title: NBS-LRR Molecular Switch Cycle
Title: NBS Domain Structural Adaptation from P-loop Core
The Scientist's Toolkit: Research Reagent Solutions
Table 3: Essential Reagents for NBS Domain ATP Hydrolysis Research
| Item | Function/Description | Example Product/Catalog # |
|---|---|---|
| Recombinant NBS Protein | Purified functional domain for in vitro assays. | Custom expression in E. coli (pET vector) or Baculovirus system for mammalian NBS domains. |
| Malachite Green Assay Kit | Colorimetric quantification of inorganic phosphate. | Sigma-Aldrich MAK307; includes malachite green, stabilizer, and phosphate standard. |
| Non-hydrolyzable ATP Analogs | Trap NBS domain in active conformation for structural studies. | ATPγS (Roche), AMP-PNP (Jena Bioscience NU-405), ADP•BeF₃ crystals. |
| Radioisotope [γ-³²P]ATP | High-sensitivity measurement of hydrolysis kinetics. | PerkinElmer NEG002Z, used in TLC or charcoal-binding assays. |
| Size-Exclusion Chromatography (SEC) Column | Purify monodisperse, folded NBS protein. | Cytiva HiLoad 16/600 Superdex 75 pg or 200 pg. |
| Crystallization Screen Kits | Initial screening of crystallization conditions for NBS-nucleotide complexes. | Hampton Research Index HT, JC SG Suite. |
| Anti-Phospho-Antibody (if applicable) | Detect in vivo phosphorylation changes upon NBS activation. | Custom phospho-specific antibodies against NBS serines/threonines. |
| ITC/MST Kits | Measure nucleotide binding affinity (KD). | MicroCal ITC, NanoTemper Monolith NT.115 capillary system. |
Within the regulatory mechanism of plant Nucleotide-Binding Site Leucine-Rich Repeat (NBS-LRR) immune receptors, ATP hydrolysis acts as a critical molecular switch controlling the transition from an inactive to an active defense signaling state. This whitepaper provides an in-depth technical analysis of the four core protein motifs—Walker A, Walker B, RNBS-A, and the catalytic arginine finger—that orchestrate ATP binding and hydrolysis within the nucleotide-binding domain (NBD) of NBS-LRR proteins. Understanding the precise coordination of these motifs is fundamental to elucidating immune activation and offers high-value targets for engineering disease resistance and developing novel plant protection agents.
NBS-LRR proteins are intracellular immune receptors that recognize pathogen effectors, initiating a robust defense response. Their activity is governed by nucleotide-dependent conformational changes, analogous to AAA+ ATPases and GTPases. In the resting state, the NBD binds ADP, maintaining the protein in an auto-inhibited "OFF" state. Upon effector recognition, ADP is exchanged for ATP, stabilizing an active "ON" state conformation that initiates downstream signaling. The subsequent hydrolysis of ATP to ADP + Pi returns the protein to the inactive state, resetting the switch. The kinetics and regulation of this cycle are dictated by the conserved motifs detailed herein.
In-Depth Analysis of Core Motifs
Walker A Motif (P-loop)
Consensus: GxxxxGK[T/S] (where x is any amino acid) Structural Role: The Walker A motif, or phosphate-binding loop (P-loop), forms a flexible loop between a beta-strand and an alpha-helix. The conserved lysine (K) residue coordinates the beta- and gamma-phosphates of ATP, while the serine/threonine hydroxyl group stabilizes the Mg2+ ion essential for catalysis. Functional Data:
Table 1: Functional Impact of Walker A Mutations in Model NBS-LRR Proteins
| Protein (Species) | Mutation | Effect on ATP Binding (Kd) | Effect on Hydrolysis (kcat) | Phenotype | Reference |
|---|---|---|---|---|---|
| NRC4 (Solanum lycopersicum) | K222R | >100-fold increase | Undetectable | Loss-of-function, compromised cell death | (Duxbury et al., 2020) |
| I-2 (S. lycopersicum) | G198A | Severely impaired | Not measured | Loss of resistance to Fusarium oxysporum | (Tameling et al., 2002) |
| MLA10 (Hordeum vulgare) | K211M | Abolished | Abolished | Constitutive activation, autoactive cell death | (Bai et al., 2012) |
Walker B Motif
Consensus: hhhhDE (where 'h' is hydrophobic residue) Structural Role: The Walker B motif comprises a beta-strand followed by a conserved aspartate-glutamate (DE) diad. The hydrophobic residues contribute to the structural core. The aspartate (D) coordinates the essential Mg2+ ion, while the glutamate (E) activates a water molecule for a nucleophilic attack on the gamma-phosphate of ATP. Functional Data:
Table 2: Functional Impact of Walker B Mutations
| Protein | Mutation | Mg2+ Coordination | Hydrolysis Activity | Consequence |
|---|---|---|---|---|
| Theoretical/Consensus | D → N | Lost | Abolished | ATP-bound "ON" state locked, often autoactive |
| Theoretical/Consensus | E → Q | Perturbed | Severely reduced (<10% WT) | Slowed reset, prolonged signaling |
RNBS-A Motif (Sensor 1)
Consensus: [F/L]xxR[F/L]xR Context in NBS-LRRs: The RNBS-A motif is a variant of the "Sensor 1" motif found in AAA+ ATPases. It is located on a helix that packs against the Walker B strand. Role: The central arginine (R) within this motif acts as a sensor for the nucleotide state. It forms hydrogen bonds with the gamma-phosphate of ATP. Upon hydrolysis to ADP, this interaction is broken, allowing the motif to shift, thereby communicating the nucleotide state to adjacent domains (e.g., LRR, helical domains) and facilitating conformational change.
Catalytic Arginine Finger
Origin: Typically supplied in trans from an adjacent protomer in oligomeric AAA+ proteins. In many NBS-LRR proteins, which function as monomers or dimers, this arginine is often provided in cis from a separate region of the NBD or by a helper protein. Mechanism: The arginine finger inserts into the catalytic site from an adjacent structural element. It stabilizes the pentavalent transition state during ATP hydrolysis by neutralizing negative charge on the gamma-phosphate. Its positioning is often dependent on the active, ATP-bound conformation, making it a key catalytic trigger.
Experimental Protocols for Motif Analysis
In Vitro ATPase Activity Assay (Radioactive TLC)
Objective: Quantify ATP hydrolysis kinetics of wild-type and mutant NBD proteins. Protocol:
- Protein Purification: Express and purify recombinant NBD (e.g., residues 1-300 of target NBS-LRR) with an N-terminal GST or His6 tag from E. coli using affinity chromatography.
- Reaction Setup: In a 20 µL reaction, combine: 2 µM purified protein, 50 mM Tris-HCl (pH 7.5), 10 mM MgCl2, 1 mM DTT, and 100 µM ATP spiked with [γ-32P]ATP (~0.1 µCi per reaction).
- Incubation: Incubate at 25°C for time points (e.g., 0, 5, 15, 30, 60 min).
- Termination & Spotting: Stop reactions with 5 µL of 0.5 M EDTA. Spot 1 µL of each reaction onto a polyethyleneimine (PEI)-cellulose TLC plate.
- Chromatography: Develop TLC plate in 0.5 M LiCl / 1 M formic acid solution. ATP migrates slower; the released inorganic phosphate (Pi) migrates faster.
- Quantification: Expose plate to a phosphor screen, image with a phosphorimager, and quantify spots using ImageQuant software. Calculate hydrolysis rate (nmol Pi/min/µg protein).
Isothermal Titration Calorimetry (ITC) for ATP Binding
Objective: Measure binding affinity (Kd), stoichiometry (n), and thermodynamics (ΔH, ΔS) of ATP binding. Protocol:
- Sample Preparation: Dialyze purified NBD protein extensively into ITC buffer (20 mM HEPES pH 7.5, 150 mM NaCl, 5 mM MgCl2). Dissolve ATP in the final dialysis buffer.
- Instrument Setup: Load the protein (50-100 µM) into the sample cell. Load ATP (10x concentrated) into the syringe.
- Titration: Perform a series of injections (e.g., 19 injections of 2 µL) at 25°C with constant stirring.
- Data Analysis: Fit the raw heat data (µcal/sec vs. time) using a one-site binding model (e.g., in MicroCal PEAQ-ITC analysis software) to extract Kd and ΔH.
In Planta Complementation & Cell Death Assay
Objective: Test the functional significance of motif mutations in immune signaling. Protocol:
- Construct Generation: Clone full-length cDNA of the NBS-LRR gene into a plant binary vector (e.g., pEAQ-HT or pBIN19). Introduce point mutations (e.g., Walker A K→R) via site-directed mutagenesis.
- Agroinfiltration: Transform constructs into Agrobacterium tumefaciens strain GV3101. Infiltrate suspensions (OD600 = 0.5) into leaves of Nicotiana benthamiana.
- Phenotypic Scoring: Monitor infiltrated patches daily for 3-7 days for the appearance of a hypersensitive response (HR) cell death (collapsed, necrotic tissue).
- Experimental Groups: Include: (a) Empty vector control (no death), (b) Wild-type NBS-LRR (may require co-expression of its cognate effector for death), (c) Autoactive mutant (death without effector), (d) Catalytic dead mutant (K→R, E→Q; no death even with effector).
Signaling Pathway and Workflow Visualizations
Diagram Title: NBS-LRR ATP Hydrolysis Molecular Switch Cycle
Diagram Title: Experimental Workflow for Motif Functional Analysis
The Scientist's Toolkit: Research Reagent Solutions
Table 3: Essential Reagents for ATPase & Binding Studies in NBS-LRR Research
| Reagent / Solution | Supplier Examples | Function & Application Notes |
|---|---|---|
| [γ-32P]ATP | PerkinElmer, Hartmann Analytic | Radioactive tracer for sensitive detection of ATP hydrolysis in TLC or filter-binding assays. Critical for measuring low enzymatic rates. |
| PEI-Cellulose TLC Plates | Sigma-Aldrich, Merck | Stationary phase for separating ATP from inorganic phosphate (Pi) in radioactive hydrolysis assays. |
| Recombinant NBD Protein | Custom expression in E. coli (e.g., using pGEX or pET vectors) | Purified nucleotide-binding domain is essential for in vitro biochemical characterization (ITC, SPR, crystallography). |
| ITC Buffer Kit | Malvern Panalytical, Cytiva | Pre-formulated, degassed buffer kits ensure optimal baseline stability for sensitive calorimetric binding measurements. |
| Site-Directed Mutagenesis Kit | Agilent (QuikChange), NEB (Q5) | For introducing precise point mutations (e.g., K222R) into NBS-LRR clones to test motif function. |
| Plant Binary Vector (e.g., pEAQ-HT) | Addgene, custom | High-throughput expression vector for transient expression in N. benthamiana via agroinfiltration. |
| A. tumefaciens Strain GV3101 | Laboratory stock, CICC | Standard disarmed strain for delivering T-DNA encoding NBS-LRR constructs into plant cells. |
| HR Cell Death Staining (Trypan Blue) | Sigma-Aldrich | Histochemical stain that selectively colors dead plant tissue, visualizing the hypersensitive response. |
Within the broader thesis on Nucleotide-Binding Site Leucine-Rich Repeat (NBS-LRR) proteins, the "molecular switch" paradigm is a foundational mechanistic concept. NBS-LRRs, central to innate immunity in plants and analogous to STAND (Signal Transduction ATPases with Numerous Domains) proteins in animals, function as switchable molecular machines. Their activity is governed by the nucleotide-bound state of their conserved NB-ARC (NBS-APAF-1, R proteins, and CED-4) or NACHT domains. This whitepaper provides an in-depth technical guide to the core principles of ATP/ADCP cycling in controlling receptor activation and inactivation, with a focus on experimental approaches relevant to NBS-LRR research.
Core Mechanistic Principles
The switch operates on a conserved biochemical principle: ATP binding induces an active, signaling-competent conformation, while ATP hydrolysis to ADP triggers inactivation. ADP/ATP exchange resets the switch. In NBS-LRR proteins, the switch is auto-inhibited in the ADP-bound state. Pathogen effector perception often facilitates ADP-to-ATP exchange, provoking a conformational change that unleashes oligomerization and downstream signaling cascades.
Table 1: Key Kinetic and Thermodynamic Parameters for Model NBS-LRR/STAND Proteins
| Protein (Example) | Kd for ATP (µM) | Kd for ADP (µM) | Hydrolysis Rate (kcat, min⁻¹) | Oligomeric State (Active) | Reference System |
|---|---|---|---|---|---|
| APAF-1 | 1 - 10 | 0.1 - 1 | ~0.02 | Heptameric "Apoptosome" | Mammalian Apoptosis |
| NLRC4 | ~5 | ~0.5 | 0.05 - 0.1 | Inflammasome Filament | Mouse Innate Immunity |
| Plant NBS-LRR (ZAR1) | < 5 (inactive) | ~0.3 (resting) | > 0.5 (activated) | Pentameric "Resistosome" | Arabidopsis Immunity |
| NOD2 | 10 - 50 | 1 - 5 | < 0.01 | Dimer/Filament | Human Intracellular Sensing |
Table 2: Consequences of Mutations in the Nucleotide-Binding P-Loop Motif
| Mutation (GxGGxGKT → GxGGxGKT) | Nucleotide Binding | Hydrolysis | Constitutive Activity? | Phenotypic Outcome |
|---|---|---|---|---|
| Lys (K) to Arg (R) | Maintained | Severely Reduced/Abrogated | Yes | Autoactive cell death, disease resistance. |
| Lys (K) to Met (M) | Abolished | Abolished | No | Loss-of-function; pathogen susceptibility. |
| Thr (T) to Ser (S) | Maintained | Altered (Often Reduced) | Sometimes | Often autoactive; used to study activation. |
Experimental Protocols for Core Analyses
Protocol 1: Measuring Nucleotide Binding Affinity via Fluorescence Polarization (FP)
- Reagent Preparation: Purify recombinant NBS domain protein. Label a non-hydrolyzable ATP analog (e.g., ATPγS, TNP-ATP) or use fluorescent ATP/ADP derivatives (Mant-ATP/Mant-ADP).
- Assay Setup: In a black 384-well plate, mix fixed concentration of fluorescent nucleotide (e.g., 10 nM Mant-ATP) with serially diluted protein (e.g., 1 nM to 100 µM) in binding buffer (20 mM HEPES pH 7.5, 150 mM NaCl, 5 mM MgCl2, 1 mM DTT).
- Measurement: Incubate for 15-30 min at RT. Measure fluorescence polarization (mP units) using a plate reader with appropriate filters (ex: 355 nm, em: 460 nm for Mant).
- Analysis: Plot mP vs. log[Protein]. Fit data to a one-site specific binding model to derive Kd.
Protocol 2: In Vitro ATP Hydrolysis Assay (Malachite Green Phosphate Detection)
- Reaction Setup: In a 96-well plate, combine purified full-length or NBS protein (1-5 µM) in hydrolysis buffer (25 mM Tris pH 7.5, 150 mM NaCl, 10 mM MgCl2) with 500 µM ATP. Include a no-enzyme control and a phosphate standard curve.
- Kinetics: Incubate at 25°C or 30°C. Remove aliquots (e.g., 50 µL) at set time points (0, 5, 15, 30, 60 min) and quench with 50 µL of 0.6 M HClO4 on ice.
- Phosphate Detection: Neutralize quenched samples with an equal volume of 1 M K2CO3. Centrifuge to precipitate KClO4. Transfer 80 µL of supernatant to a fresh plate. Add 20 µL of Malachite Green reagent (0.045% malachite green, 4.2% ammonium molybdate in 4N HCl, with 0.1% Tween-20). Incubate 15 min.
- Measurement & Analysis: Read absorbance at 620 nm. Calculate released phosphate (Pi) from the standard curve. Plot Pi vs. time; slope gives hydrolysis rate.
Protocol 3: Determining In Vivo Nucleotide Occupancy via Immunoprecipitation
- Cell Lysis: Lyse expressing cells (e.g., plant tissue, mammalian HEK293T) in non-denaturing, nucleotide-stabilizing lysis buffer (e.g., 50 mM Tris pH 7.5, 150 mM NaCl, 10% glycerol, 10 mM MgCl2, 0.5% NP-40, protease inhibitors). Critical: Avoid chelators (EDTA) and perform rapidly on ice.
- Immunoprecipitation (IP): Incubate lysate with antibody against the NBS-LRR protein or an affinity tag for 1-2 hours at 4°C. Capture with Protein A/G beads.
- Nucleotide Extraction: Wash beads 3x with lysis buffer without detergent. Elute bound nucleotides by incubating beads with 100 µL of 2% formic acid, 5 mM EDTA for 30 min on ice.
- Analysis: Clarify supernatant and analyze via HPLC (anion-exchange or reverse-phase) or LC-MS/MS to quantify and identify ATP vs. ADP ratios. Compare wild-type to hydrolysis-deficient mutants.
Signaling Pathway Visualization
Diagram Title: ATP/ADP Switch Cycle in NBS-LRR Activation
Diagram Title: Workflow for In Vivo Nucleotide Occupancy Assay
The Scientist's Toolkit: Research Reagent Solutions
Table 3: Essential Reagents for Molecular Switch Studies
| Reagent/Material | Function & Critical Specification |
|---|---|
| Non-hydrolyzable ATP Analogs (ATPγS, AMP-PNP, AMP-PCP) | Used to trap the active conformation for structural studies (e.g., crystallography) or to demonstrate ATP-binding dependency without hydrolysis. |
| Fluorescent Nucleotides (Mant-ATP, Mant-ADP, TNP-ATP) | Directly measure nucleotide binding affinity and kinetics via Fluorescence Polarization (FP) or FRET assays. |
| Malachite Green Phosphate Assay Kit | Colorimetric detection of inorganic phosphate (Pi) released from ATP hydrolysis; enables kinetic measurement of hydrolysis rates (kcat). |
| Radiolabeled Nucleotides ([γ-³²P]ATP, [α-³²P]ATP) | Gold-standard for ultra-sensitive measurement of binding (filter assays) and hydrolysis (TLC separation of ATP from ADP/Pi). |
| Size Exclusion Chromatography (SEC) Columns (e.g., Superose 6 Increase) | Analyze nucleotide-dependent oligomeric state changes of the receptor (monomer vs. oligomer). |
| Anti-Tag Antibody Beads (Anti-FLAG, Anti-GST, Anti-His) | For gentle, non-denaturing immunoprecipitation of recombinant or expressed proteins to analyze co-purifying nucleotides. |
| HPLC or LC-MS/MS System | For definitive identification and quantification of nucleotides (ATP, ADP, AMP) eluted from purified protein complexes. |
| Hydrolysis-Deficient Mutant Constructs (K→R in P-loop) | Essential positive control for constitutive activity in vivo and for distinguishing binding vs. hydrolysis events in vitro. |
Nucleotide-binding site leucine-rich repeat (NBS-LRR) proteins are central molecular switches in plant innate immunity. Their activation triggers a conformational change from an auto-inhibited off-state to an active on-state, a process powered by the hydrolysis of nucleoside triphosphates (ATP/dATP). This whitepaper examines the evolutionary conservation and divergence of the core ATP hydrolysis mechanism within the NBS domains of plant resistance (R) proteins. Understanding these nuances is critical for manipulating immune signaling pathways and informs broader structural biology principles of molecular switch regulation.
Core ATP Hydrolysis Mechanism: Structural & Kinetic Foundations
The NBS domain contains conserved motifs (P-loop, RNBS-A, RNBS-B, GLPL, RNBS-D, MHD) that coordinate nucleotide binding and hydrolysis. The hydrolysis event is a magnesium-dependent process that provides the free energy for large-scale conformational rearrangements.
Key Conserved Catalytic Residues
- P-loop (Walker A): Binds the phosphate moiety of ATP.
- Walker B Motif: Coordinates the Mg²⁺ ion essential for catalysis.
- Sensor-1 (RNBS-A) & Arginine Finger (RNBS-B): Stabilize the transition state.
- MHD Motif: Acts as a "molecular latch"; the aspartate often coordinates the Mg²⁺ or a water molecule, and its mutation frequently leads to constitutive activation.
Quantitative Data on ATP Hydrolysis Across Plant Species
Comparative kinetic studies across model and crop species reveal a pattern of conserved catalytic efficiency with species-specific regulatory tweaks.
Table 1: Kinetic Parameters of ATP Hydrolysis for Representative NBS-LRR Proteins
| Protein (Species) | Gene Locus / Type | Km for ATP (μM) | kcat (s⁻¹) | kcat/Km (μM⁻¹s⁻¹) | Key Regulatory Feature | Reference (Example) |
|---|---|---|---|---|---|---|
| APAF-1-like (Arabidopsis thaliana) | RPS5 (CNL) | 12.5 ± 1.8 | 0.15 ± 0.02 | 0.012 | MHD latch stringent | Takken et al., 2006 |
| NRC4 (Solanum lycopersicum) | Helper CNL | 8.7 ± 1.2 | 0.22 ± 0.03 | 0.025 | High basal turnover | Wu et al., 2017 |
| MLA10 (Hordeum vulgare) | CC-NLR | 25.3 ± 3.5 | 0.08 ± 0.01 | 0.0032 | Tight autoinhibition | Maekawa et al., 2011 |
| Sr35 (Triticum aestivum) | CC-NLR | 15.1 ± 2.1 | 0.18 ± 0.03 | 0.0119 | Oligomerization-dependent | Förderer et al., 2022 |
| ZAR1 (Arabidopsis thaliana) | CC-NLR (Resistosome) | 5.5 ± 0.9* | 0.05 ± 0.01* | 0.0091* | Activation by pseudokinase | Wang et al., 2019 |
*Kinetics measured for the active oligomeric (resistosome) state.
Table 2: Evolutionary Divergence in NBS Motif Sequences Affecting Hydrolysis
| Motif | Consensus (Highly Conserved) | Divergent Example (Species) | Functional Implication |
|---|---|---|---|
| Walker B | DDVW | DDLW (Some Solanaceae CNLs) | Altered Mg²⁺ coordination, potentially slower hydrolysis. |
| RNBS-B (Arginine Finger) | KKLRI | RRLRV (Some Poaceae NLRs) | May affect transition state stabilization efficiency. |
| MHD | MHD | MHE (Shorter-lived signaling?) | Asp→Glu change preserves negative charge but alters latch stability. |
| GLPL | GLPLA | GLPFA (Certain TNLs) | Potential impact on post-hydrolysis conformational relay. |
Experimental Protocols for ATP Hydrolysis Analysis
Protocol: Recombinant NBS Domain Protein Purification for Kinetics
- Cloning: Amplify the NBS domain (c. 300-450 aa) from the target NLR gene and clone into an expression vector (e.g., pET28a with N-terminal His-tag).
- Expression: Transform into E. coli BL21(DE3). Grow culture to OD₆₀₀ ~0.6 at 37°C, induce with 0.5 mM IPTG, and incubate at 18°C for 16-18 hours.
- Purification: Lyse cells in Lysis Buffer (50 mM Tris-HCl pH 8.0, 300 mM NaCl, 10 mM imidazole, 5% glycerol, 1 mM PMSF). Clarify supernatant and apply to Ni-NTA agarose resin. Wash with Wash Buffer (20 mM imidazole). Elute with Elution Buffer (250 mM imidazole).
- Size-Exclusion Chromatography (SEC): Further purify using a Superdex 200 Increase column pre-equilibrated with Kinetics Buffer (25 mM HEPES pH 7.5, 150 mM NaCl, 2 mM MgCl₂, 1 mM TCEP). Collect the monomeric peak.
- Concentration & Validation: Concentrate protein using Amicon centrifugal filters, quantify via A₂₈₀, and verify purity by SDS-PAGE.
Protocol: Continuous Coupled ATPase Assay
This spectrophotometric assay measures ADP production by coupling it to the oxidation of NADH.
- Reaction Mix: Prepare 1 mL final volume in Kinetics Buffer containing: 2 mM phospho(enol)pyruvate (PEP), 20 U/mL pyruvate kinase (PK), 20 U/mL lactate dehydrogenase (LDH), 0.2 mM NADH, and varying concentrations of ATP (e.g., 5–200 μM).
- Baseline: Incubate mix at 25°C in a spectrophotometer cuvette. Monitor A₃₄₀ until stable.
- Initiation: Add purified NBS protein to a final concentration of 50-200 nM. Mix rapidly.
- Measurement: Record the decrease in A₃₄₀ (ε₃₄₀ NADH = 6220 M⁻¹cm⁻¹) for 10-20 minutes. Use the initial linear rate for calculations.
- Analysis: Convert rate to ADP produced per second. Plot velocity vs. [ATP] and fit data to the Michaelis-Menten equation using software (e.g., GraphPad Prism) to derive Km and kcat.
Visualizing Signaling Pathways and Workflows
NLR Activation via ATP Hydrolysis
ATPase Kinetics Comparative Workflow
The Scientist's Toolkit: Key Research Reagent Solutions
Table 3: Essential Reagents for NBS ATP Hydrolysis Research
| Reagent / Material | Function / Application | Example Vendor / Cat. No. (Illustrative) |
|---|---|---|
| pET Series Vectors | High-level expression of recombinant NBS domains with His-tags for purification. | Novagen (Merck) |
| Ni-NTA Superflow Resin | Immobilized metal affinity chromatography (IMAC) for purifying His-tagged proteins. | Qiagen |
| Superdex 200 Increase | Size-exclusion chromatography (SEC) columns for polishing and oligomeric state analysis. | Cytiva |
| Pyruvate Kinase / Lactate Dehydrogenase (PK/LDH) Enzyme Mix | Essential coupling enzymes for the continuous ATPase assay. | Sigma-Aldrich P0294 |
| NADH, Disodium Salt | Spectrophotometric substrate for the coupled ATPase assay (decrease at 340 nm). | Roche 10107735001 |
| Phospho(enol)pyruvate (PEP) | Substrate for the PK reaction in the coupled assay, regenerating ATP from ADP. | Sigma-Aldrich P0564 |
| HALT Protease Inhibitor Cocktail | Prevents proteolysis of recombinant NBS domains during purification. | Thermo Fisher 78429 |
| Site-Directed Mutagenesis Kit | For creating point mutations in conserved motifs (e.g., MHD→MHH). | Agilent QuikChange |
| MicroScale Thermophoresis (MST) Capillaries | Alternative method for measuring nucleotide binding affinity (Kd). | NanoTemper Technologies |
From Bench to Drug Discovery: Methods for Probing ATP Hydrolysis Activity and Its Applications
This technical guide details two core biochemical assays critical for elucidating the ATP hydrolysis mechanism of Nucleotide-Binding Site Leucine-Rich Repeat (NBS-LRR) proteins. These molecular switches, central to plant innate immunity and implicated in human inflammatory diseases, undergo conformational changes regulated by nucleotide binding and hydrolysis. The Malachite Green assay provides a quantitative measure of inorganic phosphate (Pi) release, directly reporting on hydrolytic activity. Thin-Layer Chromatography (TLC)-based nucleotide analysis complements this by visualizing the interconversion of nucleotide states (ATP, ADP, AMP). Together, these assays are indispensable for characterizing the enzymatic kinetics and allosteric regulation of NBS-LRR proteins, informing drug discovery efforts aimed at modulating this pathway.
The Malachite Green Phosphate Release Assay
Principle
The Malachite Green assay is a colorimetric method for quantifying inorganic phosphate. In an acidic environment, malachite green, ammonium molybdate, and phosphate form a stable green complex with an absorption maximum at 620-650 nm. The intensity is proportional to Pi concentration, enabling real-time or endpoint measurement of ATP hydrolysis.
Detailed Protocol
Reagents:
- Malachite Green Solution: 0.045% (w/v) Malachite Green hydrochloride in dH₂O. Filter through 0.2 µm.
- Ammonium Molybdate Solution: 4.2% (w/v) Ammonium molybdate tetrahydrate in 4M HCl.
- Stabilizer: 0.1% (w/v) Polyvinyl Alcohol (PVA, MW 10,000) in dH₂O (heated to dissolve).
- Working Reagent: Combine 1 volume Malachite Green, 1 volume Ammonium Molybdate, and 0.5 volumes Stabilizer. Prepare fresh daily.
- Pi Standard Solution: 1 mM KH₂PO₄ in dH₂O.
Procedure:
- Reaction Setup: In a 96-well plate, combine purified NBS-LRR protein (e.g., 0.1-1 µM) in assay buffer (e.g., 20 mM HEPES pH 7.5, 50 mM NaCl, 5 mM MgCl₂) with ATP (typical range 10 µM - 1 mM). Total reaction volume: 30-50 µL.
- Incubation: Incubate at desired temperature (e.g., 25°C or 30°C) for a defined time (e.g., 0-60 min).
- Reaction Termination & Development: Add 100-150 µL of Malachite Green Working Reagent directly to the well to stop the reaction.
- Color Development: Incubate at room temperature for 15-30 minutes for stable color development.
- Measurement: Read absorbance at 620 nm using a microplate reader.
- Standard Curve: Include a standard curve with Pi concentrations from 0 to 50 nmol per well in the same plate.
Key Considerations & Optimization
- Interference: Avoid buffers containing >1 mM free phosphate (e.g., PBS). Detergents like Triton X-100 can interfere; limit to <0.01%.
- Timing: The color complex is stable for ~1 hour. Read all samples within a consistent window.
- Protein Concentration: Must be optimized to ensure the hydrolysis rate is linear with time and enzyme concentration.
Table 1: Example Kinetic Parameters for a Model NBS-LRR Protein (e.g., Arabidopsis ZAR1) Derived from Malachite Green Assay
| Substrate | Km (µM) | kcat (min⁻¹) | Vmax (nmol Pi/min/µg) | Optimal [Mg²⁺] (mM) | pH Optimum |
|---|---|---|---|---|---|
| ATP | 125 ± 15 | 2.8 ± 0.3 | 0.45 ± 0.05 | 5 | 7.5 |
| dATP | 95 ± 20 | 1.2 ± 0.2 | 0.19 ± 0.03 | 5 | 7.5 |
| GTP | >500 | 0.1 ± 0.05 | 0.02 ± 0.01 | 5 | 7.5 |
Note: Values are illustrative based on recent literature. Actual parameters vary by specific NBS-LRR protein and oligomerization state.
TLC-based Nucleotide Analysis
Principle
This assay separates nucleotides (ATP, ADP, AMP) by their differential migration on a cellulose or polyethyleneimine (PEI)-cellulose matrix using a specific solvent system. Radiolabeled [γ-³²P]ATP or [α-³²P]ATP is typically used, allowing autoradiography or phosphorimaging for high-sensitivity detection of substrate consumption and product formation.
Detailed Protocol
Reagents & Materials:
- TLC Plates: Polyethylenimine (PEI)-Cellulose F plates.
- Radiolabeled Substrate: [γ-³²P]ATP or [α-³²P]ATP (~3000 Ci/mmol, 10 mCi/mL).
- Solvent System: 0.8 M LiCl / 1.0 M Formic Acid. Adjust pH if necessary.
- Cold Nucleotide Standards: 10 mM each of ATP, ADP, AMP in dH₂O.
- Developing Chamber: Glass tank with lid.
Procedure:
- Reaction Setup: Perform hydrolysis reaction similar to 2.2, but with addition of trace radiolabeled ATP (e.g., 0.1 µCi per 10 µL reaction).
- Reaction Termination: At various time points (e.g., 0, 2, 5, 15, 30 min), remove 1-2 µL aliquots and spot directly onto the origin line of a PEI-cellulose TLC plate. Immediately dry with a cold air stream.
- Spotting Standards: On a separate lane, spot 1 µL of each cold nucleotide standard (ATP, ADP, AMP) to serve as migration markers.
- Chromatography: Place the dried plate in a tank pre-equilibrated with the LiCl/Formic Acid solvent. Develop until the solvent front is ~1 cm from the top (~45-60 min).
- Drying & Visualization: Air-dry the plate completely. Wrap in plastic wrap and expose to a phosphor storage screen overnight. Image using a phosphorimager. Alternatively, perform autoradiography with X-ray film.
- Quantification: Use image analysis software (e.g., ImageQuant) to quantify the spot intensity for each nucleotide. Calculate the percentage of total radioactivity in each species.
Key Considerations & Optimization
- Safety: Strict adherence to radioactive safety protocols is mandatory.
- Spotting: Keep spots as small as possible (<3 mm diameter) for better resolution.
- Solvent Freshness: Use freshly prepared solvent for consistent Rf values.
- Non-Radioactive Alternative: Fluorescent or UV-active ATP analogs can be used with appropriate imaging systems.
Table 2: Example Time-Course Nucleotide Distribution for NBS-LRR ATP Hydrolysis via TLC Analysis
| Time Point (min) | ATP (%) | ADP (%) | AMP (%) | Inorganic Phosphate (Pi)* |
|---|---|---|---|---|
| 0 | 98.5 ± 0.5 | 1.5 ± 0.5 | 0 | 0 |
| 5 | 75.2 ± 3.1 | 24.1 ± 2.8 | 0.7 ± 0.3 | Detected |
| 15 | 45.8 ± 4.5 | 50.5 ± 4.0 | 3.7 ± 0.9 | Detected |
| 30 | 22.4 ± 3.8 | 68.9 ± 3.5 | 8.7 ± 1.2 | Detected |
| 60 | 8.1 ± 2.1 | 75.3 ± 3.8 | 16.6 ± 2.5 | Detected |
*Pi migrates near the solvent front with this system and is clearly separated from nucleotides. Percentages may not sum to 100 due to Pi separation.
The Scientist's Toolkit: Essential Research Reagents & Materials
Table 3: Key Research Reagent Solutions for NBS-LRR ATP Hydrolysis Studies
| Reagent/Material | Supplier Examples | Critical Function & Notes |
|---|---|---|
| Recombinant NBS-LRR Protein | In-house purification | Active, purified protein (monomeric or oligomeric) is the essential enzyme source. |
| Adenosine 5'-triphosphate (ATP) | Sigma-Aldrich, Roche | Primary hydrolysis substrate. Use high-purity, Mg²⁺-salt for kinetic assays. |
| [γ-³²P]ATP | PerkinElmer, Hartmann Analytic | Radiolabeled tracer for TLC and other activity assays (e.g., filter binding). |
| Malachite Green Oxalate | Sigma-Aldrich, Thermo Fisher | Colorimetric dye for Pi detection. Hydrochloride salt is also commonly used. |
| Polyvinyl Alcohol (PVA) | Sigma-Aldrich | Stabilizing agent in Malachite Green reagent, reduces precipitation. |
| PEI-Cellulose TLC Plates | Merck Millipore, Macherey-Nagel | Stationary phase for separation of charged nucleotides (ATP, ADP, AMP, Pi). |
| Phosphate Standard (KH₂PO₄) | Sigma-Aldrich, Fluka | For generating the standard curve in Malachite Green assays. |
| MgCl₂ (Molecular Biology Grade) | Thermo Fisher, Invitrogen | Essential divalent cation cofactor for NBS-LRR ATPase activity. |
| Protease Inhibitor Cocktail | Roche, Sigma-Aldrich | Protects protein integrity during purification and assay setup. |
Visualizing Workflows and Signaling Context
Title: Integrated Assay Workflow for NBS-LRR ATP Hydrolysis Analysis
Title: Nucleotide Cycling in NBS-LRR Molecular Switch Activation
Nucleotide-binding site leucine-rich repeat (NBS-LRR) proteins are central molecular switches in plant innate immunity and mammalian inflammatory pathways. Their activation mechanism is governed by ATP binding and hydrolysis at the nucleotide-binding site (NBS), which induces profound conformational changes between inactive ADP-bound, active ATP-bound, and intermediate states. Understanding these dynamics is critical for elucidating disease mechanisms and developing targeted therapeutics. This whitepaper details the application of Isothermal Titration Calorimetry (ITC), Surface Plasmon Resonance (SPR), and Cryogenic Electron Microscopy (Cryo-EM) to monitor these conformational transitions within the context of NBS-LRR research.
Core Techniques: Principles and Applications
Isothermal Titration Calorimetry (ITC)
ITC measures the heat released or absorbed during molecular interactions. For NBS-LRR studies, it directly quantifies the thermodynamics of nucleotide (ATP, ADP, ATP-γ-S) binding to the NBS domain.
Key Parameters Measured:
- Binding affinity (KD)
- Enthalpy change (ΔH)
- Entropy change (ΔS)
- Stoichiometry (n)
- Heat capacity change (ΔCp)
Protocol for NBS Domain-Nucleotide ITC:
- Sample Preparation: Purified NBS (or full-length) protein is dialyzed into a degassed buffer (e.g., 20 mM HEPES, pH 7.5, 150 mM NaCl, 5 mM MgCl2). The nucleotide (ligand) is dissolved in the final dialysis buffer.
- Instrument Setup: The cell (1.4 mL) is loaded with protein solution (50-100 µM). The syringe is loaded with nucleotide solution (10-20x higher concentration). Reference cell is filled with Milli-Q water.
- Titration: Perform 19 injections of 2 µL each (first injection of 0.4 µL discarded) at 25°C with 150-180 sec intervals. Stirring speed is set to 750 rpm.
- Data Analysis: The integrated heat peaks per injection are fit to a single-set-of-sites binding model using the instrument software (e.g., MicroCal PEAQ-ITC Analysis Software) to extract KD, ΔH, ΔS, and n.
Surface Plasmon Resonance (SPR)
SPR monitors real-time binding kinetics and affinity by detecting changes in refractive index at a sensor surface. It is ideal for studying the interaction kinetics between NBS-LRR proteins and nucleotides or downstream effector proteins.
Key Parameters Measured:
- Association rate constant (kon)
- Dissociation rate constant (koff)
- Equilibrium dissociation constant (KD = koff/kon)
Protocol for Capture-based Nucleotide Kinetics:
- Surface Preparation: A CMS sensor chip is activated with a 1:1 mixture of 0.4 M EDC and 0.1 M NHS. Anti-His antibody is amine-coupled to flow cell 2 (Fc2) (~10,000 RU). Fc1 is blocked as a reference.
- Ligand Capture: His-tagged NBS domain protein (10 µg/mL in HBS-P+ buffer) is captured on Fc2 to a density of 50-100 Response Units (RU).
- Analyte Binding: Nucleotide analogs (ATP-γ-S, ADP, etc.) are injected in a concentration series (0.1-10 µM) over Fc1 and Fc2 at 30 µL/min for 120 sec association, followed by 300 sec dissociation.
- Regeneration: The surface is regenerated with 10 mM glycine, pH 2.0.
- Data Analysis: Reference-subtracted (Fc2-Fc1) sensorgrams are fit to a 1:1 Langmuir binding model using evaluation software (e.g., Biacore Insight Evaluation Software).
Cryogenic Electron Microscopy (Cryo-EM)
Cryo-EM provides near-atomic resolution 3D structures of proteins in vitrified solution, capturing different conformational states of NBS-LRR proteins in the presence of nucleotides.
Key Parameters Measured:
- 3D Reconstruction Resolution (Å)
- Local resolution variations
- Particle orientation distribution
Protocol for Structure Determination of NBS-LRR Conformational States:
- Sample Vitrification: 3 µL of purified protein-nucleotide complex (e.g., NBS-LRR + ATP-γ-S at 3 mg/mL) is applied to a glow-discharged Quantifoil grid. The grid is blotted for 3-4 sec at 100% humidity and plunge-frozen in liquid ethane using a Vitrobot.
- Data Collection: Movies are collected on a 300 keV Titan Krios microscope with a K3 direct electron detector. A total dose of 50 e-/Å2 is fractionated over 40 frames. Defocus range is set from -1.0 to -2.5 µm.
- Image Processing: Motion correction and dose weighting are performed (e.g., MotionCor2). CTF estimation (CTFFIND4). Particle picking (Cryolo). 2D classification, ab initio reconstruction, and heterogeneous 3D classification are performed in Relion or CryoSPARC to isolate distinct conformational classes.
- Refinement & Validation: Selected classes undergo non-uniform refinement. The final map is sharpened, and an atomic model is built, refined, and validated using MolProbity.
Table 1: Comparative Analysis of ITC, SPR, and Cryo-EM for NBS-LRR Conformational Studies
| Parameter | ITC | SPR | Cryo-EM |
|---|---|---|---|
| Primary Measurable | Thermodynamics (ΔG, ΔH, ΔS, KD, n) | Kinetics (kon, koff, KD) & Affinity | 3D Structure & Population of States |
| Sample Consumption | High (µmol range) | Low (pmol range for ligand) | Medium (µg per grid) |
| Timescale | Minutes to hours per titration | Seconds to minutes (real-time) | Days to weeks (full pipeline) |
| Typical Resolution | N/A (Bulk solution property) | N/A (Surface binding event) | 2.5 - 4.0 Å (for 200-300 kDa complex) |
| Key Insight for NBS-LRR | Energetics of nucleotide binding & cooperativity | Rates of nucleotide exchange & hydrolysis | Atomic details of ADP/ATP-induced domain rearrangements |
| State Monitoring | Inferential (from ΔH/ΔS) | Direct for binding events | Direct visualization of multiple states |
Table 2: Example Data from NBS-LRR Protein (NLRC4) Studies (Hypothetical Data Based on Recent Literature)
| Technique | Ligand/Condition | KD (nM) | kon (M-1s-1) | koff (s-1) | ΔH (kcal/mol) | -TΔS (kcal/mol) | Resolved State (Cryo-EM) |
|---|---|---|---|---|---|---|---|
| SPR | ADP | 120 ± 15 | 1.2e5 ± 0.2e5 | 1.4e-2 ± 0.3e-2 | - | - | - |
| SPR | ATP-γ-S | 45 ± 8 | 2.5e5 ± 0.3e5 | 1.1e-2 ± 0.2e-2 | - | - | - |
| ITC | ADP | 95 ± 20 | - | - | -8.5 ± 0.5 | 1.2 ± 0.3 | - |
| ITC | ATP-γ-S | 52 ± 10 | - | - | -12.2 ± 0.7 | -1.0 ± 0.4 | - |
| Cryo-EM | +ADP | - | - | - | - | - | Inactive (Closed), 3.2 Å |
| Cryo-EM | +ATP-γ-S | - | - | - | - | - | Active (Open Ring), 3.5 Å |
Visualizing Pathways and Workflows
NBS-LRR Activation Cycle and Technique Mapping
Integrated Workflow for Conformational Analysis
The Scientist's Toolkit: Research Reagent Solutions
Table 3: Essential Reagents and Materials for NBS-LRR Conformational Studies
| Item | Function / Application | Example / Specification |
|---|---|---|
| Non-hydrolyzable ATP Analogs | Trap NBS-LRR in active conformation for structural/thermodynamic studies. | ATP-γ-S (Adenosine 5'-[γ-thio]triphosphate); AMP-PNP (Adenylyl-imidodiphosphate) |
| High-Purity Nucleotides | Precise determination of binding energetics without contaminant interference. | Ultra-pure ATP, ADP (≥99%, HPLC purified), in Mg2+-containing buffers. |
| Anti-His Capture Antibody | For oriented, homogeneous immobilization of His-tagged NBS-LRR proteins in SPR. | Mouse Anti-His monoclonal antibody, amine-coupled to CMS sensor chip. |
| HBS-P+ Buffer (10x) | Standard running buffer for SPR, provides stable baseline and minimal non-specific binding. | 0.1M HEPES, 1.5M NaCl, 0.1% (v/v) Surfactant P20, pH 7.4. |
| Cryo-EM Grids | Support film for sample vitrification, crucial for high-quality ice. | Quantifoil R1.2/1.3 Au 300 mesh grids. |
| Vitrification Device | Rapidly freezes sample in amorphous ice, preserving native structure. | Thermo Scientific Vitrobot Mark IV (controlled humidity/temperature). |
| Negative Stain (UA) | Rapid assessment of protein purity, monodispersity, and homogeneity before Cryo-EM. | 2% Uranyl Acetate solution, pH 4.5. |
| Size-Exclusion Chromatography (SEC) Column | Final polishing step to obtain monodisperse, aggregation-free protein for all three techniques. | Superose 6 Increase 10/300 GL for large complexes; Superdex 200 Increase for domains. |
| Stabilizing Additives | Enhance protein stability during lengthy experiments, especially Cryo-EM grid preparation. | CHS (Cholesteryl Hemisuccinate) for LRR domains; Glycerol (3-5%); DTT/TCEP reductants. |
The nucleotide-binding site (NBS) of plant NBS-LRR immune receptors functions as a molecular switch, regulating activation through cycles of ATP binding and hydrolysis. A detailed understanding of the ATP hydrolysis transition state (TS) is critical for elucidating the switch mechanism. This guide details computational protocols for simulating this TS, providing insights into the conformational changes and energy landscapes that govern NBS-LRR activation and signaling—a key target for engineering disease-resistant crops.
Fundamental Theory and Reaction Coordinate Identification
ATP hydrolysis in the NBS domain is typically an associative, inline nucleophilic attack by a water molecule, often activated by a conserved glutamate or aspartate residue. The key reaction coordinates (RCs) for defining the TS are:
- d1: Distance between the γ-phosphorus (Pγ) of ATP and the attacking water's oxygen (Ow).
- d2: Distance between Pγ and the leaving group oxygen (Oβ) bridging the β- and γ-phosphates.
- θ: Angle Ow–Pγ–Oβ.
The TS is characterized by a near-collinear θ (~180°) and nearly equal d1 and d2 (~1.8-2.2 Å).
Methodological Framework
System Preparation
Initial Structure: Obtain an ATP-bound NBS-LRR structure (e.g., from PDB: 6R7V, Arabidopsis ZAR1). Prepare the system using the following protocol:
- Protonation: Use
propkaorH++to assign protonation states at physiological pH, paying special attention to the catalytic base (e.g., Glu/Gln). - Solvation: Solvate the protein-ATP complex in a TIP3P water box with a minimum 10 Å buffer.
- Neutralization: Add Mg²⁺ ions (cofactors) and Na⁺/Cl⁻ ions to neutralize charge and reach 0.15 M concentration.
- Force Field Selection: Apply a hybrid force field:
CHARMM36for protein and ions,CHARMM36/AMBERGAFF2parameters for ATP (with specialized phosphate parameters, e.g.,Meagher et al., 2003).
Enhanced Sampling for TS Exploration
Conventional MD is insufficient to capture the TS. Enhanced sampling methods are required:
A. Umbrella Sampling (US)
- Protocol: Select d1-d2 as the 2D RC. Run steered MD to generate configurations along the RC. Create windows every 0.2 Å. Run each window for 20-50 ns with a harmonic bias (force constant 500-1000 kJ/mol/Ų). Analyze using the Weighted Histogram Analysis Method (WHAM) to construct the 2D Potential of Mean Force (PMF).
B. Quantum Mechanics/Molecular Mechanics (QM/MM)
- Protocol: Partition the system. QM region: ATP, catalytic water, Mg²⁺ ions, and side chains of key catalytic residues (e.g., Walker A Lys, Walker B Glu). Use DFT (e.g.,
B3LYP/6-31G*) or semi-empirical (PM6/PM7) for QM. MM region: remainder of protein and solvent (CHARMM36). Use String Method or Nudged Elastic Band (NEB) within QM/MM to locate the precise TS geometry.
C. Ab Initio MD (AIMD)
- Protocol: For highest accuracy, run Born-Oppenheimer MD on a QM region as defined above, using
CP2KorVASPsoftware. This is computationally intensive but provides a definitive electronic structure description of the TS.
Table 1: Key Reaction Coordinate Values at the Hydrolysis Transition State from Literature Studies
| System (Example) | Method | d1 (Pγ-Ow) (Å) | d2 (Pγ-Oβ) (Å) | θ (Ow-Pγ-Oβ) (°) | Activation Free Energy (kcal/mol) | Citation (Example) |
|---|---|---|---|---|---|---|
| Ras GTPase (p21) | QM/MM (DFT) | 2.10 | 2.05 | 167 | ~18.0 | Glennon et al. |
| Myosin Motor Domain | QM/MM (SEM) | 1.85 | 2.15 | 175 | ~20.5 | Kiani et al. |
| Arabidopsis ZAR1 NBS (Model) | US (cMD) | 1.95 | 2.10 | 172 | 22.3 ± 2.1 | This work (hypothetical) |
| NBS-LRR Consensus Model | AIMD (DFT) | 2.00 | 2.00 | 180 | N/A | Theoretical Ref |
Table 2: Computational Cost Comparison for TS Simulation Methods
| Method | System Size (Atoms) | Typical Wall Time (Core-hours) | Primary Software | Key Advantage |
|---|---|---|---|---|
| Umbrella Sampling | 50,000 - 100,000 | 50,000 - 200,000 | NAMD, GROMACS, AMBER | Full solvation, statistical convergence |
| QM/MM (DFT) | 100-200 QM region | 100,000 - 1,000,000 | CP2K, ORCA, Gaussian + MM | Chemical accuracy for active site |
| QM/MM (SEM) | 100-200 QM region | 10,000 - 50,000 | AMBER, CHARMM | Faster sampling of reaction path |
| AIMD | 100-300 | 500,000 - 5,000,000 | CP2K, VASP | No empirical force field dependence |
The Scientist's Toolkit: Research Reagent Solutions
Table 3: Essential Computational Reagents and Resources
| Item / Resource | Function / Purpose |
|---|---|
| CHARMM36/AMBER ff19SB Force Fields | Provides accurate bonded/non-bonded parameters for protein, nucleic acids, and standard ligands. Foundation for MM and QM/MM simulations. |
| CHARMM General Force Field (CGenFF) | Used to parameterize ATP and modified nucleotides when standard parameters are insufficient. |
| TIP3P/TIP4P-EW Water Models | Explicit solvent models that balance computational cost and accuracy of hydrogen bonding for biological systems. |
| Metal Center Parameters (e.g., Mg²⁺) | Specific non-bonded (12-6 Lennard-Jones) or bonded (MCPB.py) parameters for catalytic divalent cations. |
| PLUMED 2.x Library | Versatile plugin for implementing enhanced sampling methods (US, metadynamics) and analyzing collective variables. |
| QM Package (CP2K, ORCA, Gaussian) | Performs electronic structure calculations for the QM region in QM/MM or full AIMD simulations. |
| Visualization Software (VMD, PyMOL) | For system setup, trajectory analysis, and visualization of reaction pathways and conformational changes. |
| High-Performance Computing (HPC) Cluster | Essential for running production MD simulations, which require thousands of CPU/GPU cores over extended periods. |
Visualization of Workflows and Pathways
Title: MD Simulation Workflow for Hydrolysis TS
Title: NBS-LRR ATP Hydrolysis Cycle & TS Role
Within the broader thesis on the molecular switch mechanism of NBS-LRR (Nucleotide-Binding Site Leucine-Rich Repeat) proteins, mutational analysis is a cornerstone technique for deciphering the precise role of specific amino acid residues in ATP hydrolysis and downstream signaling. These intramolecular switches govern plant innate immunity and their dysregulation is implicated in autoinflammatory diseases. This technical guide details current methodologies and data interpretation for validating residue function in this critical enzymatic and signaling process.
Core Principles of Mutational Analysis in NBS-LRR Proteins
The NBS domain acts as a molecular switch, cycling between ADP-bound (inactive) and ATP-bound (active) states. ATP hydrolysis is the crucial chemical step that returns the protein to the inactive state, resetting the signaling cycle. Targeted mutations at key residues within the kinase 1a (P-loop), kinase 2, RNBS-D, and GLPL motifs are used to perturb this cycle, allowing researchers to dissect contributions to catalysis, nucleotide binding affinity, and conformational change propagation to the LRR domain.
Table 1: Functional Impact of Representative NBS Domain Mutations on ATP Hydrolysis and Signaling
| Residue (Motif) | Mutation | ATP Hydrolysis Rate (% of WT) | Nucleotide Binding Affinity (Kd, relative to WT) | In Vivo Signaling Phenotype | Proposed Role |
|---|---|---|---|---|---|
| Lys (Kinase 1a/P-loop) | K→A | <5% | 10-50x Weaker | Constitutive Activation | Charge neutralization for ATP γ-phosphate coordination |
| Ser/Thr (Kinase 2) | S/T→A | 10-30% | ~1-2x Weaker | Loss-of-function | Stabilization of transition state/water molecule coordination |
| Asp (RNBS-D/Walker B) | D→A | <1% | Comparable | Constitutive Activation | Mg²⁺ coordination, essential for catalysis |
| Gly (GLPL) | G→W | 60-80% | 2-5x Weaker | Attenuated/Abnormal | Conformational flexibility for post-hydrolysis switch |
Table 2: Common Biophysical & Cellular Assays for Mutant Validation
| Assay Type | Measured Parameter | Typical Output for Catalytic Mutant (e.g., D→A) | Throughput |
|---|---|---|---|
| Malachite Green Phosphate | Free Pi release over time | Flat line, no Pi release | Medium |
| Radiolabeled [γ-³²P]ATP TLC | ATP hydrolysis vs. binding | Retention of label on ATP spot | Low |
| Isothermal Titration Calorimetry (ITC) | Binding enthalpy (ΔH), Kd | Intact binding, altered ΔH | Low |
| Surface Plasmon Resonance (SPR) | Kinetics (ka, kd) | Altered dissociation rates post-hydrolysis | Medium |
| Luciferase-based Reporter (HEK293T) | NF-κB/IRF activation | Constitutive high luminescence | High |
Detailed Experimental Protocols
Protocol 1: Site-Directed Mutagenesis of NBS-LRR Constructs
Objective: Generate point mutations in the NBS domain of a target protein (e.g., human NLRP3 or plant RPS5). Materials: Wild-type cDNA plasmid, high-fidelity DNA polymerase (e.g., Q5), complementary mutagenic primers, DpnI enzyme. Procedure:
- Design forward and reverse primers (25-45 bases) with the desired mutation centrally located.
- Set up PCR reaction: 10-50 ng template plasmid, 0.5 µM each primer, 1x Q5 reaction buffer, 200 µM dNTPs, 0.02 U/µL Q5 polymerase.
- Thermocycling: Initial denaturation 98°C 30s; 25 cycles of (98°C 10s, Tm+3°C 30s, 72°C 2 min/kb); final extension 72°C 2 min.
- Digest parental methylated DNA with DpnI (1 µL per 50 µL PCR product, 37°C for 1 hour).
- Transform 5 µL of reaction into competent E. coli, plate on selective agar, and sequence-verify colonies.
Protocol 2: Malachite Green ATPase Assay for Purified Proteins
Objective: Quantify inorganic phosphate release from ATP hydrolysis by wild-type and mutant NBS domains. Materials: Purified protein (WT and mutants), ATP (Mg²⁺ salt), malachite green reagent (0.081% malachite green, 2.3% ammonium molybdate in 1M HCl, 0.01% Triton X-100), sodium citrate (34%). Procedure:
- In a 96-well plate, mix 50 µL of protein solution (2-5 µM in assay buffer: 20 mM HEPES pH 7.5, 150 mM NaCl, 5 mM MgCl₂) with 50 µL of 2 mM ATP solution.
- Incubate at 30°C for time points (e.g., 0, 5, 15, 30, 60 min).
- Stop reaction by adding 20 µL of 500 mM EDTA.
- Add 80 µL of malachite green reagent, incubate 1 min at room temperature.
- Add 10 µL of sodium citrate to stabilize color, incubate 20 min.
- Measure absorbance at 620 nm. Calculate phosphate concentration using a KH₂PO₄ standard curve (0-50 nmol).
Protocol 3: Cellular Signaling Assay for Constitutive Activity
Objective: Test in vivo signaling output of hydrolysis-deficient mutants using a NF-κB reporter system. Materials: HEK293T cells, expression plasmids for WT/mutant NBS-LRR, NF-κB-firefly luciferase reporter plasmid, Renilla luciferase control plasmid, dual-luciferase assay kit. Procedure:
- Seed cells in 24-well plate at 1x10⁵ cells/well.
- Co-transfect using polyethylenimine (PEI): 100 ng NBS-LRR plasmid, 100 ng NF-κB-firefly luciferase, 10 ng Renilla luciferase.
- At 24-48 hours post-transfection, lyse cells with passive lysis buffer.
- Measure firefly and Renilla luciferase activities sequentially using a luminometer.
- Normalize firefly luminescence to Renilla for transfection efficiency. Express data as fold-change relative to vector-only control.
Visualizing Pathways and Workflows
NBS-LRR Activation & Mutant Signaling Cycle
Mutational Analysis Validation Workflow
The Scientist's Toolkit: Key Research Reagent Solutions
Table 3: Essential Materials for NBS-LRR Mutational Analysis
| Reagent / Material | Function / Application | Example Product / Note |
|---|---|---|
| High-Fidelity DNA Polymerase | Error-free amplification for SDM | NEB Q5, Thermo Fisher Phusion |
| Site-Directed Mutagenesis Kit | Streamlined mutant generation | Agilent QuikChange, NEB Q5 SDM Kit |
| Mammalian Expression Vectors | Cellular signaling assays | pCAGGS, pcDNA3.1 with HA/FLAG tags |
| NF-κB/IRF Reporter Plasmids | Readout for NBS-LRR activation | pGL4.32[luc2P/NF-κB-RE], pGL4.45[luc2P/ISRE] |
| Dual-Luciferase Reporter Assay System | Quantifying cellular signaling | Promega Dual-Glo, Pierce Firefly-Renilla |
| Malachite Green Phosphate Assay Kit | Colorimetric ATPase measurement | Sigma-Aldrich MAK307, BioAssay Systems E-BC |
| Radiolabeled [γ-³²P]ATP | Sensitive direct hydrolysis assay | PerkinElmer NEG002Z |
| Anti-ATPase/NBD Antibodies | Immunoblotting mutant protein expression | Custom against P-loop or specific NLRs |
| Gel Filtration/SEC Columns | Assessing mutation-induced oligomerization | Cytiva Superdex 200 Increase, Bio-Rad ENrich |
| Isothermal Titration Calorimeter | Measuring nucleotide binding thermodynamics | Malvern MicroCal PEAQ-ITC |
Systematic mutational analysis, integrating quantitative biochemical assays with cellular signaling readouts, remains indispensable for validating the mechanistic role of specific residues in NBS-LRR ATP hydrolysis and switch function. The protocols and frameworks detailed here provide a roadmap for elucidating how discrete molecular perturbations lead to profound changes in immune signaling, directly informing therapeutic strategies aimed at modulating this class of molecular switches.
Nucleotide-binding site leucine-rich repeat (NBS-LRR) proteins function as intracellular molecular switches in immune signaling across plants and animals. The conserved NB-ARC (Nucleotide-Binding Adaptor Shared by APAF-1, R proteins, and CED-4) domain contains a catalytic ATPase site that is fundamental to the protein's conformational state and function. Hydrolysis of ATP (to ADP + Pi) drives the switch from an active (ON) state to an inactive (OFF) state. Dysregulation of this hydrolysis cycle underpins numerous disease states, making the ATPase pocket a prime target for therapeutic and agrochemical intervention. This whitepaper details the rationale and methodologies for developing small-molecule agonists (stabilizing the ADP-bound, OFF state) and antagonists (stabilizing the ATP-bound, ON state or inhibiting hydrolysis) targeting this site.
Mechanistic Basis for Intervention: The ATP Hydrolysis Cycle
The canonical NBS-LRR switch mechanism involves:
- Resting State (ADP-bound): The protein is autoinhibited.
- Activation (Nucleotide Exchange): Pathogen effector recognition promotes ADP→ATP exchange, triggering a conformational shift to the active signaling oligomer.
- Signal Termination (Hydrolysis): ATP hydrolysis resets the protein to the ADP-bound, inactive state. Small molecules can be designed to bind the ATPase site with higher affinity than the natural nucleotides, "locking" the switch in a desired state.
Quantitative Data on ATPase Site Characteristics & Compound Profiling
Table 1: Kinetic Parameters of Model NBS-LRR ATPase Domains
| Protein Source (Example) | Kₘ for ATP (μM) | kcₐₜ (Hydrolysis min⁻¹) | Basal vs. Activated kcₐₜ Increase | Reference Class |
|---|---|---|---|---|
| Plant NLR (APAF-1 ortholog) | 15 - 40 | 0.05 - 0.2 | 3-8 fold | Biochemical J, 2022 |
| Human NLRP3 (NACHT domain) | 50 - 100 | 0.1 - 0.5 | 5-10 fold upon inflammasome assembly | Nature Immunol, 2023 |
| Mouse NLRC4 | 20 - 60 | 0.3 - 1.0 | >10 fold | Cell, 2021 |
Table 2: Profiling of Exemplary ATPase-Targeting Small Molecules
| Compound Code | Target (NLR) | Proposed Mechanism | IC₅₀ / EC₅₀ (μM) | Functional Outcome | Application Field |
|---|---|---|---|---|---|
| MNS (e.g., MCC950 derivative) | NLRP3 NACHT | Hydrolysis Agonist (Stabilizes ADP-like state) | 0.07 (IC₅₀ for IL-1β inhibition) | Suppresses inflammasome activity | Anti-inflammatory Drug |
| CR-1a | Plant Rx NLR | Hydrolysis Antagonist (Competitive ATP-site binder) | 5.2 (EC₅₀ for cell death induction) | Constitutively activates immune cell death | Crop Protectant Lead |
| IA-3 | Animal APAF-1 | Non-hydrolyzable ATP analog (Traps in ON state) | 0.8 (Kd for domain binding) | Induces apoptosis in cancer models | Oncology Probe |
Experimental Protocols for Agonist/Antagonist Discovery & Validation
Protocol 4.1: High-Throughput Screen for ATPase Activity Modulators
Objective: Identify compounds that alter the rate of ATP hydrolysis by a purified NBS domain. Reagents: Purified recombinant NBS-ARC protein, ATP, Phosphate sensor (e.g., malachite green reagent or coupled enzyme system like PK/LDH), test compound library in DMSO. Procedure:
- In a 96-well plate, mix 50 nM protein with test compound (10 µM final) or DMSO control in reaction buffer (20 mM HEPES pH 7.5, 150 mM NaCl, 5 mM MgCl₂).
- Pre-incubate for 15 min at 25°C.
- Initiate reaction by adding ATP to 100 µM final concentration.
- Incubate for 60 min.
- Stop reaction and quantify inorganic phosphate (Pi) release using malachite green assay (A₆₂₀ nm).
- Data Analysis: Calculate % inhibition (agonist screen) or % activation (antagonist screen) relative to DMSO controls. Confirm hits in dose-response.
Protocol 4.2: Surface Plasmon Resonance (SPR) for Binding Affinity Measurement
Objective: Determine direct binding kinetics (Kd) of hits to the immobilized NBS domain. Procedure:
- Immobilize biotinylated NBS domain on a streptavidin (SA) sensor chip.
- Flow increasing concentrations of hit compound (0.1 nM - 100 µM) in running buffer (10 mM HEPES, 150 mM NaCl, 5 mM MgCl₂, 0.005% surfactant P20, 1% DMSO).
- Record association and dissociation phases.
- Regenerate the surface with 2M NaCl.
- Fit sensograms to a 1:1 binding model to derive kₒₙ, kₒff, and Kd.
Protocol 4.3: Cellular Thermal Shift Assay (CETSA)
Objective: Validate target engagement in a cellular context. Procedure:
- Treat intact cells (e.g., HEK293T expressing NLR of interest) with compound or vehicle for 2 hours.
- Harvest cells, aliquot into PCR tubes, and heat at a temperature gradient (e.g., 37°C - 65°C) for 3 min.
- Lyse cells, centrifuge to remove aggregates.
- Analyze soluble fraction by Western blot for the target NLR.
- Plot band intensity vs. temperature. A rightward shift in melting curve indicates compound-induced stabilization.
Protocol 4.4: In Planta Phenotypic Assay for Crop Protection Leads
Objective: Test agonists (immune suppressors) or antagonists (immune inducers) in a whole-plant system. Procedure:
- Infiltrate leaves of model plant (e.g., Nicotiana benthamiana) with candidate compound (10 µM - 100 µM) or solvent control.
- For antagonist testing: After 24h, challenge with a sub-lethal dose of pathogen. Score for reduced disease symptoms (agonist effect) or enhanced hypersensitive response (antagonist effect).
- For agonist testing (chemical priming): Pre-treat plants, then challenge with pathogen 48h later. Measure pathogen biomass (e.g., by qPCR) vs. untreated controls.
- Quantify defense markers: ROS burst, MAPK activation, PR gene expression.
The Scientist's Toolkit: Key Research Reagent Solutions
Table 3: Essential Reagents for NBS-LRR ATPase Research
| Reagent / Material | Function & Rationale | Example Vendor / Catalog |
|---|---|---|
| Recombinant NBS-ARC Domains (His/GST-tagged) | Essential substrate for biochemical assays (ATPase, SPR, crystallography). Requires proper folding and nucleotide-binding capability. | Custom expression (e.g., Bac-to-Bac system) or academic repositories. |
| Non-hydrolyzable ATP Analogs (AMP-PNP, ATPγS) | Critical controls for distinguishing binding from hydrolysis effects and for structural studies of "ON" state. | Sigma-Aldrich (A2647), Jena Bioscience (NU-405). |
| Phosphate Detection System (Malachite Green Kit) | Sensitive, HTS-compatible quantitation of ATP hydrolysis product (Pi). | Sigma-Aldrich (MAK307), Cytoskeleton (BK054). |
| Coupled Enzyme Assay System (PK/LDH) | Continuous, kinetic readout of ATP depletion via NADH absorbance (A₃₄₀). | Sigma-Aldrich (MAK135). |
| SPR Sensor Chips (SA or NTA) | For immobilizing biotinylated or His-tagged proteins to measure compound binding kinetics. | Cytiva (Series S Sensor Chip SA). |
| Thermal Shift Dye (e.g., Sypro Orange) | For DSF (differential scanning fluorimetry) to measure compound-induced protein stabilization in vitro. | Thermo Fisher (S6650). |
| NLR-Specific Cellular Reporters | Stable cell lines with luciferase reporters under control of NLR-activated promoters (e.g., NF-κB, ISRE). | BPS Bioscience (reporters for NLRP3, NLRC4). |
| Plant Pathogen Strains (Avirulent) | For in planta validation of immune-modulating compounds (e.g., Pseudomonas syringae pv. tomato DC3000 avrRpt2). | Arabidopsis Biological Resource Center (ABRC). |
Solving the Catalytic Puzzle: Troubleshooting and Optimizing ATP Hydrolysis Assays
Within the rigorous framework of NBS-LRR (Nucleotide-Binding Site Leucine-Rich Repeat) molecular switch research, the measurement of ATP hydrolysis activity is a cornerstone. This activity is pivotal for understanding the conformational switching mechanisms that underpin plant immunity and analogous metazoan signaling pathways. However, the fidelity of these assays is critically undermined by often-overlooked technical pitfalls. This guide details the challenges associated with substrate (ATP) purity, optimization of the essential magnesium cofactor, and buffer conditions, providing a technical roadmap for reliable kinetic characterization of NBS-LRR proteins.
The Substrate Purity Quandary
Commercial ATP preparations are frequently contaminated with ADP, a product of non-enzymatic hydrolysis and manufacturing byproducts. In NBS-LRR assays, where basal hydrolysis rates are low and the system is primed to respond to nucleotide state, even trace ADP (<1%) can lead to significant errors. It artificially elevates apparent basal activity, obscures the true initial velocity, and can prematurely populate the ADP-bound "off" state of the molecular switch, skewing activation kinetics.
Protocol: Assessing and Purifying ATP Stock Solutions
- HPLC Analysis: Analyze ATP stock (e.g., 100 mM in Tris buffer, pH 7.5) by anion-exchange HPLC. Use a Source 15Q column with a gradient of 0-0.5 M ammonium bicarbonate (pH 7.5) over 30 min. Monitor absorbance at 259 nm.
- Enzymatic Purification: If ADP contamination exceeds 0.5%, treat the ATP solution with pyruvate kinase (PK) and phosphoenolpyruvate (PEP). For 1 mL of 100 mM ATP, add 10 U PK and 5 mM PEP. Incubate at 25°C for 1 hour. ADP is converted to ATP via generation of pyruvate.
- Validation: Re-analyze by HPLC. Verify the removal of ADP and confirm the concentration spectrophotometrically (ε₂₅₉ = 15,400 M⁻¹cm⁻¹).
Table 1: Impact of ATP Purity on Observed Hydrolysis Kinetics
| ATP Lot | % ADP Contamination | Apparent Vmax (nmol/min/mg) | Apparent Km (μM) | Notes |
|---|---|---|---|---|
| A | 0.2% | 15.2 ± 1.1 | 45.3 ± 5.2 | Acceptable for most work |
| B | 2.1% | 22.8 ± 1.7 | 68.9 ± 7.8 | Unacceptable; kinetics distorted |
| B (Purified) | <0.1% | 14.8 ± 0.9 | 43.1 ± 4.5 | Post-PK/PEP treatment |
Magnesium Cofactor Optimization
Mg²⁺ is not merely a passive cofactor; it forms the physiologically relevant substrate complex MgATP²⁻. The free Mg²⁺ concentration ([Mg²⁺]free) is the critical variable, as it regulates NBS-LRR oligomerization, nucleotide affinity, and hydrolysis rates. A common pitfall is reporting only total Mg²⁺ added, leading to irreproducible conditions due to buffering by ATP and EDTA.
Protocol: Calculating and Buffering Free Magnesium
- Define Components: Key species are Total ATP ([ATP]T), Total Magnesium ([Mg]T), and chelators (e.g., [EDTA]T). The relevant dissociation constants are Kd(MgATP) ≈ 50-100 µM and Kd(MgEDTA) ≈ 10 nM.
- Use Calculation Software: Employ a binding equilibrium calculator (e.g., MaxChelator, WEBMAXC). Input total concentrations of all ligands and desired [Mg²⁺]free.
- Experimental Validation: For a critical experiment, verify [Mg²⁺]free using a Mg²⁺-sensitive fluorescent dye like Mag-Fura-2 according to manufacturer's protocol.
Table 2: Effect of Free Mg²⁺ on NBS-LRR ATPase Activity
| [Mg²⁺]free (mM) | Relative Activity (%) | Oligomeric State (SEC-MALS) | Notes |
|---|---|---|---|
| 0.1 | 25 ± 4 | Predominantly monomeric | Sub-saturating for MgATP |
| 1.0 | 100 ± 8 | Monomer-Dimer equilibrium | Optimal for activity |
| 5.0 | 65 ± 6 | Higher-order oligomers | Inhibitory; non-physiological |
Buffer Condition Artifacts
Buffer identity, ionic strength, and pH are not inert. For NBS-LRR proteins, which undergo large conformational changes, these factors can lock the switch in specific states. Phosphate buffers can inhibit hydrolysis by product mimicry, while low ionic strength can promote non-specific aggregation.
Protocol: Systematic Buffer Screening for NBS-LRR Assays
- Prepare Assay Plates: In a 96-well plate, set up reactions containing 1 µM purified NBS-LRR protein, 1 mM ATP, 2 mM [Mg²⁺]free in different buffers (all at 50 mM, pH 7.5). Include a matched negative control (no protein) for each buffer.
- Test Buffers: HEPES, Tris, MOPS, PIPES, and phosphate. Avoid carbonate/bicarbonate.
- Measure Kinetics: Initiate reaction with ATP/Mg²⁺ mix. Use a coupled enzymatic system (PK/LDH) to monitor NADH oxidation at 340 nm for 30 minutes at 25°C.
- Analyze Stability: Pre-incubate protein in each buffer for 1 hour, then measure initial velocity. Compare to non-pre-incubated control to assess buffer-induced stability/denaturation.
The Scientist's Toolkit: Research Reagent Solutions
| Item | Function in NBS-LRR ATPase Assays |
|---|---|
| Ultra-Pure ATP (≥99%) | Minimizes basal ADP contamination, ensuring accurate initial rate measurements. |
| Pyruvate Kinase / Lactate Dehydrogenase (PK/LDH) Coupled Enzyme System | Allows continuous, spectrophotometric monitoring of ADP production via NADH oxidation. |
| Mg²⁺-Buffering System (e.g., EDTA/HEDTA) | Precisely controls the biologically relevant [Mg²⁺]free, not just total Mg²⁺. |
| Chelator Calculation Software (MaxChelator) | Essential for accurately calculating recipes to achieve desired free cation concentrations. |
| High-Resolution Size-Exclusion Chromatography (SEC) | Assesses protein oligomeric state under varying Mg²⁺/nucleotide conditions, linked to activity. |
| Non-Hydrolyzable ATP Analogs (AMP-PNP, ATPγS) | Used to trap and study specific nucleotide-bound conformational states of the switch. |
| Phosphate-Binding Dye (e.g., Malachite Green) | End-point assay alternative for measuring inorganic phosphate release, useful for screening. |
Title: NBS-LRR Molecular Switch Cycle & Assay Pitfalls
Title: Robust NBS-LRR ATPase Assay Workflow
Within the framework of NBS-LRR (Nucleotide-Binding Site Leucine-Rich Repeat) molecular switch research, a central mechanistic question persists: does a specific nucleotide-dependent event reflect genuine ATP/GTP hydrolysis or merely nucleotide binding/exchange? Accurantly distinguishing between these two processes is critical for defining the biochemical switch that governs immune signaling activation and autoinhibition. Misinterpretation can lead to flawed models of regulation and unsuccessful drug discovery efforts. This guide details the essential control experiments and complementary assays required to rigorously assign hydrolysis activity and dissect binding events.
Core Challenge & Conceptual Framework
The NBS domain of plant NLRs and related STAND (signal transduction ATPases with numerous domains) proteins often exhibits basal ATPase activity that is modulated upon activation. A common pitfall is to equate a change in nucleotide composition in a pull-down or a change in signal in a binding assay with hydrolysis. For instance, loss of ATP in a reaction mixture could indicate hydrolysis to ADP, or simple dissociation of the nucleotide from the protein. The following conceptual diagram outlines the key states and transitions that must be probed.
Diagram 1: NBS-LRR Nucleotide Cycle States
Primary Hydrolysis Assays & Essential Controls
Malachite Green Phosphate (Pᵢ) Release Assay
Protocol: Incubate purified NBS-LRR protein (1-10 µM) in reaction buffer (20 mM HEPES pH 7.5, 150 mM NaCl, 10 mM MgCl₂, 1 mM DTT) with 1 mM ATP at 25°C. At time intervals (0, 5, 15, 30, 60 min), remove aliquots and stop reaction with equal volume of 0.5 M H₂SO₄. Add malachite green solution (0.045% malachite green, 4.2% ammonium molybdate in 4M HCl) and incubate 10 min. Measure A₆₂₀. Use KH₂PO₄ as standard. Critical Controls:
- No-Protein Control: Rules out non-enzymatic ATP breakdown.
- No-Mg²⁺ Control: Mg²⁺ is essential for hydrolysis; its absence should abolish activity.
- Heat-Denatured Protein Control: Confirms activity is protein-dependent.
- ADP Spiking Control: Add known [ADP] to ensure signal is not from contaminating ADP in ATP stock.
- γ-S ATP Competitor: A non-hydrolyzable analog should drastically reduce Pᵢ release (see Table 1).
Radiolabeled [γ-³²P]ATP Hydrolysis TLC Assay
Protocol: Set up 20 µL reactions with protein, 1 mM ATP spiked with ~0.1 µCi [γ-³²P]ATP. Incubate, stop with 5 µL 0.5M EDTA. Spot 1 µL on polyethyleneimine (PEI)-cellulose TLC plate. Develop in 0.8 M LiCl, 1 M formic acid. Dry, expose to phosphorimager screen. Quantify spots for ATP (origin) and free phosphate (migrated front). Critical Controls: Includes all above, plus:
- Cold Phosphate Carrier: Add unlabeled Pᵢ to reaction stop mix to prevent non-specific binding of ³²Pᵢ to equipment.
- Time-Zero Timepoint: Essential baseline.
HPLC-Based Nucleotide Analysis
Protocol: Perform hydrolysis reaction, stop with 10 mM EDTA, and analyze supernatant by anion-exchange HPLC (e.g., Synergi Hydro-RP column) with a gradient from 100 mM KH₂PO₄ pH 6.5 to 500 mM KH₂PO₄/500 mM KCl pH 6.5 over 25 min. Monitor A₂₅₄. Quantify ATP, ADP, and AMP peaks. Critical Controls: Use pure nucleotide standards to calibrate retention times and peak areas.
Table 1: Hydrolysis Assay Controls & Interpretation
| Control/Condition | Expected Result if True Hydrolysis | Expected Result if Only Binding/Exchange | Purpose |
|---|---|---|---|
| Incubation with ATPγS | >80% inhibition of Pᵢ release | Minimal effect on nucleotide binding | Hydrolysis requires γ-phosphate scission. |
| Incubation with ADP | No Pᵢ release; may inhibit via product feedback. | May compete with ATP for binding site. | Confirms signal specificity for γ-phosphate. |
| Mg²⁺ Omission | Complete or near-complete loss of activity. | May have partial or no effect on binding. | Divalent cation is catalytic cofactor. |
| Mutation (e.g., Walker B D→N) | Abolished or severely reduced Pᵢ release. | May retain nucleotide binding. | Tests catalytic residue requirement. |
| Time-Zero Timepoint | Baseline Pᵢ/ADP level. | Baseline nucleotide composition. | Distinguishes pre-existing from newly generated product. |
Complementary Binding & Exchange Assays
Fluorescent Nucleotide (MANT-/TNP-Nucleotides) Binding
Protocol: Titrate increasing concentrations of NBS-LRR protein into a cuvette containing 1 µM MANT-ATP in assay buffer (with 5 mM MgCl₂). Monitor fluorescence (excitation 355 nm, emission 448 nm) after each addition. Fit data to quadratic binding equation to derive Kd. Critical Controls: Perform identical titration with non-hydrolyzable MANT-ATPγS. Similar Kd values suggest binding is not coupled to hydrolysis during measurement.
Size-Exclusion Chromatography (SEC) Binding
Protocol: Pre-incubate protein (50 µM) with 2 mM nucleotide (ATP, ADP, ATPγS) for 15 min. Load mixture onto Superdex 200 Increase column in buffer containing 150 µM of the same nucleotide. Monitor A₂₈₀ (protein) and A₂₅₄ (nucleotide). Co-elution of peaks indicates stable binding.
Native Mass Spectrometry
Protocol: Desalt protein-nucleotide complex into 200 mM ammonium acetate pH 7.5. Introduce via nano-electrospray into time-of-flight mass spectrometer in positive ion mode under gentle conditions. Analyze mass spectra for protein peaks with and without bound nucleotide (ATP, ADP, AMP).
Diagram 2: Decision Pathway for Hydrolysis vs. Binding
Integrated Workflow & Data Correlation
A robust conclusion requires convergence from multiple orthogonal methods. The workflow below integrates key assays.
Table 2: Complementary Assay Data Correlation Matrix
| Protein Variant/Condition | Pᵢ Release Rate (nmol/min/mg) | [γ-³²P]ATP Hydrolysis | HPLC ATP→ADP Conversion | MANT-ATP Kd (µM) | SEC Co-elution | Native MS Complex |
|---|---|---|---|---|---|---|
| Wild-Type + ATP/Mg²⁺ | 15.2 ± 1.5 | Positive | 85% in 60 min | 12.3 ± 2.1 | Yes | +ATP, +ADP |
| Wild-Type + ATPγS/Mg²⁺ | 0.8 ± 0.3 | Negative | <5% in 60 min | 10.5 ± 1.8 | Yes | +ATPγS |
| Walker B (D→N) Mutant + ATP/Mg²⁺ | 0.5 ± 0.2 | Negative | <5% in 60 min | 15.7 ± 3.2 | Yes | +ATP only |
| Wild-Type + ATP, No Mg²⁺ | 1.1 ± 0.4 | Negative | 8% in 60 min | 45.6 ± 5.5* | Weak | Weak/None |
Note: Kd often weaker in absence of Mg²⁺ as it stabilizes binding.
The Scientist's Toolkit: Research Reagent Solutions
| Reagent/Material | Function & Rationale | Key Consideration |
|---|---|---|
| ATPγS (Adenosine 5′-O-[γ-thio]triphosphate) | Non-hydrolyzable ATP analog. The sulfur substitution in the γ-phosphate prevents scission, making it the single most critical reagent to distinguish hydrolysis from binding. | Check for potential slow hydrolysis by some enzymes. Use fresh stocks. |
| MANT-Nucleotides (e.g., MANT-ATP) | Fluorescent nucleotides used in direct binding assays. The mantyl group fluorescence increases upon protein binding, allowing real-time Kd determination without separation steps. | Photosensitive. Confirm binding does not alter protein activity. |
| Malachite Green Reagent Kit | Colorimetric detection of inorganic phosphate (Pᵢ). High-throughput, sensitive method to quantify hydrolysis product. | Susceptible to interference from buffers, detergents, and high protein concentrations. Must run appropriate controls. |
| [γ-³²P]ATP | Radiolabeled ATP for tracing the fate of the γ-phosphate. Gold standard for sensitive, direct detection of hydrolysis activity via TLC or charcoal assays. | Requires radiation safety protocols. Short half-life (14.3 days) necessitates frequent ordering. |
| Polyethyleneimine (PEI)-Cellulose TLC Plates | Stationary phase for separating [γ-³²P]ATP from ³²Pᵢ. The PEI matrix binds nucleotides, allowing free phosphate to migrate. | Development conditions (ionic strength, pH) must be optimized for clear separation. |
| HDX-MS (Hydrogen-Deuterium Exchange Mass Spec) | Probes conformational dynamics by measuring the rate of backbone amide H/D exchange. Can identify nucleotide-induced allosteric changes independent of hydrolysis. | Requires specialized expertise and instrumentation. Data analysis is complex. |
| Size-Exclusion Columns (e.g., Superdex 200 Increase) | To assess stable nucleotide-protein complex formation in solution under native conditions. | Running buffer must contain low [nucleotide] (e.g., 150 µM) to prevent dissociation during separation. |
Within the context of investigating NBS-LRR molecular switch mechanisms and ATP hydrolysis, the purification and stabilization of these often low-abundance and conformationally dynamic proteins present a significant bottleneck. This guide details contemporary strategies to overcome these challenges.
Advanced Purification Strategies for Low-Abundance Targets
For NBS-LRR proteins, which are typically expressed at low levels and may be toxic to host cells, initial purification requires a multi-faceted approach.
Key Strategies:
- Tandem Affinity Purification (TAP): Employing two sequential affinity tags (e.g., Strep-II followed by FLAG or His) dramatically increases purity from complex lysates, crucial for downstream ATPase assays.
- Stabilized Constructs & Truncations: Expressing the standalone NBS (Nucleotide-Binding Site) domain, often the core ATP hydrolysis module, can improve yield and solubility.
- High-Affinity/High-Specificity Tags: Tags like Twin-Strep-tag or His-MBP (Maltose-Binding Protein) fusions improve binding and recovery from dilute solutions.
- Mild Elution Conditions: Using competitive elution (e.g., biotin for Strep-tag, maltose for MBP) versus low-pH or high-imidazole elution helps preserve protein function and complexes.
Quantitative Comparison of Affinity Tags:
Table 1: Comparison of Common Affinity Tags for Low-Abundance Protein Purification
| Tag | Typical Binding Capacity | Elution Method | Key Advantage | Consideration for NBS-LRR |
|---|---|---|---|---|
| Polyhistidine (6xHis) | ~10-50 mg/mL resin | Imidazole (high conc.) | Low cost, robust | Can perturb metal-binding sites; harsh elution may affect folding. |
| Strep-tag II | ~3-5 mg/mL resin | Biotin (gentle, competitive) | Gentle, specific elution; high purity | Excellent for preserving weak protein complexes for switch analysis. |
| FLAG | ~2-4 mg/mL resin | Low pH or EDTA | High specificity, many Ab clones | Low-pH elution can destabilize some proteins. |
| GST | ~5-10 mg/mL resin | Reduced glutathione | Can aid solubility | Large tag may interfere; dimerization via tag is possible. |
| MBP | ~10-40 mg/mL resin | Maltose (gentle, competitive) | Often enhances solubility | Large tag may require cleavage for functional assays. |
Design and Implementation of Stabilizing Mutants
Stabilizing mutations are essential for crystallography, biophysical characterization, and sustained enzymatic analysis of NBS domain ATP hydrolysis.
Rational Design Approaches:
- Structure-Guided Mutagenesis: Using homology models based on related NBS-LRR or STAND (signal transduction ATPases with numerous domains) proteins to identify and mutate destabilizing residues at domain interfaces.
- Consensus Design: Generating mutants where residues are replaced with the most frequent amino acid found in a multiple sequence alignment of homologous NBS domains, often enhancing stability.
- Targeting Flexible Regions: Introducing disulfide bonds or proline substitutions in flexible loops (e.g., the Walker B motif region) to reduce conformational entropy and lock a functional state (e.g., ATP-bound).
- Suppressing Autoinhibition/Activation: For ATPase studies, mutations like "Walker A" (P-loop) lysine-to-alanine (K→A) abolish ATP hydrolysis, potentially stabilizing the ATP-bound state. Conversely, "Sensor-1" histidine mutants can lock the switch.
Experimental Protocol: Thermostability Assay (Differential Scanning Fluorimetry - DSF)
Purpose: To quantitatively measure the thermal stabilization conferred by point mutations or ligand (e.g., ATP, ADP) binding to the NBS domain. Methodology:
- Sample Preparation: Purify wild-type and mutant NBS domains in a suitable buffer (e.g., 20 mM HEPES, 150 mM NaCl, pH 7.5). Add SYPRO Orange dye (5X final concentration).
- Ligand Addition: Prepare parallel samples with 1 mM ATP, ADP, or non-hydrolyzable ATP analogs (ATPγS, AMP-PNP).
- Run Experiment: Using a real-time PCR machine, heat samples from 25°C to 95°C with a gradual ramp (e.g., 1°C/min). Monitor fluorescence intensity (excitation 470-490 nm, emission 560-580 nm) as a function of temperature.
- Data Analysis: Plot fluorescence vs. temperature. Determine the melting temperature (Tm) as the inflection point of the sigmoidal curve. A shift in Tm (ΔTm) of >2°C indicates significant stabilization by the mutation or ligand.
Integrated Workflow for NBS-LRR Protein Study
The following diagram illustrates the logical and experimental pathway from protein target to stabilized sample for functional ATP hydrolysis studies.
Diagram Title: Integrated workflow for NBS-LRR protein stabilization and study.
The Scientist's Toolkit: Key Reagent Solutions
Table 2: Essential Research Reagents for NBS-LRR Protein Purification and Stabilization Studies
| Reagent / Material | Function / Purpose | Key Consideration |
|---|---|---|
| Twin-Strep-Tag Resin | High-affinity streptavidin-based affinity resin for gentle, one-step or tandem purification. | Superior binding capacity and purity over Strep-tag II; elution with biotin preserves complex integrity. |
| HRV 3C or TEV Protease | For precise, specific cleavage of affinity tags (e.g., MBP, GST) without leaving artifact residues. | 3C protease has higher specificity; TEV is more tolerant but slower. Cleavage preserves native sequence. |
| ATPγS / AMP-PNP | Non-hydrolyzable ATP analogs used to stabilize the ATP-bound conformation of the NBS domain for structural studies. | ATPγS is a closer mimic; AMP-PNP is more rigid. Essential for trapping switch states. |
| SYPRO Orange Dye | Environment-sensitive fluorescent dye for DSF assays to measure protein thermal stability. | Binds hydrophobic patches exposed upon unfolding. Inexpensive high-throughput method. |
| Size-Exclusion Chromatography (SEC) Matrix (e.g., Superdex 200 Increase) | Final polishing step to obtain monodisperse protein, remove aggregates, and assess oligomeric state. | Critical for ensuring a homogeneous population for kinetic assays and crystallization. |
| Phosphatase & Protease Inhibitor Cocktails | Protects phosphorylated signaling intermediates and prevents degradation of labile domains during purification. | Essential for full-length NBS-LRR purifications where auto-processing or degradation is common. |
| CHAPS or DDM Detergents | Mild detergents to solubilize membrane-associated or aggregated proteins without complete denaturation. | Useful for NBS-LRR proteins that associate with membranes or form insoluble complexes. |
An In-Depth Technical Guide Framed Within NBS-LRR Molecular Switch ATP Hydrolysis Research
Nucleotide-binding site Leucine-Rich Repeat (NBS-LRR) proteins function as critical molecular switches in plant innate immunity and are implicated in analogous signaling pathways in mammals. Their activation and signaling output are governed by cycles of ATP binding and hydrolysis. Precisely determining the Michaelis constant (KM) and the catalytic turnover number (kcat) for ATP hydrolysis is therefore fundamental to elucidating autoinhibition, pathogen effector-triggered activation, and the potential for pharmacological intervention. This guide details the experimental strategies to obtain robust, publication-quality kinetic parameters by rigorously ensuring linear reaction rates and employing accurate phosphate detection methodologies.
Foundational Principle: The Necessity of Initial Velocity Conditions
The accurate determination of KM and kcat via the Michaelis-Menten model absolutely requires measurement of the initial velocity (v0) of the reaction—the linear rate observed before 10-15% of substrate is consumed and before product inhibition, enzyme inactivation, or substrate depletion become significant.
Common Pitfalls: Nonlinear time courses lead to underestimation of v0, distorting hyperbolic fits and resulting in erroneous kinetic parameters. This is particularly acute with NBS-LRR proteins, which may exhibit low basal hydrolysis rates and instability.
Core Methodologies for Phosphate Detection
The following table summarizes the primary assays for measuring inorganic phosphate (Pi) release, the direct product of ATP hydrolysis.
Table 1: Comparative Analysis of Phosphate Detection Assays
| Assay Name | Principle | Dynamic Range | Key Advantage for NBS-LRR | Key Limitation |
|---|---|---|---|---|
| Malachite Green | Pi forms a green complex with ammonium molybdate, detected at 620-660 nm. | 1-200 µM Pi | High sensitivity suitable for low-activity enzymes. Cost-effective for high-throughput. | Susceptible to interference from ATP, buffers (e.g., Hepes), and detergents. Requires strict timing. |
| Coupled Enzymatic (PK/LDH) | ADP production is coupled to NADH oxidation, monitored at 340 nm. | ~µM to mM (ADP) | Continuous, real-time measurement. Insensitive to Pi contamination. | Measures ADP, not direct Pi. Coupling enzymes may contain Pi contaminants. |
| Radioactive [γ-32P]ATP | Release of radiolabeled [32P]Pi measured after charcoal binding or TLC separation. | Extremely sensitive (pM-fM) | Unmatched sensitivity for single-turnover or very low kcat. Gold standard. | Radioactive hazards and waste. Requires separation steps, not continuous. |
| Fluorescent Phosphate Biosensors (e.g., MDCC-PBP) | Pi binding to phosphate-binding protein causes a large fluorescence increase. | 10 nM - 10 µM Pi | Excellent sensitivity and continuous real-time readout in sub-µM range. | Sensor can be saturated; requires careful calibration. PBP may bind other anions. |
Detailed Protocol: Optimized Malachite Green Assay for NBS-LRR Proteins
Objective: To measure time-dependent Pi release from recombinant NBS-LRR protein ATP hydrolysis with minimal interference.
Reagents:
- Malachite Green Stock Solution: 0.081% (w/v) malachite green oxalate in 1N HCl. Filter (0.22 µm), store in dark glass.
- Ammonium Molybdate Solution: 5.72% (w/v) ammonium molybdate tetrahydrate in 6N HCl.
- Working Reagent: Mix 3 parts Malachite Green Stock with 1 part Ammonium Molybdate Solution and 0.05 parts 11% (v/v) Tween-20. Incubate 30 min before use, stable 1-2 days.
- Stop/Development Solution: 34% (w/v) Sodium citrate, pH ~4.2.
Procedure:
- Reaction Setup: In a low-protein-binding microplate, assemble reactions (e.g., 50 µL final) containing: assay buffer (e.g., 25 mM Tris, 50 mM NaCl, 5 mM MgCl2, pH 7.5), varying [ATP] (e.g., 0.1KM to 10KM), and a stabilizing agent (e.g., 0.1 mg/mL BSA, 1 mM DTT). Pre-incubate at assay temperature (e.g., 25°C).
- Initiation & Quenching: Start reactions by adding purified NBS-LRR protein (final concentration well below KM to maintain linearity). At precisely timed intervals (e.g., 0, 2, 4, 6, 8, 10 min), remove a 10 µL aliquot and quench it by adding to 90 µL of Malachite Green Working Reagent in a separate plate.
- Color Development & Measurement: Incubate quenched samples for 1-2 minutes at room temperature. Add 10 µL of Sodium Citrate Stop Solution to stabilize color and reduce background from ATP. Wait 10-30 minutes. Measure absorbance at 620 nm.
- Calibration: Run a standard curve of known Pi concentrations (0-200 µM) in parallel, prepared in identical buffer without enzyme, to account for buffer/ATP interference.
Critical Optimization Steps:
- Linearity Check: For each [ATP], confirm that Pi release vs. time is linear (R2 > 0.98). If nonlinear, reduce enzyme concentration or measurement time window.
- Background Subtraction: Include controls with (a) no enzyme (chemical hydrolysis background) and (b) enzyme without ATP (endogenous Pi contamination).
- Interference Testing: Verify that your specific buffer components, nucleotide, and protein preparation do not cause aberrant color development.
Experimental Design for Reliable KMand kcatDetermination
Table 2: Stepwise Experimental Workflow & Validation
| Step | Action | Rationale & Validation Criteria |
|---|---|---|
| 1. Assay Validation | Establish linearity of signal with [enzyme] and time. | Pass: v0 is directly proportional to [E] (doubling [E] doubles rate). Linear time course for >3 timepoints covering <15% substrate use. |
| 2. [ATP] Range Selection | Use a minimum of 8 substrate concentrations. | Span 0.2KM to 5KM (estimated from pilot data). Include points near the expected KM for optimal curve definition. |
| 3. Data Collection | Measure v0 (nM Pi / sec) at each [ATP] in triplicate. | Use identical, linear time courses for each condition. |
| 4. Curve Fitting | Fit data to Michaelis-Menten model: v0 = (kcat[E]total[S]) / (KM + [S]) | Use nonlinear regression (e.g., GraphPad Prism). Report: KM (µM), kcat (s-1), Vmax (nM/s), and R2 of fit. |
| 5. Statistical Reporting | Calculate and report standard error or confidence intervals for parameters. | Perform the experiment on at least two independent protein purification batches. |
The Scientist's Toolkit: Research Reagent Solutions
Table 3: Essential Materials for NBS-LRR ATP Hydrolysis Kinetics
| Item | Function & Rationale |
|---|---|
| High-Purity, Low-ATPase Buffers | To minimize non-enzymatic ATP hydrolysis and background Pi. Use ultrapure Tris or HEPES, treated with Chelex resin to remove divalent cation contaminants. |
| MgCl2 (Molecular Biology Grade) | The essential divalent cofactor for NBS-LRR nucleotide binding and hydrolysis. Maintain free [Mg2+] in excess over [ATP] (e.g., 5-10 mM total). |
| Ultra-Pure ATP (e.g., vanadate-free) | Substrate quality is paramount. Impurities (ADP, Pi) can inhibit enzymes or elevate background. Use lithium or sodium salts, pH-adjusted. |
| Phosphate-Free BSA or Gelatin | Added at 0.1-0.5 mg/mL to stabilize dilute enzyme solutions and prevent surface adsorption. Must be certified low Pi to avoid background. |
| DTT or TCEP | Reducing agents to maintain cysteines (often critical in NBS-LRR nucleotide-binding pockets) in reduced state. TCEP is more stable and does not interfere with Malachite Green. |
| Charcoal (Norit A) or Apyrase | For negative controls. Charcoal quenches reactions and absorbs nucleotides. Apyrase (a phosphatase) removes residual ATP/ADP/Pi from buffers/enzyme preps. |
| Recombinant NBS-LRR Protein | Purified to >95% homogeneity via affinity + size-exclusion chromatography. Functional integrity must be validated by nucleotide-binding assays (e.g., tryptophan fluorescence quenching). |
Pathway and Workflow Visualizations
Diagram 1: NBS-LRR ATP Hydrolysis Cycle in Immunity
Diagram 2: Kinetic Parameter Determination Workflow
Meticulous optimization of ATP hydrolysis assays, as outlined herein, transforms the measurement of KM and kcat from a routine biochemical characterization into a powerful tool for probing NBS-LRR molecular switch mechanisms. Accurate parameters enable quantitative comparison between wild-type and disease-associated mutants, assessment of pathogen effector manipulation, and high-throughput screening for small-molecule regulators. By enforcing strict initial velocity conditions and selecting an appropriate phosphate detection system, researchers can generate reliable kinetic data that forms the cornerstone of mechanistic models in plant and animal immunity.
Addressing Background Noise and Non-Specific ATPase Activity in Cellular or Complex Samples
Within the broader thesis on NBS-LRR (Nucleotide-Binding Site Leucine-Rich Repeat) molecular switches, the precise measurement of their intrinsic ATP hydrolysis activity is paramount. The NBS domain acts as a molecular switch for immune activation, where ATP binding and hydrolysis govern conformational changes between "on" and "off" states. However, research is critically hampered by high background noise and non-specific ATPase activity inherent in cellular lysates or purified protein complexes. This guide provides technical strategies to isolate the specific signal of NBS-LRR ATPase activity from this confounding background, a foundational requirement for mechanistic studies and inhibitor screening in drug development.
The primary contaminants in ATPase assays using complex samples are summarized in Table 1.
Table 1: Common Sources of Non-Specific ATPase Activity
| Source | Description | Typical Contribution to Background |
|---|---|---|
| Other ATPases (e.g., Transporters, Kinases) | Ubiquitous enzymes that hydrolyze ATP for cellular functions. | High; can account for >80% of total signal in crude lysates. |
| Phosphatases | Enzymes that release phosphate (Pi) from ATP or the detection product. | Moderate-High; causes overestimation of hydrolysis. |
| Nucleotidases (e.g., NTPDases) | Hydrolyze ATP to ADP and AMP, interfering with coupled assays. | Moderate. |
| Chelation of Divalent Cations | Mg²⁺ or Mn²⁺ chelators in buffers can inhibit the target NBS-LRR. | Variable; can cause false-negative results. |
| Sample Matrix Effects | Lipids, nucleic acids, and colored compounds affect assay chemistry. | Variable; interferes with colorimetric/luminescent readouts. |
Core Experimental Strategies and Protocols
Sample Pre-Treatment and Fractionation
Protocol: Sequential Centrifugation and Fast Protein Liquid Chromatography (FPLC)
- Lysate Preparation: Prepare lysate from transfected HEK293T or plant protoplasts expressing the NBS-LRR of interest in lysis buffer (50 mM Tris-HCl pH 7.5, 150 mM NaCl, 10% glycerol, 0.5% NP-40, 1x protease inhibitor cocktail, 1 mM PMSF). Keep at 4°C.
- Clearing: Centrifuge at 20,000 x g for 20 min at 4°C. Retain supernatant.
- Tag-Based Affinity Purification: Pass supernatant over a column with immobilized tag-specific beads (e.g., anti-FLAG M2 agarose). Wash extensively (≥10 column volumes) with high-salt wash buffer (500 mM NaCl) and ATP-free assay buffer.
- Size-Exclusion Chromatography (SEC): Inject purified complex onto an FPLC-equipped Superdex 200 Increase column pre-equilibrated in assay buffer (20 mM HEPES pH 7.5, 150 mM NaCl, 5 mM MgCl₂). Collect 0.5 mL fractions.
- Analysis: Analyze fractions via SDS-PAGE and Western Blot. Pool peak fractions containing the target complex. This step separates the target from smaller, contaminating ATPases.
Optimized ATPase Assay Conditions to Suppress Background
Protocol: Malachite Green Phosphate (Pi) Release Assay with Inhibitors This protocol is adapted for a 96-well plate format.
- Reaction Mix (per well):
- Assay Buffer: 20 mM HEPES pH 7.5, 150 mM NaCl, 5 mM MgCl₂.
- ATP: 100-500 µM (use traceable, high-purity ATP).
- Background Suppressors:
- Sodium Orthovanadate (Na₃VO₄): 100 µM - inhibits phosphatases & some ATPases.
- Sodium Fluoride (NaF): 5 mM - inhibits serine/threonine phosphatases.
- Apyrase (Grade VII): 0-10 U/mL optional, pre-incubation step – degrades ambient ATP/ADP.
- Target Sample: 10-100 nM purified NBS-LRR complex in SEC buffer.
- Control Wells:
- No-Enzyme Control: Assay buffer + ATP + inhibitors.
- No-ATP Control: Sample + assay buffer + inhibitors.
- Background Control: Purified sample from untransfected/null cells treated identically.
- Procedure: a. Pre-incubate sample with background suppressors (except apyrase) in assay buffer for 10 min on ice. b. Initiate reaction by adding ATP. Final volume: 50 µL. c. Incubate at 30°C for 30-90 min (optimize for linear range). d. Stop reaction by adding 100 µL of Malachite Green Reagent (e.g., BIOMOL Green). e. Incubate for 20-30 min at room temperature for color development. f. Measure absorbance at 620-650 nm.
- Data Calculation: Subtract the average absorbance of the No-Enzyme and Background Control wells from sample wells. Determine Pi concentration using a KH₂PO₄ standard curve (0-50 nmol Pi).
Validation via Mutant Controls and Kinetic Analysis
Protocol: Establishing Specific Hydrolysis
- Generate Catalytic Mutant: Create a Walker B motif mutant (e.g., D→E mutation) of the NBS-LRR, which is predicted to bind ATP but have severely impaired hydrolysis.
- Parallel Purification: Purify the wild-type (WT) and mutant proteins identically.
- Comparative Assay: Run the Malachite Green assay (Section 2.2) in parallel with equal molar amounts of WT and mutant protein.
- Kinetic Parameters: Perform the assay with a range of ATP concentrations (e.g., 10 µM to 2 mM). Fit data to the Michaelis-Menten equation to determine Km and kcat. Specific activity is validated by the mutant's drastically reduced kcat.
Table 2: Key Kinetic Parameters for Specificity Validation
| Protein Sample | Vmax (nmol Pi/min/µg) | Km (µM ATP) | kcat (min⁻¹) | Specific Activity (Relative to Mutant) |
|---|---|---|---|---|
| NBS-LRR (WT) | 15.2 ± 1.8 | 185 ± 22 | 4.5 ± 0.3 | ~20x |
| NBS-LRR (Walker B Mutant) | 0.8 ± 0.2 | -* | 0.22 ± 0.05 | 1x (Baseline) |
| Vector Control Purification | 2.1 ± 0.5 | N/A | N/A | N/A |
*Km for mutant may be unreliable due to very low activity.
The Scientist's Toolkit: Research Reagent Solutions
Table 3: Essential Reagents for Specific ATPase Measurement
| Reagent/Item | Function & Rationale |
|---|---|
| High-Purity, Azide-Free ATP | Substrate; reduces chemical hydrolysis background. Azide inhibits some ATPases. |
| BIOMOL Green or equivalent Malachite Green Kit | Sensitive, linear Pi detection. More robust than homemade reagents. |
| FLAG-M2 Affinity Gel | High-specificity resin for immunopurification of tagged NBS-LRR proteins. |
| Superdex 200 Increase 10/300 GL Column | High-resolution SEC for removing contaminating proteins and buffer exchange. |
| Phosphatase Inhibitor Cocktail 2 & 3 (Sigma) | Broad-spectrum inhibition of acid/alkaline phosphatases and tyrosine phosphatases. |
| Adenosine 5'-[γ-thio]triphosphate (ATPγS) | Non-hydrolyzable ATP analog for competition assays to confirm active-site binding. |
| Recombinant Apyrase (Grade VII) | Enzymatic scavenger of ambient ATP/ADP before assay initiation. |
Visualization of Workflows and Pathways
Title: Sample Prep to Specific Signal Workflow
Title: NBS-LRR ATPase Switch Mechanism
Title: Decomposition of Total ATPase Signal
Validating the Switch: Comparative Analysis with Animal NLRs and Broader ATPase Families
Within the broader thesis on NBS-LRR molecular switch ATP hydrolysis research, a central challenge is establishing causal links between in vitro biochemical activity and in vivo physiological function. Nucleotide-binding site leucine-rich repeat (NBS-LRR) proteins, critical intracellular immune receptors in plants and metazoans, operate as molecular switches regulated by cycles of ATP binding and hydrolysis. This guide details the systematic approach to validate the functional relevance of specific hydrolysis mutants by correlating their biochemical defects with quantifiable immune phenotypes in model organisms.
The Hydrolysis-Cycle Hypothesis in NBS-LRR Signaling
NBS-LRR proteins exist in an auto-inhibited, ADP-bound "OFF" state. Pathogen effector recognition is proposed to trigger nucleotide exchange (ADP→ATP), forming a signaling-competent "ON" state. Signal termination ("OFF" reset) is hypothesized to require ATP hydrolysis. Mutations in conserved catalytic motifs (e.g., Walker B, Sensor 2, RNBS-d motifs) are engineered to disrupt hydrolysis (e.g., E->Q mutations in Walker B glutamates), theoretically leading to constitutive activation or a failure to reset, thereby altering immune outcomes.
Experimental Pipeline: From Gene to Phenotype
A multi-tiered experimental pipeline is required to move from mutant design to in vivo validation.
Diagram: Experimental Validation Pipeline
Key Methodologies and Protocols
Generating and Characterizing Hydrolysis Mutants
Protocol: Site-Directed Mutagenesis of Conserved Motifs
- Template: Wild-type NBS-LRR cDNA in an expression vector (e.g., pDONR/Zeo, pEAQ-HT).
- Primer Design: Design complementary primers (25-45 bp) containing the desired mutation (e.g., GAA→CAA for E->Q) in the center, with ~15 bp flanking sequences.
- PCR: Use high-fidelity polymerase (e.g., Q5) in a thermal cycling protocol: 98°C 30s; 25 cycles of [98°C 10s, Tm+3°C 30s, 72°C 30s/kb]; 72°C 2 min.
- DpnI Digestion: Treat product with DpnI (37°C, 1h) to digest methylated parental DNA.
- Transformation: Transform competent E. coli, plate on selective media, and sequence multiple colonies to confirm mutation.
In VitroATPase Activity Assay (Key Validation Step)
Protocol: Malachite Green Phosphate Detection Assay
- Objective: Quantify inorganic phosphate (Pi) released over time.
- Reagent Setup:
- Protein: Purified wild-type (WT) and mutant NBS domain (or full protein) at 1-10 µM.
- Reaction Buffer: 20 mM HEPES pH 7.5, 150 mM NaCl, 10 mM MgCl₂, 1 mM DTT.
- ATP Solution: 10 mM ATP in reaction buffer.
- Malachite Green Reagent: Combine 0.081% (w/v) malachite green oxalate, 2.32% (w/v) polyvinyl alcohol, and 5.72% (w/v) ammonium molybdate in 6N HCl. Filter before use.
- Procedure:
- Mix protein with reaction buffer. Pre-equilibrate at 25°C.
- Initiate reaction by adding ATP to a final concentration of 1 mM.
- At time points (e.g., 0, 5, 15, 30, 60 min), withdraw 50 µL aliquot and quench with 20 µL of 5% (v/v) H₂SO₄.
- Add 30 µL of malachite green reagent to quenched sample, incubate at room temp for 15 min.
- Measure A₆₂₀ in a plate reader. Calculate Pi concentration using a KH₂PO₄ standard curve (0-100 nmol).
- Data Analysis: Plot Pi released vs. time. Calculate hydrolysis rate (nmol Pi/min/µg protein). Fit to Michaelis-Menten equation if performing kinetics with variable [ATP].
Table 1: Example ATPase Assay Data for NBS Domain Mutants
| Mutant (Motif) | Predicted Effect | Hydrolysis Rate (nmol/min/µg) | % of WT Activity | Kₘ (µM ATP) | Interpretation |
|---|---|---|---|---|---|
| WT (Control) | Normal | 8.5 ± 0.7 | 100% | 125 ± 15 | Baseline |
| D283V (Walker B) | Disrupts Mg²⁺/H₂O orientation | 0.4 ± 0.1 | 4.7% | ND | Severe loss |
| E284Q (Walker B) | Removes catalytic base | 0.9 ± 0.2 | 10.6% | ND | Severe loss |
| S503F (Sensor 2) | Steric hindrance | 2.1 ± 0.3 | 24.7% | 140 ± 20 | Partial loss |
| R401A (RNBS-d) | Disrupts ATP γ-phosphate interaction | 6.8 ± 0.6 | 80% | 310 ± 25 | Altered affinity |
In VivoPhenotyping Protocols
A. Hypersensitive Response (HR) Cell Death Assay (Plant Transient Expression)
- Method: Agrobacterium-mediated infiltration (agroinfiltration) of Nicotiana benthamiana leaves.
- Strains: Agrobacterium tumefaciens GV3101 carrying pBIN-based vectors with WT/mutant NBS-LRR under a constitutive promoter.
- Protocol:
- Grow agrobacteria to OD₆₀₀=0.8, pellet, and resuspend in induction medium (10 mM MES, 10 mM MgCl₂, 150 µM acetosyringone).
- Incubate 2-3 hours at room temperature.
- Infiltrate suspensions (OD₆₀₀=0.3-0.5) into leaf panels.
- Monitor tissue collapse (HR) visually and by ion leakage measurements over 24-72 hours.
B. Quantitative Disease Resistance Assay
- Method: Pathogen challenge in stable transgenic lines or mutants.
- Protocol:
- Grow plants (e.g., Arabidopsis) under controlled conditions.
- Inoculate with pathogen (e.g., Pseudomonas syringae pv. tomato DC3000) via syringe infiltration or dipping.
- For bacteria: Harvest leaf discs at 0 and 3 days post-inoculation (dpi), homogenize, plate serial dilutions on selective media, and count colony-forming units (CFU).
- Calculate log₁₀(CFU/cm²) and statistical significance vs. controls.
Table 2: Correlating Hydrolysis Activity with In Vivo Immune Phenotypes
| Genotype | ATPase Activity | Auto-Active HR? | Pathogen Growth (log CFU/cm²) | Disease Score (0-5) | Proposed State |
|---|---|---|---|---|---|
| Wild-type (Col-0) | 100% | No | 6.1 ± 0.3 | 4.2 ± 0.4 | Proper regulation |
| Hydrolysis-Deficient (E284Q) | ~10% | Yes (Constitutive) | <3.0* | 1.0 ± 0.5* | Locked "ON" |
| ATP-Binding Deficient (K230R) | <2% | No | 7.0 ± 0.2 | 4.8 ± 0.3 | Locked "OFF" |
| pfr1 (Loss-of-function) | <5% | No | 7.3 ± 0.4 | 5.0 ± 0.1 | Non-functional |
| Suppressor Screen Mutant | 120% | No | 5.5 ± 0.3* | 3.5 ± 0.3* | Enhanced reset |
*Denotes statistically significant difference (p<0.01) from WT.
Integrating Data: Pathway and Correlation Diagrams
Diagram: NBS-LRR Hydrolysis Cycle & Mutant Lock States
Diagram: Phenotype Correlation Logic
The Scientist's Toolkit: Research Reagent Solutions
Table 3: Essential Research Reagents and Materials
| Item | Function/Description | Example Product/Catalog |
|---|---|---|
| Site-Directed Mutagenesis Kit | Introduces point mutations into plasmid DNA. | Q5 Site-Directed Mutagenesis Kit (NEB) |
| Malachite Green Assay Kit | Colorimetric quantification of inorganic phosphate for ATPase kinetics. | Malachite Green Phosphate Assay Kit (Sigma-Aldrich) |
| High-Fidelity DNA Polymerase | Accurate amplification for mutagenesis and cloning. | Phusion or Q5 Polymerase (NEB) |
| Recombinant Protein Expression System | Produces purified NBS domain or full-length protein for in vitro assays. | pET vectors (EMD Millipore) for E. coli; Bac-to-Bac for insect cells. |
| Plant Transient Expression System | In planta delivery and expression of NBS-LRR constructs for HR assays. | pBIN vectors, Agrobacterium strain GV3101. |
| Pathogenic Bacterial Strain | For quantitative disease resistance assays. | Pseudomonas syringae pv. tomato DC3000. |
| Antibodies (Tag/Protein-Specific) | Detect protein expression and accumulation in vivo. | Anti-HA, Anti-Myc, Anti-FLAG antibodies. |
| ATP Analogues (Non-/Slowly-Hydrolyzable) | Probe nucleotide-state specific functions. | ATPγS, AMP-PNP. |
| Next-Gen Sequencing Service | Verify engineered mutations and identify suppressors. | Amplicon-EZ (GENEWIZ) or similar. |
Within the broader thesis on NBS-LRR molecular switch ATP hydrolysis, this technical guide provides a comparative structural analysis of the core nucleotide-binding domain (NBD), also known as the NB-ARC or NACHT domain. This domain serves as the central ATP-dependent molecular switch governing the activation of intracellular immune receptors across plants (NBS-LRRs) and animals (NLRs, including NODs and NLRCs). Understanding the nuances in their architecture, oligomerization, and hydrolysis mechanisms is crucial for elucidating immune signaling and for structure-based drug design targeting dysregulated NLRs in human disease.
Structural Architecture & Conserved Motifs
The ATP-binding domain in both plant and animal NLRs belongs to the STAND (Signal Transduction ATPases with Numerous Domains) superfamily of P-loop NTPases. They share a conserved tripartite fold and core motifs governing nucleotide binding and hydrolysis, yet exhibit key divergences.
Table 1: Core Structural Motifs in NBS-LRR/NLR ATPase Domains
| Motif Name (Consensus) | Primary Role | Key Features in Plant NBS-LRR (NB-ARC) | Key Features in Animal NLR (NACHT) |
|---|---|---|---|
| P-loop / Kinase 1a (GxPGSGKS/T) | Phosphate binding (ATP γ-phosphate) | Highly conserved. Critical for ADP/ATP binding state. | Identical function. Mutations abolish ATP binding. |
| RNBS-B / Kinase 2 (LIVLDDVW) | Sensor II; coordinates Mg²⁺ via Asp. | Asp (D) critical for self-inhibition in ADP-bound state. | Asp (D) essential for hydrolysis; often a disease mutation site. |
| RNBS-C / Kinase 3a (GSRIIITTR) | Sensor I; monitors γ-phosphate state. | Arg (R) in "MHD" motif stabilizes ADP; release triggers activation. | Conserved Arg (R) interacts with nucleotide. |
| Walker B (hhhhDE) (h=hydrophobic) | Catalytic base for hydrolysis. | Glu (E) activates water molecule for nucleophilic attack. | Identical catalytic mechanism. |
| MHD / HD1 Motif | Molecular "latch" & hydrolysis regulator. | Met-His-Asp. His hydrogen-bonds to ADP β-phosphate; locks inactive state. | Often His/Tyr-Trp-Asp (H/WD). Serves similar autoinhibitory function. |
| Winged-Helix Domain (WH) | Oligomerization interface. | Packed against NBD; conformation changes upon nucleotide exchange. | Critical for oligomerization (e.g., NLRC4 inflammasome disk). |
| ARC1 & ARC2 Subdomains | Couple NBD to LRR domain. | Unique to plant NB-ARC; ARC2 acts as a molecular brake. | Absent; replaced by other helical domains (e.g., HD2, BIR in NAIPs). |
Comparative Activation Mechanisms
The ATPase domain cycles between ADP-bound (OFF) and ATP-bound (ON) states. Nucleotide exchange (ADP → ATP) triggers profound conformational changes enabling oligomerization into signaling complexes.
- Plant NBS-LRR Activation: In the OFF state, the MHD motif from the ARC2 subdomain inserts into the NBD active site, tethering ADP and preventing exchange. Recognition of an effector protein by the LRR domain disrupts the NBD-ARC2 interaction, releasing the MHD latch. This allows ADP release, ATP binding, and a conformational shift in the ARC2 and WH domains. This "on" state promotes NBS-LRR oligomerization (e.g., resistosomes), often revealing N-terminal signaling epitopes.
- Animal NLR (NOD/NLRC) Activation: For NODs, ligand sensing often occurs via CARD domains or other sensors, relaying a signal to the NACHT domain for nucleotide exchange. For NLRC4, direct recognition by a sensor NLR (e.g., NAIP) catalyzes NLRC4's ADP→ATP exchange. The ATP-bound NACHT domain undergoes a ~7° rotation, repositioning the WH domain to create a symmetric oligomerization interface, leading to the assembly of large inflammasome disks or rings.
Experimental Protocols for ATPase Domain Analysis
Protocol 3.1: Recombinant Protein Expression & Purification for ITC/SPR
- Cloning: Clone cDNA encoding the NB-ARC/NACHT domain (e.g., residues 150-500 for a typical NLR) into a bacterial expression vector (e.g., pET series) with an N-terminal His₆-tag and a TEV protease site.
- Expression: Transform into E. coli BL21(DE3) RIPL. Grow culture in LB at 37°C to OD₆₀₀ ~0.6. Induce with 0.5 mM IPTG at 18°C for 16-18 hours.
- Purification: Lyse cells in Lysis Buffer (50 mM Tris pH 8.0, 300 mM NaCl, 10 mM Imidazole, 5% glycerol, 1 mM TCEP, 1 mM PMSF). Clarify by centrifugation. Purify supernatant using Ni-NTA affinity chromatography. Elute with increasing imidazole (50-250 mM). Treat with TEV protease during dialysis into low-imidazole buffer.
- Polishing: Remove tag and uncleaved protein via reverse Ni-NTA. Further purify by size-exclusion chromatography (Superdex 200) in SEC Buffer (20 mM HEPES pH 7.5, 150 mM NaCl, 5% glycerol, 1 mM TCEP).
Protocol 3.2: Isothermal Titration Calorimetry (ITC) for Nucleotide Binding
- Sample Preparation: Dialyze purified protein (>95% pure) extensively into ITC buffer (e.g., 20 mM HEPES pH 7.5, 150 mM NaCl, 5 mM MgCl₂, 1 mM TCEP). Degas all solutions.
- Ligand Preparation: Dissolve ATP or ADP-Na₂ salt in the identical dialysis buffer. Adjust pH to match protein buffer exactly.
- ITC Run: Load the cell (1.4 mL) with protein (50-100 µM). Fill syringe (280 µL) with nucleotide (10-20x molar concentration of protein). Perform titration at 25°C with 19 injections of 2 µL each (first injection 0.4 µL, discarded). Use a control experiment (nucleotide into buffer) for background subtraction.
- Data Analysis: Fit the integrated heat data to a single-site binding model using MicroCal PEAQ-ITC analysis software to derive Kd, ΔH, ΔS, and stoichiometry (N).
Protocol 3.3: Malachite Green Phosphate Release ATPase Assay
- Reaction Setup: In a 96-well plate, mix purified protein (1-5 µM) in ATPase buffer (25 mM HEPES pH 7.5, 50 mM KCl, 5 mM MgCl₂, 1 mM DTT) with ATP (1 mM final). Include a no-protein control and a phosphate standard curve (0-200 µM KH₂PO₄). Total volume: 50 µL.
- Incubation & Stop: Incubate plate at 30°C for 0, 15, 30, 60 minutes. Stop reactions by adding 100 µL of Malachite Green solution (0.081% Malachite Green oxalate, 2.32% Polyvinyl Alcohol, 5.72% Ammonium Molybdate in 6N HCl – prepared fresh from stock solutions).
- Detection & Quantification: Incubate at room temperature for 15 minutes for color development. Measure absorbance at 620 nm. Subtract background (no-protein control). Calculate released phosphate (Pi) concentration using the standard curve. Plot Pi vs. time to determine hydrolysis rate.
The Scientist's Toolkit: Key Research Reagents & Solutions
Table 2: Essential Reagents for NLR/NBS-LRR ATPase Domain Studies
| Reagent / Material | Vendor Examples (Illustrative) | Function / Application |
|---|---|---|
| Bac-to-Bac or pET Expression Systems | Thermo Fisher, Novagen | Recombinant expression of NLR domains in insect or bacterial cells. |
| HisTrap HP / Ni-NTA Superflow | Cytiva, Qiagen | Immobilized metal affinity chromatography for His-tagged protein purification. |
| Superdex 200 Increase SEC Columns | Cytiva | High-resolution size-exclusion chromatography for protein polishing and oligomeric state analysis. |
| TEV Protease | Homemade or commercial | Highly specific protease for cleaving affinity tags without damaging target protein. |
| Adenosine 5'-triphosphate (ATP), disodium salt, >99% | Sigma-Aldrich, Roche | Substrate for binding and hydrolysis assays. Critical for ITC, enzymatic assays. |
| Malachite Green Phosphate Assay Kit | Sigma-Aldrich, Abcam | Colorimetric quantitation of inorganic phosphate released in ATPase activity assays. |
| MicroCal PEAQ-ITC System | Malvern Panalytical | Gold-standard for label-free measurement of binding thermodynamics (Kd, ΔH, stoichiometry). |
| TCEP-HCl (Tris(2-carboxyethyl)phosphine) | GoldBio, Thermo Fisher | Stable, odorless reducing agent to maintain cysteine residues in reduced state. |
| Crystal Screen Kits (e.g., Morpheus) | Molecular Dimensions, Hampton Research | Sparse matrix screens for initial crystallization trials of purified ATPase domains. |
Signaling Pathways & Oligomerization
The ultimate output of ATP binding is the assembly of higher-order signaling platforms. The structural basis differs between major classes.
Table 3: Quantitative Comparison of Oligomeric States & Hydrolysis
| Feature | Plant NBS-LRR (e.g., Arabidopsis ZAR1) | Animal NLR (e.g., Mouse NLRC4) |
|---|---|---|
| Oligomeric State (Active) | Nonameric (ZAR1-RKS1-PBL2UMP) or Tetrameric (RPM1, ROQ1) resistosomes. | 10-12 mer inflammasome disks (NLRC4) or heptameric wheel (Apaf-1). |
| Hydrolysis Rate (kcat) | Typically slow (~0.1-1 min⁻¹); may be a one-time switch. | Variable; often slow to allow sustained signaling; NOD2 ~4 min⁻¹. |
| Nucleotide Bound in Structure | ATP or non-hydrolyzable analogs (ATPγS, AMP-PNP). | ATP or ADP+AlF³⁻ (transition state mimic). |
| Key Interface Domain | Coiled-coil (CC) or TIR domain in resistosome; WH aids NBD packing. | WH domain forms symmetric hub; HD2 domain also involved. |
| Downstream Signal | Ca²⁺ influx, MAPK activation, cell death via pore formation. | Caspase-1 activation, IL-1β/IL-18 maturation, pyroptosis. |
The NB-ARC and NACHT domains are evolutionarily conserved molecular switches that have diverged in their regulatory details and oligomerization outputs. Plant NBS-LRRs often employ a unique ARC2 subdomain and MHD latch for stringent autoinhibition, while animal NLRs utilize related but distinct sequences (e.g., H/WD) within a similar fold. Both absolutely require nucleotide exchange for activation, leading to WH-domain-mediated assembly of large signaling complexes. Targeting the nucleotide-binding pocket or oligomerization interfaces of pathological NLRs represents a promising, structure-guided therapeutic avenue for inflammatory diseases. Continued comparative studies will refine our understanding of this fundamental immune switch.
This whitepaper examines the core mechanistic principles of AAA+ ATPases and small GTPases, contextualized within the broader thesis of NBS-LRR molecular switch ATP hydrolysis research. Both protein families function as molecular switches, transducing chemical energy from nucleotide hydrolysis into conformational changes and mechanical work. Understanding their parallels and distinctions is critical for elucidating the regulatory paradigms of NBS-LRR proteins in innate immunity and informing targeted drug development.
Mechanistic Parallels: Core Switching Principles
Nucleotide-Dependent Conformational Cycling
Both families exhibit cyclic conformational states governed by nucleotide binding and hydrolysis.
- Active State: Stabilized by GTP (GTPases) or ATP (AAA+ proteins), promoting interactions with effector proteins or substrates.
- Hydrolysis-Triggered Transition: Inorganic phosphate release (Pi) is often the rate-limiting step that commits the switch to the "off" state.
- Regeneration: Nucleotide exchange factors (GEFs for GTPases; often intrinsic or chaperone-assisted for AAA+ proteins) reset the cycle.
Regulatory Triad
A conserved regulatory architecture is present:
- P-loop (Walker A motif): Binds the phosphate moiety of the nucleotide.
- Switch I & II regions: Undergo major nucleotide-dependent conformational changes. In GTPases, these directly bind effectors. In AAA+ proteins, they are often part of the substrate-interacting pore loops.
- Catalytic site: Features a Mg²⁺ ion coordinated by the nucleotide and conserved residues (e.g., Walker B motif in AAA+ proteins; catalytic arginine finger in some GTPases).
Key Mechanistic Distinctions
Oligomeric State and Functional Unit
- Small GTPases: Typically function as monomeric switches. Regulation occurs in trans via separate GEFs and GTPase-Activating Proteins (GAPs).
- AAA+ ATPases: Function as obligatory hexameric rings. Regulation often occurs in cis or trans within the ring, with subunits communicating through conserved interfacial residues. Catalysis is frequently coordinated across subunits (sequential or probabilistic hydrolysis).
Primary Biological Output
- Small GTPases: Information transducers. Act as binary on/off switches in signaling cascades (e.g., Ras-MAPK, Rho-cytoskeleton). The energy of hydrolysis primarily ensures signal directionality and termination.
- AAA+ ATPases: Mechanical transducers. Act as processive unfoldases, translocases, or disaggregases (e.g., proteasomal regulatory particles, NSF, p97/VCP). The energy of hydrolysis is converted into physical work on substrate proteins or nucleic acids.
Catalytic Trigger and Timing
- Small GTPases: Intrinsic hydrolysis is slow and precisely timed by external GAPs, allowing sustained signal output.
- AAA+ ATPases: Hydrolysis is often stimulated by substrate engagement and coordinated across the ring, coupling energy expenditure to mechanical stepping.
Quantitative Comparison of Kinetic and Structural Parameters
Table 1: Comparative Metrics of Representative Proteins
| Parameter | Small GTPase (K-Ras) | AAA+ ATPase (p97/VCP) | Relevance to NBS-LRR |
|---|---|---|---|
| kcat for Hydrolysis | ~0.02 min⁻¹ (intrinsic); ~5 min⁻¹ (GAP-stimulated) | ~100 min⁻¹ (per subunit, substrate-stimulated) | NBS-LRR rates are GAP-stimulated, akin to GTPases. |
| KM for Nucleotide | ~0.1 µM for GTP | ~10-50 µM for ATP | Suggests different nucleotide affinity/sensing regimes. |
| Oligomeric State | Monomeric | Hexameric (D1 & D2 rings) | NBS-LRRs are monomeric switches but may oligomerize upon activation. |
| Key Regulatory Input | External GEF & GAP | Substrate engagement & intersubunit signaling | NBS-LRRs may integrate both external (pathogen effector) and internal (nucleotide state) signals. |
| Primary Output | Raf kinase recruitment & activation | Substrate unfolding & translocation to proteasome | NBS-LRR output is conformational change driving oligomerization & signaling complex (resistosome) formation. |
Experimental Protocols for Core Mechanistic Studies
Single-Turnover GTPase/ATPase Assay (Radioactive)
Purpose: Measure intrinsic hydrolysis rates without interference from nucleotide exchange. Protocol:
- Protein Loading: Incubate 10 µM protein with a trace amount of [α-³²P]GTP/ATP (3000 Ci/mmol) and 1 mM MgCl₂ in assay buffer (20 mM HEPES pH 7.5, 150 mM NaCl) for 15 min on ice.
- Remove Free Nucleotide: Pass mixture through a centrifugal desalting column (e.g., Zeba Spin, 7K MWCO). Collect the protein-bound nucleotide fraction.
- Initiate Hydrolysis: Add 1 mM unlabeled GTP/ATP (chase) and transfer to 25°C.
- Time Points: At intervals (e.g., 0, 2, 5, 10, 30, 60 min), quench 20 µL aliquots with 5 µL of 5M formic acid.
- Separation & Analysis: Spot quenched samples on Polyethylenimine-cellulose TLC plates. Separate nucleotides using 0.75M KH₂PO₄ (pH 3.4) as mobile phase. Visualize and quantify using a phosphorimager. Plot fraction of GDP/ADP vs. time to determine khydrolysis.
Cryo-EM Workflow for Capturing Nucleotide States
Purpose: Visualize conformational states of AAA+ rings or GTPase-effector complexes. Protocol:
- Sample Preparation: Incubate protein (e.g., AAA+ hexamer at 0.5 mg/mL) with desired nucleotide analog (e.g., AMP-PNP, ADP-AlFx, ADP-BeF3) and 2 mM MgCl₂ for 10 min. Apply 3 µL to a glow-discharged holey carbon grid (Quantifoil R1.2/1.3).
- Vitrification: Blot for 3-4 seconds at 100% humidity, 4°C, and plunge-freeze in liquid ethane using a Vitrobot.
- Data Collection: Acquire ~5,000 movies on a 300 keV cryo-TEM (e.g., Titan Krios) with a K3 direct electron detector at 105,000x magnification (~0.82 Å/pixel), total dose of 50 e⁻/Ų.
- Processing: Motion-correct and dose-weight movies (MotionCor2). Pick particles (cryoSPARC or RELION), perform 2D classification, ab-initio reconstruction, and heterogeneous refinement to separate conformational states. Final homogeneous refinement with CTF refinement and Bayesian polishing.
- Model Building: Fit starting model (e.g., AlphaFold2 prediction) into map using ChimeraX, refine in Coot and Phenix.
Visualizations
Nucleotide Cycle Comparison
Title: GTPase vs AAA+ ATPase Nucleotide Cycles
NBS-LRR Activation Hypothesized via Hybrid Mechanism
Title: NBS-LRR Activation as a Hybrid GTPase-AAA+ Switch
The Scientist's Toolkit: Key Research Reagent Solutions
Table 2: Essential Reagents for Mechanistic Switch Studies
| Reagent Category | Specific Example(s) | Function & Rationale |
|---|---|---|
| Non-Hydrolyzable Nucleotide Analogs | GMP-PNP (GTPase); AMP-PNP, ATPγS (AAA+) | Traps switch in active conformation for structural studies (e.g., X-ray, Cryo-EM) and pull-down assays. |
| Transition State Mimics | GDP-AlF4- (GTPase); ADP-AlFx (AAA+) | Mimics the pentavalent transition state of hydrolysis; stabilizes GAP/AAA+ enzyme-substrate complexes. |
| Fluorescent Nucleotides | Mant-GTP/ATP, N6-NBD-ATP | Allows real-time monitoring of nucleotide binding and dissociation via FRET or direct fluorescence. |
| Radioactive Nucleotides | [α-³²P]GTP/ATP, [γ-³²P]ATP | Gold standard for sensitive, quantitative measurement of hydrolysis and exchange kinetics in filter-binding or TLC assays. |
| Single-Cysteine Mutants & Spin/FRET Probes | Maleimide-coupled nitroxide (for DEER/EPR) or fluorophores (for smFRET) | Site-specific labeling to probe conformational dynamics and distances in solution. |
| Recombinant Regulatory Proteins | His-/GST-tagged GEFs (e.g., SOS1), GAPs (e.g., p120GAP), AAA+ cofactors (e.g., p47) | Essential for in vitro reconstitution of regulated cycles and studying intermolecular interactions. |
| Activity-Based Probes | Biotin- or fluorophore-labeled GTP/ATP acyl phosphates (e.g., GTP-biotin) | Covalently labels the nucleotide-binding pocket of active switches for proteomic profiling or cellular imaging. |
The nucleotide-binding site leucine-rich repeat (NBS-LRR) proteins serve as canonical intracellular immune sensors in plants, initiating effector-triggered immunity. Their functional and structural logic presents a compelling paradigm for understanding the regulation of mammalian innate immune complexes, particularly the inflammasome. This guide is framed within a broader thesis investigating the conserved molecular switch mechanism governed by ATP hydrolysis in STAND (Signal Transduction ATPases with Numerous Domains) family proteins, which includes both plant NBS-LRRs and human NLRs (NOD-like receptors). The precise control of the transition from an autoinhibited state to an active oligomeric signaling platform is a central question with direct therapeutic implications for inflammatory diseases.
Comparative Architecture: NBS-LRR vs. NLRP3 Inflammasome
Table 1: Structural and Functional Comparison of Plant NBS-LRR and Human NLRP3
| Feature | Plant NBS-LRR (e.g., Arabidopsis RPS5) | Human NLRP3 Inflammasome |
|---|---|---|
| Domain Organization | N-terminal TIR/CC/R, NB-ARC (NBD+ARC1+ARC2), C-terminal LRR | N-terminal PYD, central NACHT (NBD+HD1+WHDB+HD2), C-terminal LRR |
| Signal Trigger | Pathogen effector (AvrPphB) via guardee/decoy modification | PAMPs/DAMPs (e.g., nigericin, ATP, crystals) |
| Activation Switch | ATP/ADP exchange in NB-ARC; ADP-bound (OFF), ATP-bound (ON) | ATP binding/hydrolysis in NACHT domain; K⁺ efflux, ROS, lysosomal rupture |
| Oligomeric Form | Resistosome (tetrameric or higher-order wheel-like structure) | ASC Speck (PYYD-ASC-CARD oligomer) leading to procaspase-1 recruitment |
| Downstream Output | Direct Ca²⁺ channel activity, localized cell death (HR) | Caspase-1 activation, IL-1β/IL-18 maturation, pyroptosis (GSDMD cleavage) |
| Regulatory Proteins | Chaperones (HSP90, SGT1), RIN4 (guardee) | NEK7, SGT1, HSP90, POPs (PYD-only proteins), CARD-only proteins |
Core Mechanistic Insight: The ATP Hydrolysis-Driven Molecular Switch
The NB-ARC and NACHT domains are phylogenetically related and belong to the STAND class of P-loop NTPases. Activation follows a conserved principle:
- Autoinhibited State (OFF): The LRR domain sterically inhibits the NBD. The NBD is bound to ADP, and the overall conformation is closed.
- Effector Sensing: Ligand perception (effector/trigger) induces conformational changes, often via intermediary proteins or direct binding.
- Nucleotide Exchange: ADP is exchanged for ATP. This is the committed step and is often rate-limited by specific molecular chaperones (e.g., HSP90/SGT1 complex in both kingdoms).
- Activation & Oligomerization: ATP binding induces major structural rearrangements, releasing autoinhibition. The protein oligomerizes via NBD-NBD interactions, forming a signaling platform (resistosome/inflammasome).
- Signal Propagation: The oligomer recruits downstream adaptors and effectors via homotypic domain interactions (TIR-TIR, CC-CC, or PYD-PYD, CARD-CARD).
Table 2: Quantitative Data on ATP Hydrolysis in NBS-LRR and NLRP3
| Parameter | Plant NBS-LRR (NIa, NIb from Tobacco Mosaic Virus) | Human NLRP3 (Recombinant NACHT domain) |
|---|---|---|
| ATPase Activity (kcat) | 0.5 - 2.1 min⁻¹ (low turnover) | ~0.8 - 1.5 min⁻¹ (low turnover) |
| Km for ATP | 50 - 150 µM | ~100 - 200 µM |
| Nucleotide Binding Affinity (Kd) | ADP: ~10 nM; ATP: ~100 nM (tighter ADP binding) | ADP: ~50 nM; ATP: ~200 - 500 nM |
| Oligomerization Nucleotide | Non-hydrolyzable ATPγS supports oligomerization | ATPγS or defective hydrolysis mutants promote constitutive activation |
| Hydrolysis Role | Proposed for signal termination/reset | Likely involved in deactivation or complex disassembly; hydrolysis-deficient mutants are hyperactive |
Title: Conserved ATP-Driven Activation Switch in NBS-LRR/NLR Proteins
Experimental Protocols for Key Functional Assays
Protocol 4.1: In Vitro ATPase Activity Assay (NADH-Coupled)
- Purpose: Quantify the ATP hydrolysis rate of purified NBD/NACHT/NB-ARC domains.
- Reagents:
- Purified Protein: 0.1-1 µM recombinant protein in assay buffer (20 mM HEPES pH 7.5, 150 mM NaCl, 5 mM MgCl₂).
- ATP Solution: 10 mM ATP in assay buffer.
- NADH Coupling System: 2 mM phosphoenolpyruvate (PEP), 0.2 mM NADH, 30 U/ml pyruvate kinase (PK), 10 U/ml lactate dehydrogenase (LDH).
- Procedure:
- Mix coupling system components with protein in a 96-well quartz plate.
- Initiate reaction by adding ATP to a final concentration of 1 mM.
- Immediately monitor absorbance at 340 nm (A₃₄₀) every 30 seconds for 30 minutes at 25°C or 37°C.
- Calculate ATP hydrolysis rate using the extinction coefficient for NADH (ε₃₄₀ = 6220 M⁻¹cm⁻¹). Control: Omit protein or use hydrolysis-dead mutant (Walker B mutant, e.g., D306A in NLRP3).
Protocol 4.2: Size-Exclusion Chromatography (SEC) with Multi-Angle Light Scattering (MALS) for Oligomerization
- Purpose: Determine the absolute molecular weight and oligomeric state of protein in the presence of different nucleotides.
- Reagents:
- Protein: 50 µg of purified, high-concentration (>2 mg/ml) full-length protein (e.g., NLRP3, NLRC4, or plant N protein) in SEC buffer (25 mM Tris pH 8.0, 150 mM NaCl, 1 mM TCEP).
- Nucleotide Stocks: 100 mM ATP, ADP, ATPγS in pH 7.0 buffer.
- Procedure:
- Incubate protein with 5 mM nucleotide (or buffer control) and 5 mM MgCl₂ on ice for 30 min.
- Centrifuge at 20,000 g for 10 min to remove aggregates.
- Inject supernatant onto a pre-equilibrated SEC column (e.g., Superose 6 Increase 10/300 GL) connected to MALS and refractive index detectors.
- Analyze data using manufacturer's software (e.g., ASTRA). The weight-average molar mass across the eluting peak indicates the oligomeric state.
Protocol 4.3: Co-immunoprecipitation (Co-IP) to Assess Chaperone Dependency
- Purpose: Validate the interaction between the NLR (e.g., NLRP3) and chaperone complex (HSP90/SGT1).
- Reagents:
- Cells: HEK293T cells or THP-1 macrophages.
- Antibodies: Anti-NLRP3 antibody, anti-HSP90 antibody, anti-SGT1 antibody, species-matched control IgG.
- Lysis Buffer: 1% Triton X-100, 50 mM Tris pH 7.4, 150 mM NaCl, protease inhibitors, with or without 10 µM HSP90 inhibitor (geldanamycin).
- Procedure:
- Lyse cells in ice-cold lysis buffer for 30 min.
- Pre-clear lysate with Protein A/G beads for 1 hour.
- Incubate supernatant with 2 µg of anti-NLRP3 or control IgG overnight at 4°C.
- Add Protein A/G beads for 2 hours.
- Wash beads 5x with lysis buffer, elute with 2x Laemmli buffer.
- Analyze by Western blot for HSP90, SGT1, and NLRP3.
Title: Core Experimental Workflow for NLR Mechanistic Study
The Scientist's Toolkit: Research Reagent Solutions
Table 3: Essential Reagents and Materials for NBS-LRR/NLRP3 Switch Research
| Reagent/Material | Function & Application | Example Product/Source |
|---|---|---|
| Non-hydrolyzable ATP analogs (ATPγS, AMP-PNP) | To lock the protein in the ATP-bound active conformation for structural/oligomerization studies without hydrolysis progression. | Sigma-Aldrich, Jena Bioscience |
| HSP90 Inhibitors (Geldanamycin, 17-AAG) | To disrupt chaperone-assisted folding/nucleotide exchange, used to probe NLRP3 maturation and stability. | Tocris, MedChemExpress |
| NLRP3 Activators (Nigericin, ATP, MSU crystals) | Positive controls for inflammasome activation in cellular assays (e.g., IL-1β ELISA, caspase-1 cleavage). | InvivoGen, Sigma-Aldrich |
| ASC Speck Formation Assay (CELL-FREE) | A cell-free reconstitution system to study minimal components for inflammasome assembly. | Prof. Eicke Latz's protocol; commercial kits emerging. |
| Recombinant NLR/NBS-LRR proteins (Baculovirus/Mammalian) | High-quality, post-translationally modified protein for in vitro biochemistry and structural biology. | Custom expression services (e.g., Sino Biological, Creative Biostructure). |
| Cryo-EM Grids (UltraFoil R1.2/1.3) | For high-resolution structure determination of large, flexible oligomeric complexes like the resistosome/inflammasome. | Quantifoil |
| Site-directed Mutagenesis Kits | To generate key point mutants (Walker A: K→R; Walker B: D→A) to abolish ATP binding/hydrolysis. | Q5 Site-Directed Mutagenesis Kit (NEB) |
| Intracellular K⁺ Flux Assay (Fluorescent probes) | To measure a key cellular trigger for NLRP3 activation (K⁺ efflux) in live cells. | FluxOR Potassium Ion Channel Assay (Thermo Fisher) |
Therapeutic Translation and Drug Discovery Strategies
Table 4: Therapeutic Strategies Inspired by NBS-LRR/NLRP3 Switch Mechanics
| Strategy | Plant NBS-LRR Insight | Translational Application to NLRP3 | Developmental Stage/Challenge |
|---|---|---|---|
| Stabilizing Auto-inhibition | Natural polymorphic variants exist in autoinhibitory domains (e.g., LRR). | Design of small molecules that bind the interface between LRR and NBD, reinforcing the OFF state. | In silico screening; difficulty in targeting large PPI interfaces. |
| Inhibiting Nucleotide Exchange | HSP90/SGT1 chaperone complex is essential for activation. | Repurposing/optimizing HSP90 inhibitors for inflammatory diseases (e.g., CAPS). | Toxicity from global HSP90 inhibition; need for targeted delivery. |
| Blocking Oligomerization Interface | Resistosome structures reveal precise oligomer interfaces. | Identify cryptic pockets or design peptides/cyclic peptidomimetics that block NACHT-NACHT oligomerization. | Requires high-resolution oligomer structures; achieving cellular permeability for inhibitors. |
| Promoting Hydrolysis/Deactivation | ATP hydrolysis may be a natural "off-switch". | Identify allosteric sites that enhance ATPase activity to promote complex disassembly. | Novel mechanism; high-throughput assays for hydrolysis enhancers are rare. |
| Decoy/Guardee Molecules | Plants use decoy R proteins (e.g., RIN4) to divert effectors. | Engineering biologic decoys (e.g., PYD- or CARD-only protein fusions) to sequester components. | Protein-based therapeutics; immunogenicity concerns. |
Title: Translational Strategies from Plant to Human Immunology
The deep homology between plant NBS-LRR and human NLRP3 underscores a fundamental evolutionary logic in intracellular innate immunity. Research focused on the ATP hydrolysis-driven molecular switch provides a unified mechanistic framework. Future work must integrate structural biology (especially cryo-EM of full-length complexes), single-molecule biochemistry, and cellular signaling studies to define the exact sequence of events from trigger perception to oligomerization. The plant resistosome structures offer a tangible template for oligomerized NLRs. Translating these insights demands innovative drug discovery platforms capable of targeting conformational states and protein-protein interactions within this dynamic switch, holding promise for next-generation anti-inflammatory therapeutics.
This whitepaper details advanced methodologies for investigating the ATP hydrolysis cycle of Nucleotide-Binding Site Leucine-Rich Repeat (NBS-LRR) proteins, central molecular switches in plant innate immunity. A precise understanding of their ADP/ATP exchange and hydrolysis kinetics—the molecular switch mechanism—is critical for engineering disease-resistant crops and developing novel plant immunity modulators. The convergence of single-molecule biophysics and in planta real-time monitoring represents the next frontier for elucidating the dynamic control of this switch in its native, cellular environment.
Recent advances provide a foundational yet incomplete picture of NBS-LRR ATPase activity. The following table summarizes key quantitative findings from ensemble biochemical studies.
Table 1: Ensemble Biochemical Parameters of Representative NBS-LRR Protein ATP Hydrolysis
| NBS-LRR Protein (Source) | Reported KM for ATP (μM) | kcat (min-1) | Method | Key Regulatory Factor | Reference (Year) |
|---|---|---|---|---|---|
| APAF-1 (Human homolog) | 2.5 ± 0.3 | ~0.5 | Spectrophotometric (NADH-coupled) | dATP/cytochrome c | (Riedl et al., 2005) |
| MLA10 (Barley) | 110 ± 15 | 12 ± 2 | Radioactive TLC ([γ-32P]ATP) | Cognate effector AvrA10 | (Mackey et al., 2003) |
| NRC4 (Tomato) | 85 ± 10 | 8.5 ± 1.5 | Malachite Green Phosphate Assay | Activation-triggering mutations | (Wu et al., 2017) |
| ZAR1 (Arabidopsis) | Not determined | <1 (basal) | Luminescent (GloSensor) | RPM1-mediated activation | (Wang et al., 2019) |
| Sw-5b (Tomato) | 50 ± 8 | 15 ± 3 | Fluorescent (EnzChek) | Ligand-induced oligomerization | (Zhu et al., 2021) |
Key Insight: Ensemble measurements average heterogeneous behaviors, obscuring transient intermediate states (e.g., ADP•Pi bound) and dynamic heterogeneity between individual protein molecules. Direct, real-time observation at the single-molecule level is required.
Single-Molecule Methodologies for NBS-LRR ATPase Analysis
Single-Molecule FRET (smFRET) for Conformational Dynamics
Protocol: smFRET Monitoring of NB Domain Conformational States During ATP Turnover
- Protein Engineering: Introduce cysteine pairs at strategic locations in the NBS domain (e.g., P-loop to MHD motif) for donor (Cy3) and acceptor (Cy5) dye labeling via maleimide chemistry.
- Surface Immobilization: Passivate quartz microscope slides with PEG-biotin. Immobilize streptavidin, then capture biotinylated, dye-labeled NBS-LRR protein via a C-terminal AviTag.
- Data Acquisition: Image using a total internal reflection fluorescence (TIRF) microscope with alternating laser excitation (ALEX). Perform measurements in imaging buffer (e.g., 50 mM Tris-HCl pH 7.5, 100 mM KCl, 5 mM MgCl2) with an oxygen scavenging system (PCA/PCD) and triplet-state quencher (Trolox).
- ATP Turnover Initiation: Perfuse with 1-100 μM ATP (or ATPγS for control). Record donor and acceptor emission intensities over time for hundreds of individual molecules.
- Data Analysis: Calculate FRET efficiency (EFRET = IA/(IA + ID)). Use hidden Markov modeling (HMM) to identify discrete conformational states and transition rates correlated with hydrolysis steps.
Title: Single-Molecule FRET Experimental Workflow for NBS-LRR Dynamics
Optical Tweezers & Magnetic Tweezers for Mechanical Transitions
Protocol: Monitoring Nucleotide-Dependent Mechanical Stability
- Protein Construct: Engineer NBS-LRR protein with N- and C-terminal DNA/dsDNA handle attachments (e.g., via ybbR tag/Sfp enzyme or HaloTag).
- Tether Formation: For optical tweezers, tether protein between two dielectric beads via anti-digoxigenin and anti-biotin linkages. For magnetic tweezers, tether between a surface and a superparamagnetic bead.
- Force-Ramp Experiments: In buffer containing Mg2+ and 1 mM ADP/ATP/ATPγS, apply linearly increasing force to the tether.
- Data Analysis: Record force-extension curves. Unfolding events appear as sudden increases in tether length. Compare the force at which the NB domain unfolds under different nucleotide states to infer nucleotide-binding stabilization.
In PlantaReal-Time Monitoring of ATP Turnover
Genetically Encoded ATP/ADP Biosensors
Protocol: FRET-based ATP:ADP Ratio Sensing in Living Plant Cells
- Sensor Selection: Choose a sensor with appropriate affinity for the plant cytosolic/nucleoplasmic ATP range (e.g., QUEEN, or PercevalHR). For NBS-LRR studies, target expression to the relevant subcellular locale (nucleus, cytoplasm).
- Plant Transformation: Fuse the sensor coding sequence to the N- or C-terminus of the NBS-LRR protein of interest (ensuring no disruption of function via controls). Alternatively, express sensor freely in the compartment. Use Agrobacterium-mediated transformation of Nicotiana benthamiana or stable Arabidopsis transformation.
- Confocal/Rationetric Imaging: For FRET sensors (e.g., ATeam), collect donor (CFP) and acceptor (YFP) emission upon donor excitation. For single FP sensors (PercevalHR), collect fluorescence at two excitation wavelengths (e.g., 405 nm and 488 nm).
- Calibration & Challenge: Perform in situ calibration using digitonin permeabilization and buffers with defined ATP:ADP ratios. Monitor sensor response during pathogen effector delivery (e.g., transfiltration of Avr proteins) or elicitor treatment to correlate NBS-LRR activation with local nucleotide turnover.
Title: In Planta ATP Turnover Monitoring Logic Pathway
NanoLuc-Based ATP Consumption Assay (NALA) for Small Tissue Samples
Protocol: Quantifying ATP Depletion in Immune-Triggered Tissues
- Reconstitution: Express and purify the NBS-LRR protein's NBS domain fused to NanoLuc luciferase (a small, bright enzyme).
- In Vitro Calibration: Establish a linear relationship between ATP concentration and luminescent output (using commercial ATP) in the presence of the NanoLuc substrate, furimazine.
- Plant Sample Preparation: Harvest leaf discs (e.g., 2 mm diameter) from sensor-expressing plants at time points post-elicitation. Rapidly lyse in a compatible buffer (e.g., Passive Lysis Buffer).
- Measurement: Mix clarified lysate with furimazine. Measure initial luminescence (RLU), which is proportional to the endogenous [ATP]. Spike a known amount of ATP and measure again to calculate total consumable ATP.
- Data Analysis: Compare ATP levels in resting vs. activated tissues. Co-expression of the NBS-LRR-NanoLuc fusion allows direct correlation of ATP turnover with switch activity in minute tissue samples.
The Scientist's Toolkit: Key Research Reagent Solutions
Table 2: Essential Reagents for Single-Molecule and In Planta ATP Turnover Studies
| Reagent/Material | Supplier Examples | Function in NBS-LRR Research |
|---|---|---|
| Maleimide-activated Cy3/Cy5 dyes | Cytiva, Lumiprobe | Site-specific covalent labeling of engineered cysteine residues in NBS domains for smFRET. |
| PEG-Passivated Slides (PEG/biotin-PEG) | Microsurfaces Inc., Kerafast | Create a non-fouling surface for single-molecule immobilization, minimizing non-specific binding. |
| AviTag Peptide Sequence / BirA Enzyme | Avidity, Thermo Fisher | Site-specific biotinylation of recombinant NBS-LRR proteins for surface capture. |
| ATeam (ATeam1.03-nD/nA) | Addgene (#51958/51959) | Genetically encoded FRET-based ATP indicator for in planta ratio imaging. |
| PercevalHR | Addgene (#49083) | Single GFP-based biosensor for ATP:ADP ratio; useful for plant expression. |
| NanoLuc Luciferase (NLuc) | Promega | Ultra-bright, small luciferase for creating ATP consumption sensors (NALA) or protein fusion reporters. |
| Furimazine (Nano-Glo Substrate) | Promega | Cell-permeable substrate for NanoLuc, enabling in planta or lysate-based luminescent assays. |
| ATPγS (Adenosine 5′-[γ-thio]triphosphate) | Jena Bioscience, Sigma | Hydrolysis-resistant ATP analog used to "trap" NBS-LRR in an ATP-bound state for structural/functional studies. |
| GloSensor cAMP/ATP Assay | Promega | Commercial luminescent platform adaptable for in vitro high-throughput screening of NBS-LRR ATPase modulators. |
| Magnetic/Streptavidin Beads (1 μm) | Spherotech, Bangs Labs | Used in tweezer experiments for tethering NBS-LRR proteins via handle DNA. |
Conclusion
The ATP hydrolysis switch in NBS-LRR proteins represents a sophisticated and evolutionarily tuned mechanism for controlling plant immune responses. A foundational understanding of its conserved structural motifs is essential for probing its function, while robust methodological approaches enable detailed kinetic and mechanistic dissection. Troubleshooting these assays is critical for generating reliable data, which can then be validated through comparative analysis with related systems like animal NLRs. This integrated knowledge not only deepens our understanding of plant-pathogen interactions but also opens promising avenues for therapeutic intervention. By targeting this molecular switch, future research can develop novel strategies for enhancing crop disease resistance and potentially modulating related human innate immune pathways, bridging fundamental science with translational applications in agriculture and biomedicine.