Demystifying the ACMG/AMP Guidelines: A Comprehensive Guide to Applying Functional Evidence in Genetic Variant Interpretation
This article provides a detailed, actionable guide for researchers and drug development professionals on implementing functional evidence criteria (PS3/BS3) from the ACMG/AMP variant classification framework.
Demystifying the ACMG/AMP Guidelines: A Comprehensive Guide to Applying Functional Evidence in Genetic Variant Interpretation
Abstract
This article provides a detailed, actionable guide for researchers and drug development professionals on implementing functional evidence criteria (PS3/BS3) from the ACMG/AMP variant classification framework. We explore the foundational rationale behind these guidelines, present current methodologies for generating and applying functional data, address common challenges and optimization strategies, and examine comparative analyses with newer frameworks. The goal is to equip scientists with the knowledge to robustly validate variant pathogenicity, thereby accelerating translational research and therapeutic development.
The Bedrock of Variant Classification: Understanding the ACMG/AMP PS3/BS3 Framework
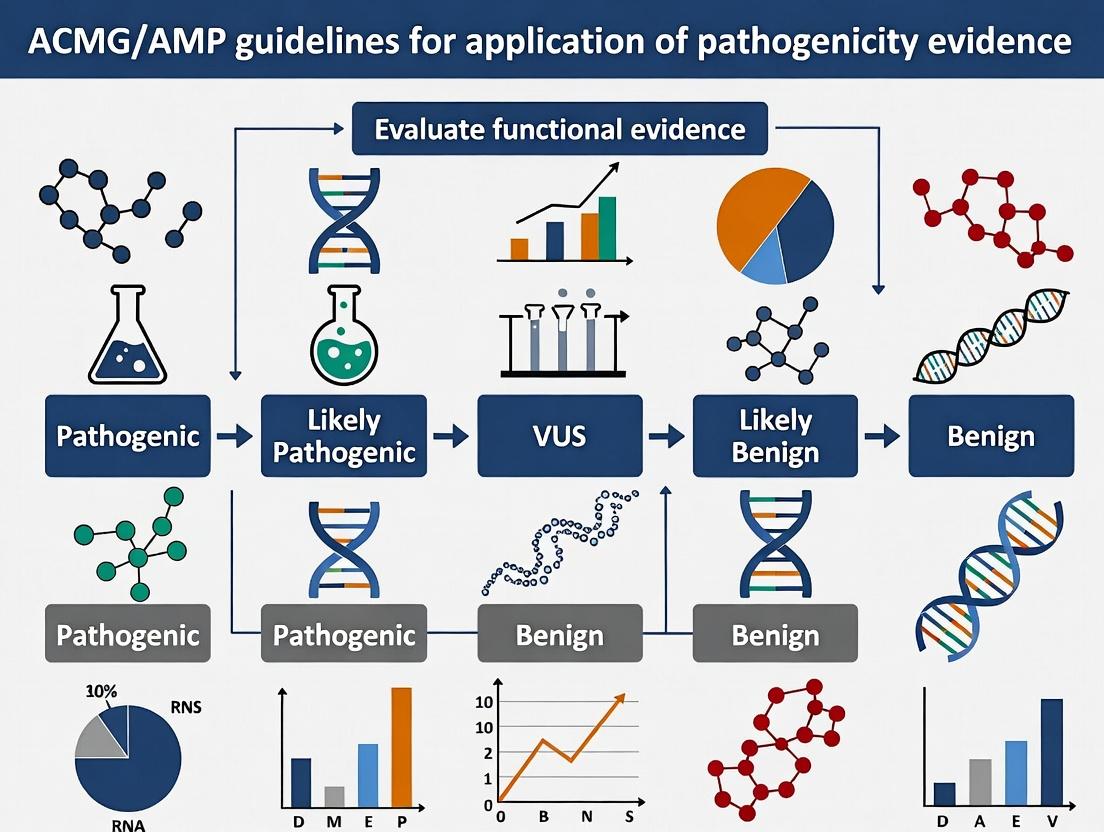
The 2015 guidelines from the American College of Medical Genetics and Genomics (ACMG) and the Association for Molecular Pathology (AMP) established a standardized, evidence-based framework for the interpretation of sequence variants in Mendelian disorders. This paradigm shifted clinical genetics from subjective assessment to a structured, semi-quantitative classification system. Within the broader thesis on functional evidence application, these guidelines provide the essential schema for translating experimental data into clinically actionable evidence tiers.
Foundational Principles
The core of the ACMG/AMP paradigm is a set of 28 criteria, categorized as pathogenic (P) or benign (B), and weighted as Very Strong (PVS1), Strong (PS1, PS2, PS3, PS4), Moderate (PM1-PM6), or Supporting (PP1-PP5; BS1-BS4). Variant classification results from combining these weighted criteria into one of five categories: Pathogenic, Likely Pathogenic, Uncertain Significance, Likely Benign, or Benign. The specification and application of functional data primarily fall under the PS3/BS3 criteria.
Table 1: Key ACMG/AMP 2015 Evidence Criteria for Functional Assessment
| Code | Weight | Criteria Description | Typical Functional Evidence Required |
|---|---|---|---|
| PS3 | Strong (Pathogenic) | Well-established in vitro or in vivo functional studies supportive of a damaging effect on the gene or gene product. | Quantitative assay showing loss-of-function (e.g., <10% residual activity) or dominant-negative/gain-of-function effect. |
| BS3 | Strong (Benign) | Well-established in vitro or in vivo functional studies show no damaging effect on protein function or splicing. | Assay demonstrates wild-type or near-wild-type function (e.g., >80% residual activity). |
| PM1 | Moderate (Pathogenic) | Located in a mutational hot spot and/or critical and well-established functional domain without benign variation. | Structural biology data defining critical domain; population data on variant clustering. |
| PP3 | Supporting (Pathogenic) | Multiple lines of computational evidence support a deleterious effect. | Concordant predictions from algorithms for splicing, missense impact, etc. |
Application Notes: Integrating Functional Evidence (PS3/BS3)
Defining "Well-Established" Functional Assays
For a functional assay to be used as PS3/BS3 evidence, it must be:
- Robust and Reproducible: Published and independently validated.
- Clinically Validated: Demonstrates high sensitivity and specificity for discriminating between known pathogenic and benign variants in the gene.
- Quantitative: Provides continuous, objective, and calibrated readouts.
- Biologically Relevant: Measures a function directly related to the disease mechanism (e.g., enzyme activity, protein-protein interaction, electrophysiology, splicing).
Protocol: Development and Validation of a PS3/BS3 Functional Assay
Objective: To establish a novel functional assay for a tumor suppressor gene suitable for PS3/BS3 classification.
Workflow Diagram:
Detailed Protocol:
Step 1: Assay Design & Development
- Principle: Select a readout that captures the core molecular function loss in the disease. For a kinase, this may be phosphorylation activity; for a transcriptional regulator, DNA-binding or transactivation.
- Materials: Wild-type cDNA clone, expression vector, relevant cell line (e.g., HEK293T, patient-derived cells).
- Method: Clone the wild-type gene into an appropriate mammalian expression vector with a detectable tag (e.g., GFP, FLAG). Develop a quantitative assay (e.g., luciferase reporter, flow cytometry, enzyme activity microplate assay).
Step 2: Control Variant Panel Construction
- Principle: Establish assay dynamic range and specificity using defined controls.
- Method: Use site-directed mutagenesis to generate:
- Negative Control (Benign): Wild-type construct.
- Positive Control (Pathogenic): A known loss-of-function variant (e.g., catalytic site mutant, truncation).
- Technical Control: Empty vector.
- Validation: Confirm all constructs by Sanger sequencing.
Step 3: Assay Robustness Assessment
- Principle: Determine intra- and inter-assay variability.
- Method: Perform the developed assay in triplicate over three independent experiments (N=9) for the three control constructs.
- Analysis: Calculate the Coefficient of Variation (CV). A CV <20% is typically acceptable. Establish a Z'-factor >0.5 to confirm a robust assay window.
Step 4: Validation with Characterized Variants
- Principle: Clinically validate the assay against "truth sets."
- Method: Assay a panel of 10-20 ClinVar-asserted pathogenic variants and 10-20 benign (e.g., population frequency >5% in gnomAD) or synonymous variants.
- Analysis: Perform Receiver Operating Characteristic (ROC) analysis. Determine the optimal activity cut-off that maximizes sensitivity and specificity.
Step 5: Statistical Cut-off Definition for ACMG
- Principle: Define quantitative thresholds for evidence strength.
- Method: Using validation data, establish:
- BS3 Threshold: Mean activity ≥ 80% of wild-type. (Supports Benign evidence).
- "Gray Zone": Activity between 20-80% of wild-type. (Insufficient for PS3/BS3 alone; requires other evidence).
- PS3 Threshold: Mean activity ≤ 10% of wild-type. (Supports Strong Pathogenic evidence).
- Note: These thresholds are gene- and assay-specific but are common benchmarks derived from published recommendations.
Step 6: Blinded Analysis of Variants of Uncertain Significance (VUS)
- Principle: Apply the validated assay to novel variants.
- Method: Perform assays for VUS in a blinded manner relative to controls. Include all controls in each experimental run.
- Analysis: Compare VUS activity to the pre-defined thresholds. Classify each VUS's functional result as supporting PS3, BS3, or inconclusive.
Step 7: ACMG Criterion Integration
- Principle: Combine functional data with other evidence types.
- Method: Create an evidence tally. For a VUS with:
- Activity ≤10%: Add PS3.
- Population frequency <0.1%: Add PM2.
- In silico predictions deleterious: Add PP3.
- Combination: PS3 + PM2 + PP3 = Likely Pathogenic.
Enduring Impact and Evolution: The ClinGen Era
The original 2015 framework has been refined by the Clinical Genome Resource (ClinGen) to address inconsistencies. Key developments include:
- Semi-Quantitative Implementation: The Sherloc framework introduces a points-based system.
- Gene-Disease Specificity: ClinGen Variant Curation Expert Panels (VCEPs) publish SVI (Sequence Variant Interpretation) recommendations, specifying how general criteria (especially PS3/BS3) should be applied to a particular gene (e.g., defining precise assay thresholds).
Table 2: Evolution of Functional Evidence Standards Post-2015
| Aspect | Original 2015 Guidelines | ClinGen/SVI Refinements |
|---|---|---|
| Specificity | General principles. | Gene/disease-specific calibration. |
| PS3/BS3 Thresholds | Not numerically defined. | Quantitative, pre-defined activity cut-offs (e.g., <10%, >80%). |
| Assay Validation | "Well-established" but loosely defined. | Requires ROC analysis with characterized variant sets. |
| Evidence Combination | Qualitative "pathogenic/benign" tally. | Semi-quantitative points systems (e.g., Sherloc). |
Diagram: The Modern ACMG/AMP/ClinGen Functional Evidence Pathway
The Scientist's Toolkit: Research Reagent Solutions
Table 3: Essential Materials for Functional Variant Assessment
| Item | Supplier Examples | Function in Protocol |
|---|---|---|
| Mammalian Expression Vectors (pcDNA3.1, pCMV) | Thermo Fisher, Addgene | Backbone for cloning wild-type and variant constructs for transient expression. |
| Site-Directed Mutagenesis Kits (Q5, QuikChange) | NEB, Agilent | Generation of specific point mutations in cDNA clones. |
| Control Variant cDNAs | ATCC, GenScript, internal clonal banks | Essential positive/negative controls for assay validation (known pathogenic/benign). |
| Luciferase Reporter Assay Systems | Promega (Dual-Glo) | Quantitative measurement of transcriptional activity for regulators. |
| Kinase/Enzyme Activity Assays (ADP-Glo, ELISA) | Promega, Cisbio | Direct measurement of enzymatic function for kinases, metabolic enzymes. |
| Splicing Minigene Vectors (pSPL3, pCAS2) | Gifted from labs, custom synthesis | Assessment of variant impact on mRNA splicing patterns. |
| High-Fidelity DNA Polymerase (Q5, Phusion) | NEB, Thermo Fisher | Accurate amplification of constructs for cloning and sequencing verification. |
| Sanger Sequencing Services | Genewiz, Eurofins | Final confirmation of all constructed plasmids prior to functional testing. |
| Statistical Analysis Software (GraphPad Prism, R) | GraphPad, R Foundation | For ROC analysis, cut-off determination, and statistical comparison of activity data. |
The ACMG/AMP guidelines for sequence variant interpretation incorporate various evidence types, with functional data (PS3/BS3 codes) providing direct, assay-derived evidence for pathogenicity or benignity. PS3 is a "Strong" pathogenic criterion for well-established in vitro or in vivo functional studies supportive of a damaging effect. Conversely, BS3 is a "Strong" benign criterion for studies showing no damaging effect. This Application Note details the experimental rigor, validation, and critical interpretation required to reliably apply these codes, framed within the thesis that functional assays must be calibrated against known pathogenic and benign variants to define definitive thresholds for clinical interpretation.
Table 1: Validation Metrics for Common Functional Assays Supporting PS3/BS3 Application
| Gene / Disease Context | Assay Type | Positive Control Variants (Pathogenic) | Negative Control Variants (Benign) | Dynamic Range (Fold-change vs. WT) | Proposed Threshold for PS3/BS3 | Key Reference (Year) |
|---|---|---|---|---|---|---|
| TP53 (Cancer) | Transcriptional Activation (Yeast) | R175H, R248W | Known Polymorphisms | 0.1 - 1.2 (Activity) | <20% Activity (PS3); >80% Activity (BS3) | Giacomelli et al., 2018 |
| BRCA1 (Hereditary Cancer) | Homology-Directed Repair (HDR) Assay | 185delAG, C61G | S1613G | 0.05 - 1.1 (Efficiency) | <30% HDR Efficiency (PS3); >70% (BS3) | Richardson et al., 2019 |
| KCNH2 (Long QT Syndrome) | Patch Clamp (IKr Current) | G628S, A561V | Common SNPs | 0.0 - 1.0 (% WT Current) | <30% Current (PS3); >90% (BS3) | Ng et al., 2020 |
| CFTR (Cystic Fibrosis) | Forskolin-Induced Organoid Swelling | F508del, G551D | Neutral Missense | 0.2 - 1.0 (Swelling Ratio) | <30% Swelling (PS3); >80% (BS3) | Berkers et al., 2019 |
| MYH7 (Hypertrophic Cardiomyopathy) | ATPase Activity (Reconstituted Fibers) | R403Q, R719W | Common Variants | 0.5 - 1.3 (Activity) | <70% Activity OR >130% (PS3); 85-115% (BS3) | Marston et al., 2021 |
Detailed Experimental Protocols
Protocol 3.1: Mammalian Cell-Based Homology-Directed Repair (HDR) Assay for BRCA1 Variants
Purpose: To quantitatively assess the functional impact of BRCA1 VUS on DNA double-strand break repair.
Materials: See "The Scientist's Toolkit" below.
Methodology:
- Cell Line Preparation: Maintain HEK293T or HeLa DR-GFP reporter cells. Seed cells in 24-well plates.
- Transfection: Co-transfect 500 ng of pCBASceI (expresses I-SceI endonuclease to induce a site-specific DSB) and 500 ng of a plasmid expressing the BRCA1 variant (or WT/WT control) using a transfection reagent. Include a "no SceI" control.
- Flow Cytometry Analysis: 72 hours post-transfection, harvest cells, wash with PBS, and resuspend in FACS buffer. Analyze by flow cytometry to determine the percentage of GFP-positive cells (indicating successful HDR).
- Data Normalization: For each variant, calculate HDR efficiency as: (% GFP+ for variant / % GFP+ for WT BRCA1) x 100%. Normalize all values to the average of the WT control replicates.
- Calibration: Run validated pathogenic (e.g., C61G) and benign (e.g., S1613G) controls in parallel to define the assay's abnormal range. Perform ≥3 biological replicates.
Protocol 3.2: Forskolin-Induced Swelling (FIS) Assay for CFTR Variants in Intestinal Organoids
Purpose: To measure CFTR channel function in a near-native tissue context.
Materials: Patient-derived rectal organoids, forskolin, CFTR potentiator (e.g., ivacaftor), inhibitor (e.g., CFTRinh-172), Matrigel, advanced DMEM/F-12 culture medium.
Methodology:
- Organoid Culture & Seeding: Culture homozygous or compound heterozygous organoids in Matrigel domes. For assay, mechanically break and seed organoid fragments in a thin Matrigel layer in a 96-well glass-bottom plate.
- Staining & Pre-treatment: Load organoids with 5μM Calcein Green AM for 30 min. Image baseline using a confocal live-cell microscope.
- Forskolin Stimulation: Add forskolin (final 0.128μM) and CFTR potentiator (e.g., 5μM ivacaftor if applicable). Acquire time-lapse images every 2 minutes for 60 minutes.
- Inhibition Control: In separate wells, pre-treat with CFTRinh-172 (10μM) for 30 min before adding forskolin.
- Quantification: Use image analysis software (e.g., FIJI) to measure organoid cross-sectional area over time. Calculate swelling ratio as (Max Area / Baseline Area).
- Interpretation: Compare variant swelling ratio to isogenic WT or known benign variant controls and validated pathogenic (e.g., F508del) controls.
Visualizations of Pathways and Workflows
The Scientist's Toolkit: Key Research Reagent Solutions
Table 2: Essential Materials for Featured Functional Assays
| Item | Function/Application | Example Product/Catalog |
|---|---|---|
| DR-GFP Reporter Cell Line | Stably integrated GFP reporter for quantifying Homology-Directed Repair efficiency. | HeLa DR-GFP (e.g., from Pierce et al., 2001). |
| pCBASceI Plasmid | Expresses I-SceI endonuclease to induce a specific double-strand break in the reporter cassette. | Addgene Plasmid #26477. |
| Lipofectamine 3000 | High-efficiency transfection reagent for plasmid delivery into mammalian cell lines. | Thermo Fisher Scientific, L3000001. |
| Matrigel, Growth Factor Reduced | Basement membrane matrix for 3D organoid culture and support. | Corning, 356231. |
| Forskolin | Activates adenylate cyclase, increasing cAMP to stimulate CFTR channel opening. | Sigma-Aldrich, F3917. |
| CFTRinh-172 | Specific, potent inhibitor of CFTR channel function; critical negative control. | Sigma-Aldrich, C2992. |
| Calcein Green, AM | Cell-permeant fluorescent dye for live-cell imaging and organoid swelling quantification. | Thermo Fisher Scientific, C3100MP. |
Application Notes
The systematic application of functional evidence in genomic variant interpretation is a cornerstone of modern clinical genomics. The evolution from anecdotal, bespoke assays to standardized, scalable validation frameworks, primarily driven by the ACMG/AMP guidelines, has directly enabled the transition from research to clinical utility. This standardization is critical for drug development, where functional validation of target engagement or mechanism-of-action variants directly impacts trial design and biomarker strategy.
Table 1: Evolution of Key Functional Evidence Standards in Genomics
| Era (Approx.) | Dominant Standard | Key Characteristics | Impact on Variant Classification |
|---|---|---|---|
| Pre-2010 | Laboratory-specific | Qualitative, non-standardized assays; low throughput; poor inter-lab reproducibility. | Primarily research-grade; limited clinical application. |
| 2010-2015 | Early ACMG/ClinGen | Introduction of PS3/BS3 codes; focus on clinical pathogenicity; rise of medium-throughput assays (luciferase, Sanger-based). | Enabled early framework for clinical variant interpretation. |
| 2015-2020 | Refined ACMG/AMP | Operationalization of PS3/BS3; standardization of controls (WT, known pathogenic/benign); emphasis on statistical rigor. | Increased consistency across labs; integration into diagnostic pipelines. |
| 2020-Present | Scalable & Quantitative | High-throughput assays (deep mutational scanning, massively parallel reporter assays); quantitative dose-response data; application of Bayesian statistics. | Support for variant classification at scale; direct integration into drug discovery for variant-specific therapies. |
Table 2: Quantitative Impact of Standardized Functional Evidence (Hypothetical Meta-Analysis)
| Metric | Pre-Standardization (Est.) | Post-ACMG/AMP Standardization (Est.) | Data Source (Example) |
|---|---|---|---|
| Inter-laboratory Concordance for PS3/BS3 | ~40-50% | ~85-90% | ClinGen Sequence Variant Interpretation WG |
| Variants with Functional Data in ClinVar | < 10,000 (2012) | > 200,000 (2023) | ClinVar Public Statistics |
| Throughput (variants/assay) | 1-10 | 1,000 - 10,000+ | Deep Mutational Scanning Studies |
| Typical p-value/Statistical Threshold | p < 0.05 (often descriptive) | p < 0.01 + multiple test correction + effect size | Recent MPRA & DMS publications |
Protocols
Protocol 1: Mammalian Cell-Based Functional Assay for Missense Variants (PS3/BS3 Application)
Objective: To quantitatively assess the functional impact of missense variants in a protein-of-interest (POI) using a cell-based signaling or enzymatic activity reporter assay.
Research Reagent Solutions:
| Item | Function |
|---|---|
| Mammalian Expression Vector (e.g., pcDNA3.1) | Backbone for cloning POI variant constructs. |
| Site-Directed Mutagenesis Kit | Introduction of specific nucleotide changes to create variant constructs. |
| Reporter Plasmid (e.g., Luciferase, GFP) | Downstream readout of POI activity (pathway-specific). |
| Control Plasmid (Renilla luciferase, constitutive promoter) | Transfection normalization control. |
| Cell Line (e.g., HEK293T, relevant primary cells) | Cellular context for assay. |
| Transfection Reagent (e.g., lipid-based) | For plasmid delivery into cells. |
| Dual-Luciferase Reporter Assay System | Quantifies firefly (experimental) and Renilla (control) luciferase activity. |
| Known Pathogenic & Benign Control Variant Constructs | Essential calibration standards for PS3/BS3 scoring. |
| Microplate Luminometer | Instrument for detecting luminescent signal. |
Methodology:
- Variant Construct Generation: Using validated cDNA of the POI, generate all variant constructs (test variants, known pathogenic positive control, known benign negative control, wild-type) via site-directed mutagenesis. Confirm by Sanger sequencing.
- Cell Seeding & Transfection: Seed appropriate cells in 96-well plates. Co-transfect each well with: a) POI variant or control construct (fixed amount), b) pathway-specific reporter plasmid, c) normalization control plasmid. Include triplicates per construct and a mock transfection control.
- Assay Execution: Incubate per experimental timeline (e.g., 48h). Lyse cells and measure firefly and Renilla luciferase activities sequentially using the dual-luciferase assay system on a luminometer.
- Data Analysis: Calculate normalized activity (Firefly/Renilla) for each well. Average triplicates. Express variant activity as a percentage of wild-type activity. Perform statistical analysis (e.g., unpaired t-test comparing variant to WT). Apply pre-established thresholds (e.g., <20% activity for Strong evidence (PS3), >80% activity for Supporting evidence (BS3), with p < 0.01).
Protocol 2: High-Throughput Saturation Genome Editing (SGE) for Variant Functionalization
Objective: To simultaneously assess the functional impact of thousands of single-nucleotide variants in a genomic context at scale.
Research Reagent Solutions:
| Item | Function |
|---|---|
| CRISPR/Cas9 Ribonucleoprotein (RNP) Complex | Enables precise, efficient genomic editing. |
| Repair Template Library | Oligo pool containing all possible single-nucleotide variants in the target region and a silent "barcode" for tracking. |
| FACS Cell Sorter | To isolate edited cell populations based on a phenotypic marker (e.g., surface protein, fluorescent reporter). |
| Next-Generation Sequencing (NGS) Platform | For quantifying barcode abundance pre- and post-selection. |
| Cell Line with Haploid or Selectable Locus | Simplifies analysis by ensuring single edited alleles (e.g., HAP1, RPE1). |
| PCR Reagents & Purification Kits | For amplifying barcode regions for NGS. |
Methodology:
- Library Design & Delivery: Design a repair oligo library tiling the target exon(s). Include each possible single-nucleotide change and a unique synonymous barcode. Electroporate or nucleofect cells with Cas9 RNP and the repair template library.
- Phenotypic Selection: Allow editing and recovery. Apply a stringent phenotypic selection relevant to gene function (e.g., drug treatment, fluorescence-activated cell sorting (FACS) for a surface marker). Collect genomic DNA from the pre-selection pool and the post-selection population.
- Sequencing & Enrichment Scoring: Amplify the barcoded region via PCR from both DNA pools and subject to NGS. For each variant, calculate its functional score as the log2(fold-change) of its barcode's frequency in the post-selection pool relative to the pre-selection pool.
- Calibration & Classification: Correlate scores of known benign/pathogenic control variants to set evidence thresholds. Variants with scores consistent with known pathogenic controls provide calibrated, high-throughput PS3-level evidence.
Visualizations
Evolution of Functional Evidence Standards
Functional Evidence Drives Variant Reclassification
Saturation Genome Editing Workflow
This document defines the core principles for classifying functional evidence as 'Strong' (PS3/BS3) or 'Supporting' (PS3/BS3_moderate) within the ACMG/AMP variant pathogenicity interpretation framework. The precise calibration of these evidence levels is critical for reproducible and accurate clinical variant interpretation in genetic testing and drug target validation.
Quantitative Calibration of Evidence Strength
Table 1: Calibration Thresholds for Functional Evidence (Adapted from Brnich et al., 2019; Pejaver et al., 2022)
| Evidence Level | ACMG/AMP Code | Typical Assay Result Threshold (vs. Wild-Type) | Key Statistical & Experimental Rigor Requirements |
|---|---|---|---|
| Strong | PS3 (for pathogenicity) BS3 (for benignity) | Severe impact: e.g., <10% residual activity for LoF; dominant-negative or strong GoF. | Results replicated in an orthogonal assay system. Robust statistics (p < 0.01, tight CI). Published independent control variants with known clinical significance. |
| Benign Stand-Alone: Function truly indistinguishable from wild-type. | |||
| Supporting | PS3Moderate / BS3Moderate | Moderate impact: e.g., 10-30% residual activity. | Results from a single well-established assay. Good statistical support (p < 0.05). Consistent internal controls. |
| Partial function: Clear difference from WT but not severe. | |||
| Note: These thresholds are gene and assay-specific. The above % activity ranges are illustrative for enzymatic assays; other metrics (e.g., SIFT, splicing) require their own established cutoffs. |
Table 2: Required Assay Characteristics for Evidence Tiering
| Characteristic | Strong Level Evidence | Supporting Level Evidence |
|---|---|---|
| Assay Validation | Assay validated with >20 known pathogenic & benign variants. | Assay validated with a limited set of known variants (5-10). |
| Orthogonality | Evidence from two complementary assay types (e.g., biochemical + cell-based). | Evidence from a single robust assay type. |
| Experimental Controls | Internal (WT, empty vector) and independent clinically-classified variants (PVP1, BVP1). | Adequate internal controls (WT, known mutant). May lack independent clinically-classified variants. |
| Statistical Power | High sample size (n≥3, technical & biological replicates). Precise effect size with narrow CI. | Adequate sample size (n=3), reasonable effect size estimation. |
| Publication Status | Published in peer-reviewed journal with detailed methods. | May include unpublished but well-documented internal data. |
Detailed Experimental Protocols for Key Functional Assays
Protocol 3.1: Mammalian Cell-Based Protein Localization & Trafficking Assay
Objective: Determine if a variant disrupts subcellular localization (e.g., for a channel protein). Materials: See "Scientist's Toolkit" (Section 6). Method:
- Construct Cloning: Clone the cDNA of the gene of interest, tagged with GFP (or other fluorophore) at the N- or C-terminus, into a mammalian expression vector. Introduce the variant via site-directed mutagenesis. Sequence-verify all constructs.
- Cell Culture & Transfection: Seed appropriate cells (e.g., HEK293, HeLa) in 8-well chambered coverglass. At 60-80% confluency, transfect with 200-500 ng of plasmid DNA per well using a lipid-based transfection reagent.
- Incubation & Staining: Incubate for 24-48h. Optionally, stain organelles with specific dyes (e.g., MitoTracker for mitochondria, ER-Tracker) or immunostain for an organelle marker.
- Fixation & Imaging: Fix cells with 4% PFA for 15 min. Permeabilize if immunostaining. Mount with DAPI-containing medium.
- Image Acquisition & Analysis: Acquire high-resolution confocal images. For each construct (WT, variant, positive control mutant), analyze ≥50 transfected cells. Score localization pattern (e.g., "correct plasma membrane" vs. "retained in ER"). Perform statistical comparison (e.g., Chi-square test) between WT and variant.
Protocol 3.2: In Vitro Enzymatic Activity Assay with Purified Protein
Objective: Quantitatively measure the impact of a variant on specific enzyme activity. Materials: See "Scientist's Toolkit" (Section 6). Method:
- Protein Expression & Purification: Express WT and variant proteins with an affinity tag (e.g., His6) in a suitable system (E. coli, baculovirus, mammalian). Purify using affinity chromatography (e.g., Ni-NTA). Confirm purity via SDS-PAGE and concentration via Bradford assay.
- Assay Setup: Prepare reaction buffer optimized for the enzyme. In a 96-well plate, mix purified protein (in a linear range of activity) with substrate. Include a no-enzyme control and a no-substrate control.
- Kinetic Measurement: Initiate reaction, often by adding a cofactor. Monitor product formation or substrate loss continuously (if chromogenic/fluorogenic) or at timed endpoints. Use a plate reader suitable for the detection mode (absorbance, fluorescence, luminescence).
- Data Analysis: Calculate reaction velocity (V). Determine Michaelis-Menten parameters (Km, Vmax) if performing kinetic characterization. For single-point comparison, express variant activity as % of WT specific activity. Perform assays in triplicate across ≥3 independent protein purifications.
- Statistical Calibration: Use a one-way ANOVA with post-hoc test to compare variant to WT. The effect size (% residual activity) and its confidence interval inform evidence level application (see Table 1).
Signaling Pathway & Workflow Visualizations
Diagram 1: Functional Evidence Application Workflow (98 chars)
Diagram 2: Generic Signaling Pathway & Disruption Points (99 chars)
The Scientist's Toolkit: Key Research Reagent Solutions
Table 3: Essential Materials for Functional Assays
| Item | Function & Rationale | Example Product/Catalog |
|---|---|---|
| Site-Directed Mutagenesis Kit | To introduce specific nucleotide variants into expression constructs. Essential for creating isogenic variant vs. WT controls. | Agilent QuikChange II, NEB Q5 SDM Kit. |
| Mammalian Expression Vector with Promoter | Drives high-level transient expression of gene of interest in relevant cell lines for localization, trafficking, or protein-protein interaction assays. | pcDNA3.1, pCMV vectors. |
| Fluorescent Protein Tag Plasmids | Enables visualization of protein localization and quantification of expression levels via microscopy or flow cytometry. | EGFP, mCherry, mScarlet tagging vectors. |
| Clinically-Classified Control Variants | Known pathogenic (PVP1) and benign (BVP1) variant constructs are critical for assay calibration and evidence tiering per ACMG/AMP. | Must be sourced from literature or clinical databases (ClinVar). |
| Tag-Specific Purification Resin | For purifying recombinant proteins for in vitro biochemical assays (e.g., enzymatic activity). Ensures assay uses defined protein. | Ni-NTA Agarose (His-tag), Anti-FLAG M2 Affinity Gel. |
| Cell Line with Relevant Background | A model system that expresses necessary interacting partners or reflects tissue-specific biology. | HEK293T (high transfection), patient-derived iPSCs, gene-knockout lines. |
| Validated Antibody for Detection | For Western blot (protein stability), immunostaining (localization), or ELISA (binding). Confirms expression and size. | Antibodies validated for knock-out/knock-down. |
| Chromogenic/Fluorogenic Assay Substrate | Enables quantitative, high-throughput measurement of enzymatic activity (kinase, phosphatase, protease, etc.). | Para-nitrophenyl phosphate (pNPP) for phosphatases. |
| High-Fidelity DNA Polymerase | For error-free amplification of constructs for cloning and sequencing verification. Critical to avoid introducing secondary variants. | NEB Q5, Thermo Fisher Phusion. |
| Confocal Microscope System | For high-resolution imaging of subcellular localization. Required for trafficking assays. | Systems from Zeiss, Nikon, or Leica. |
Application Notes: Integrating Functional Evidence (PS3/BS3) with Other Criteria
The application of the ACMG/AMP guidelines for variant classification requires a nuanced understanding of how different evidence types interact. Functional data, encoded primarily as strong (PS3) or supporting (BS3) evidence, does not operate in isolation. Its interpretive weight is significantly modulated by concordance or discordance with computational, population, and segregation data. The synergy between functional assays and other evidentiary strands is critical for accurate pathogenicity assessment, particularly for Variants of Uncertain Significance (VUS).
Key Synergistic Relationships
- PS3/BS3 and PM1 (Located in a Mutational Hotspot/Critical Domain): A variant in a well-established critical domain (PM1) that also demonstrates definitive loss-of-function in a validated assay (PS3) generates compounded evidence. The functional data explains the mechanistic consequence of the domain disruption.
- PS3/BS3 and PP3/BP4 (Computational Evidence): Concordance between strong in silico predictions of deleteriousness (PP3) and experimental functional impairment (PS3) strengthens both lines of evidence. Conversely, a functionally impaired variant (PS3) that is computationally benign (BP4) requires careful scrutiny of assay validity and predictive model limitations.
- PS3/BS3 and PS4/PM2 (Population Data): The observation of a functionally null variant (PS3) at a frequency far lower than expected for the disease (PM2) or in affected individuals (PS4) creates a powerful combined case for pathogenicity.
- The BS3 Paradox: A well-supported benign functional result (BS3) can be overruled by very strong evidence from other categories (e.g., multiple segregation studies, de novo occurrence). This highlights that functional evidence is weighted, not absolute.
Table 1: Variant Classification Outcomes Based on Evidence Combination Archetypes
| Evidence Combination Archetype | Typical ACMG/AMP Classification | Approximate Likelihood Ratio for Pathogenicity* | Common Clinical Actionability |
|---|---|---|---|
| PS3 + PM1 + PM2 + PP3 | Pathogenic (P) | > 99:1 | Confirmatory for diagnosis, inform family screening. |
| PS3 + PM2 + PP3 | Likely Pathogenic (LP) | ~ 95:1 | Presumed diagnostic, guides management. |
| Strong BS3 + Multiple PM2_Sup + BP4 | Likely Benign (LB) | ~ 1:95 | Candidate for reclassification to Benign, rule out cause. |
| PS3_Moderate + Conflicting PP3/BP4 + Uninformative PM2 | Variant of Uncertain Significance (VUS) | ~ 1:1 to 10:1 | Insufficient for decision-making; requires more data. |
| BS3_Supporting + Strong PS4 (Cohort Study) | Likely Pathogenic (LP) | ~ 20:1 | Functional evidence downgraded but pathogenicity supported by prevalence. |
Likelihood ratios are illustrative estimates based on ClinGen Sequence Variant Interpretation working group recommendations. *Demonstrates scenario where strong evidence from other categories can outweigh a benign functional assay result, necessitating assay re-evaluation.*
Detailed Experimental Protocols
Protocol 1: Saturation Genome Editing (SGE) for High-Throughput Functional Assessment
Purpose: To quantitatively assess the functional impact of all possible single-nucleotide variants in a genomic region of interest (e.g., an exon) in its native chromosomal context.
Methodology:
- Library Design: Synthesize an oligo pool tiling the target genomic region, incorporating every possible single-nucleotide change.
- Cell Line Engineering: Use a diploid human cell line (e.g., HAP1 or RPE1). Employ CRISPR-Cas9 to introduce a double-strand break in the target region and provide a donor template containing the variant library and a resistance marker (e.g., puromycin N-acetyltransferase).
- Library Delivery & Selection: Transfect the library via nucleofection. Select successfully edited cells with puromycin for 7-10 days.
- Phenotypic Readout & Sequencing:
- For growth-based genes (e.g., tumor suppressors), passage cells for 14-21 days. Harvest genomic DNA at multiple time points (T0, T7, T14, T21).
- For reporter assays, FACS-sort cells based on fluorescence.
- Amplify the integrated variant region from genomic DNA by PCR and subject to next-generation sequencing (NGS).
- Data Analysis: Calculate the enrichment/depletion of each variant over time relative to T0 using a statistical model (e.g., Di). A variant with significant depletion is classified as functionally disruptive.
Protocol 2: Multiplexed Assay of Variant Effect (MAVE) for Protein Domain Function
Purpose: To measure the functional consequences of thousands of missense variants on a specific protein function (e.g., DNA binding, enzymatic activity) in a single experiment.
Methodology:
- Variant Library Construction: Use error-prone PCR or oligonucleotide synthesis to generate a comprehensive library of single-amino-acid substitutions within a target protein domain.
- Cloning into Reporter System: Clone the variant library into an appropriate vector for the assay. Example: For a transcription factor, clone into a yeast display vector where the protein is fused to a cell surface anchor, and its activity drives the expression of a selectable reporter (e.g., HIS3) or fluorescent protein.
- Transformation & Selection: Transform the library into the host organism (e.g., yeast). Grow the population under selective conditions that require the protein's function for survival or fluorescence.
- Deep Mutational Scanning:
- Harvest cells before (input) and after (output) selection.
- Isolate plasmid DNA and amplify the variant region for NGS.
- Functional Score Calculation: For each variant, compute a functional score from the log2 ratio of its frequency in the output versus input libraries. Normalize scores to synonymous (neutral) and known pathogenic (disruptive) controls.
Visualizations
Title: Synergy Logic Between Functional Data and Other ACMG/AMP Evidence
Title: Saturation Genome Editing Functional Assay Workflow
The Scientist's Toolkit: Research Reagent Solutions
Table 2: Key Reagents and Materials for Advanced Functional Assays
| Item | Function in Experiment | Example Product/Catalog |
|---|---|---|
| Saturated Oligo Pool | Provides the comprehensive variant library for SGE or MAVE. Contains all desired nucleotide substitutions. | Twist Bioscience Custom Oligo Pools, Agilent SureSelectXT |
| Haploid Cell Line (HAP1) | Near-haploid human cell line ideal for SGE. Simplifies genetic analysis as only one allele is modified. | Horizon Discovery HAP1 (C631) |
| Cas9 Nuclease & sgRNA | Creates a targeted double-strand break to facilitate homology-directed repair (HDR) with the donor library. | IDT Alt-R S.p. Cas9 Nuclease, Synthego sgRNA |
| Puromycin Dihydrochloride | Selection antibiotic. Cells that successfully integrate the donor library (with PAC gene) survive. | Thermo Fisher Scientific A1113803 |
| Next-Gen Sequencing Kit | For preparing amplicon libraries from harvested genomic DNA to quantify variant abundance. | Illumina MiSeq Reagent Kit v3, Nextera XT Index Kit |
| Flow Cytometry Antibodies | For MAVE or SGE workflows using surface display; enables sorting based on protein expression/function. | BioLegend Anti-HA Tag (for HA-tagged proteins) |
| Deep Mutational Scanning Analysis Software | Computational pipeline to process NGS counts and calculate functional scores (e.g., Di, Enrichment). | dms_tools (Fowler Lab), Enrich2 (Starita Lab) |
| Validated Control Plasmids | Essential for assay calibration. Include known pathogenic (PS3) and benign (BS3) variant constructs. | ClinGen Variant Curation Expert Panel resources, Addgene deposits |
From Bench to Database: A Step-by-Step Guide to Generating & Applying Functional Evidence
Within the framework of ACMG/AMP guidelines for functional evidence application research, validated experimental assays provide the critical PS3 (well-established functional studies) and BS3 (well-established functional studies show no damaging effect) evidence for variant classification. This document details core methodologies for key assay categories, formatted as application notes and protocols.
Application Note: Dual-Luciferase Reporter Assay for Transcriptional Regulation
Context: Used to assess the impact of non-coding or coding variants (e.g., in promoters, enhancers) on transcriptional activity, providing evidence for PVS1 (null variant) or PM1 (hotspot) support.
Protocol: Dual-Luciferase Reporter Assay for a Putative Promoter Variant
- Vector Design: Clone the wild-type (WT) genomic fragment (approx. 1-2 kb upstream of TSS) into the multiple cloning site of a firefly luciferase reporter vector (e.g., pGL4.10). Using site-directed mutagenesis, generate the mutant (MUT) construct.
- Cell Seeding: Seed appropriate cells (e.g., HEK293T, relevant cell line) in a 24-well plate at 60-70% confluency.
- Transfection: For each well, co-transfect 400 ng of experimental firefly reporter plasmid (WT or MUT) and 40 ng of Renilla luciferase control plasmid (e.g., pGL4.74) using a transfection reagent. Include empty vector and promoter-less vector controls.
- Incubation: Incubate cells for 24-48 hours.
- Lysis & Measurement: Aspirate media, lyse cells with 1X Passive Lysis Buffer. Transfer lysate to a white-walled plate.
- Dual Assay: Inject Luciferase Assay Reagent II, measure firefly luminescence (signal). Subsequently, inject Stop & Glo Reagent, measure Renilla luminescence (normalization control).
- Analysis: Calculate the ratio of Firefly/Renilla luminescence for each well. Normalize the WT ratio to 100%. Compare the MUT activity as a percentage of WT.
Table 1: Representative Luciferase Data for Fictitious GENEX Promoter Variants
| Variant (c.) | Assay Type | Relative Luminescence (% of WT) | Standard Deviation | ACMG Evidence Contribution |
|---|---|---|---|---|
| WT Promoter | Dual-Luciferase | 100% | ±5% | Baseline |
| c.-124A>G | Dual-Luciferase | 152% | ±8% | Supports pathogenic (PS3) |
| c.-201delT | Dual-Luciferase | 3% | ±1% | Supports pathogenic (PS3, PVS1) |
| c.-56C>T | Dual-Luciferase | 95% | ±6% | Supports benign (BS3) |
Research Reagent Solutions:
- pGL4.10[luc2] Vector (Promega): Firefly luciferase reporter backbone; primary sensor for transcriptional activity.
- pGL4.74[hRluc/TK] Vector (Promega): Renilla luciferase control plasmid; normalizes for transfection efficiency.
- Dual-Luciferase Reporter Assay System (Promega): Provides optimized lysis and substrate buffers for sequential measurement.
- FuGENE HD Transfection Reagent (Promega): Low-toxicity reagent for efficient plasmid delivery.
Dual-Luciferase Reporter Assay Protocol Workflow
Application Note: Automated Planar Patch-Clamp Electrophysiology
Context: Provides direct functional evidence for ion channel variants (e.g., in SCN5A, KCNH2), crucial for applying PS3/BS3 and PP2 (missense in gene with low rate of benign variation) criteria.
Protocol: Voltage-Gated Sodium Channel (NaV1.5) Activation Protocol
- Cell Preparation: Culture heterologous cells (e.g., HEK293) stably expressing WT or variant human SCN5A. Harvest cells to create a single-cell suspension.
- Platform Setup: Prime the automated patch-clamp system (e.g., SyncroPatch 384) with appropriate internal and external solutions. Internal solution: CsF-based. External solution: NaCl-based.
- Sealing & Recording: Dispense cell suspension into the plate. The system performs cell positioning, whole-cell formation, and capacitance compensation automatically.
- Voltage Protocol:
- Holding potential: -120 mV.
- Step protocol: Apply depolarizing steps from -80 mV to +60 mV in 5 mV increments for 100 ms.
- Inter-step interval: 5 seconds at holding potential.
- Data Acquisition: Record peak sodium current (INa) during each depolarizing step.
- Analysis: Generate current-voltage (I-V) plots. Fit data with Boltzmann function to determine half-activation voltage (V1/2) and slope factor (k) for WT vs. variant.
Table 2: Fictitious Electrophysiology Data for SCN5A Variants
| Variant (p.) | Peak Current Density (pA/pF) | V1/2 of Activation (mV) | Shift vs. WT (mV) | ACMG Evidence Contribution |
|---|---|---|---|---|
| WT (p.N/A) | -45.2 | -42.5 | 0 | Baseline |
| p.Ile176Val | -12.1 | -35.6 | +6.9 | Supports pathogenic (PS3) |
| p.Arg535Cys | -46.5 | -43.1 | -0.6 | Supports benign (BS3) |
| p.Gly1621Arg | No detectable current | N/A | N/A | Supports pathogenic (PS3, PVS1) |
Research Reagent Solutions:
- SyncroPatch 384i (Nanion): Automated planar patch-clamp platform; enables high-throughput, gigaohm seal recordings.
- NPC-384 Chips (Nanion): Planar glass substrates with recording apertures; replace traditional pipettes.
- IonChannel Biosciences HEK293 NaV1.5 Cell Line: Stably expresses the human cardiac sodium channel; consistent expression for variant studies.
- CsF Internal Solution (Intracellular): Substitutes K+ with Cs+ to block potassium currents, isolating sodium currents.
Workflow for Assessing Ion Channel Variants
Application Note: CRISPR-Cas9 Mediated Knock-in for Functional Complementation
Context: A gold-standard assay to demonstrate the direct pathogenic effect of a variant in its native genomic and cellular context, providing strong PS3 evidence.
Protocol: CRISPR-Cas9 Homology-Directed Repair (HDR) for Variant Knock-in
- gRNA Design & Cloning: Design two sgRNAs flanking the target locus. Clone into Cas9/sgRNA expression vector. Validate cleavage efficiency via T7E1 assay.
- Donor Template Construction: Synthesize a single-stranded oligodeoxynucleotide (ssODN) donor template (≥ 100 nt homology arms) containing the variant of interest and a silent restriction site for screening.
- Cell Transfection: Electroporate or lipofect the Cas9/sgRNA vector and ssODN donor into relevant diploid cells (e.g., iPSCs, immortalized lines).
- Clonal Isolation: 48-72 hours post-transfection, begin single-cell sorting or limiting dilution into 96-well plates. Expand clones for 2-3 weeks.
- Genotype Screening: Isolate genomic DNA. Perform PCR across the target locus. Use introduced restriction site (RFLP) and Sanger sequencing to identify heterozygous/homozygous knock-in clones.
- Functional Phenotyping: Subject isogenic WT and variant knock-in clones to a relevant downstream assay (e.g., luciferase, electrophysiology, Western blot, viability assay).
Table 3: Example Outcomes for BRCA1 Variant Knock-in in Haploid Cells
| Clone Genotype | Protein Level (Western) | PARP Inhibitor IC50 (nM) | HDR Reporter Assay (% of WT) | ACMG Evidence |
|---|---|---|---|---|
| Parental WT | 100% | 120 | 100% | Baseline |
| c.68_69delAG (KI) | Undetectable | 15 | <5% | PS3, PVS1 |
| c.5266dupC (KI) | Undetectable | 18 | <5% | PS3, PVS1 |
| c.5946T>A p.Ser1982Arg (KI) | 90% | 115 | 95% | BS3 |
Research Reagent Solutions:
- LentiCRISPR v2 (Addgene): All-in-one vector for expression of Cas9 and sgRNA; enables stable selection.
- Alt-R CRISPR-Cas9 System (IDT): Includes high-fidelity Cas9 enzyme and chemically modified sgRNAs for reduced off-target effects.
- Alt-R HDR Donor Oligo (IDT): Chemically modified ssODN templates; enhance HDR efficiency and stability.
- CloneAmp HiFi PCR Premix (Takara): High-fidelity polymerase for accurate amplification of knock-in loci for genotyping.
CRISPR-Cas9 Knock-in and Complementation Workflow
Application Notes: Framework within ACMG/AMP Guidelines
The application of functional evidence (PS3/BS3 codes) under the ACMG/AMP variant interpretation guidelines requires assays that are both robust and clinically predictive. A clinically valid functional assay must recapitulate the biological consequence of a variant within a disease-relevant pathway or protein function. This necessitates a design framework centered on key parameters: biological context, analytical and clinical validity, and stringent controls. The assay must demonstrate a clear separation between wild-type (WT) and known pathogenic variant activity, with results that correlate with clinical phenotypes.
Table 1: Key Validation Parameters for a Clinically Valid Functional Assay
| Parameter | Definition | Target Threshold | Example Metric |
|---|---|---|---|
| Analytical Sensitivity | Ability to detect loss/gain-of-function. | >95% detection of known pathogenic variants. | Z' factor > 0.4 in high-throughput format. |
| Analytical Specificity | Ability to distinguish pathogenic from benign variants. | >95% correct classification of known benign variants. | Low false positive rate in control sets. |
| Precision (Repeatability) | Agreement under identical conditions. | Coefficient of variation (CV) < 15% for intra-assay replicates. | Standard deviation of normalized activity. |
| Reproducibility | Agreement across operators, instruments, time. | CV < 20% for inter-assay replicates. | Concordance between independent labs. |
| Dynamic Range | Span between minimum and maximum detectable signals. | Sufficient to capture full spectrum of variant effects. | Fold-change between null and hypermorphic controls. |
| Reference Range (WT) | Distribution of results for confirmed wild-type controls. | Establishes the "normal function" baseline. | Mean ± 3 SD of ≥10 independent WT replicates. |
Table 2: Essential Control Categories for Variant Assays
| Control Category | Purpose | Examples for a Tumor Suppressor Gene Assay |
|---|---|---|
| Negative (WT) Control | Defines normal functional baseline. | Endogenous gene editing to create isogenic WT cell line. |
| Positive Pathogenic Control | Validates assay can detect dysfunction. | Known loss-of-function variant (e.g., frameshift, canonical splice site). |
| Benign Control | Ensures assay does not misclassify benign variants. | Common synonymous polymorphism with population frequency >5%. |
| Assay Integrity Controls | Monitors technical performance. | Transfection efficiency marker, cytotoxicity readout, housekeeping gene. |
| Calibration Controls | Maps signal to biological effect. | Titrated siRNA knockdown (100%, 50%, 10% residual expression). |
Detailed Experimental Protocols
Protocol 1: CRISPR-Cas9 Engineered Isogenic Cell Line Generation for Endogenous Protein Assay Objective: Create genetically defined cell models to test variants in their native genomic context.
- Design: Design two sgRNAs flanking the exon of interest and a single-stranded oligodeoxynucleotide (ssODN) donor template containing the variant of interest and a silent restriction site for screening.
- Transfection: Co-transfect 500 ng of Cas9 expression plasmid, 250 ng of each sgRNA plasmid, and 100 pmol of ssODN into 2e5 HEK293T or relevant disease cell line using lipid-based transfection reagent.
- Clonal Isolation: 48 hours post-transfection, apply appropriate selection antibiotic. After 7 days, isolate single cells by FACS into 96-well plates.
- Genotyping: Expand clones for 2-3 weeks. Extract genomic DNA. Perform PCR amplification of the target locus and sequence validate. Confirm absence of random integration via PCR across the donor sequence junctions.
- Functional Analysis: Use clonal lines in downstream assays (e.g., protein expression by western blot, enzymatic activity, proliferation assays).
Protocol 2: Dual-Luciferase Reporter Assay for Transcriptional Activity (e.g., TP53) Objective: Quantify the impact of a variant on transcription factor function.
- Plasmid Construction: Clone the cDNA sequence of the WT and variant alleles into a mammalian expression vector. Prepare a reporter plasmid containing a firefly luciferase gene driven by a promoter with multiple copies of the transcription factor response element (e.g., p53 response element).
- Cell Seeding: Seed 1e4 cells per well in a 96-well white-walled plate 24 hours prior to transfection.
- Co-transfection: For each well, co-transfect 50 ng of expression vector (WT, variant, or empty vector control), 50 ng of firefly luciferase reporter plasmid, and 5 ng of Renilla luciferase control plasmid (pRL-SV40) using 0.3 µL of transfection reagent.
- Assay Execution: 48 hours post-transfection, lyse cells using 50 µL Passive Lysis Buffer. Measure firefly and Renilla luciferase signals sequentially using a dual-luciferase assay kit on a plate reader.
- Data Analysis: Normalize firefly luciferase activity to Renilla activity for each well. Express variant activity as a percentage of WT control (set to 100%). Include known pathogenic and benign variants in each run.
The Scientist's Toolkit: Research Reagent Solutions Table 3: Essential Materials for Functional Assay Development
| Item | Function | Example Product/Catalog |
|---|---|---|
| Isogenic WT Cell Line | Genetically stable negative control. | Horizon Discovery HAP1 parental line. |
| Precision gRNA Kit | For specific CRISPR/Cas9 editing. | Synthego Synthetic sgRNA, 2 nmole scale. |
| ssODN Donor Template | Homology-directed repair template for variant introduction. | IDT Ultramer DNA Oligo, 100 nmole. |
| Dual-Luciferase Reporter Kit | Sensitive, normalized transcriptional readout. | Promega Dual-Luciferase Reporter Assay System (E1910). |
| High-Fidelity DNA Polymerase | Accurate amplification of variant constructs. | NEB Q5 Hot Start High-Fidelity 2X Master Mix (M0494). |
| Validated Primary Antibody | For immunoblot detection of target protein. | Cell Signaling Technology Anti-p21 Waf1/Cip1 (12D1). |
| Flow Cytometry-Based Viability Dye | To control for cytotoxicity in proliferation assays. | Thermo Fisher Scientific LIVE/DEAD Fixable Violet Stain. |
Diagrams
Designing a Clinically Valid Functional Assay: Workflow
p53 Transcriptional Activity Reporter Assay Logic
Within the framework of the ACMG/AMP (American College of Medical Genetics and Genomics/Association for Molecular Pathology) guidelines for variant interpretation, the application of functional evidence (codes PS3/BS3) requires rigorous statistical quantification. This document provides application notes and protocols for establishing statistically robust, disease-relevant thresholds to calibrate functional assays, moving from qualitative observations to quantitative evidence classification.
Core Principles for Threshold Establishment
The calibration of any functional assay for clinical variant interpretation requires:
- Disease-Relevant Assay Design: The assay must reflect the biological mechanism of the disease.
- Statistical Rigor: Use of appropriate statistical models to define confidence intervals and thresholds.
- Reference Control Sets: Well-characterized pathogenic and benign variant sets for calibration.
- Precision-Recall Optimization: Balancing the rate of false positives and false negatives for the specific clinical context.
Table 1: Statistical Metrics for Defining Evidence Strength Thresholds
| Metric | Formula/Description | Target for Strong (PS3) | Target for Supporting (PP3) | Target for Benign (BS3) |
|---|---|---|---|---|
| Positive Predictive Value (PPV) | True Positives / (True Positives + False Positives) | ≥ 0.99 | ≥ 0.90 | Not Applicable |
| Negative Predictive Value (NPV) | True Negatives / (True Negatives + False Negatives) | Not Applicable | Not Applicable | ≥ 0.99 |
| Sensitivity (Recall) | True Positives / (True Positives + False Negatives) | ≥ 0.98 | ≥ 0.95 | Not Applicable |
| Specificity | True Negatives / (True Negatives + False Positives) | Not Applicable | Not Applicable | ≥ 0.98 |
| Likelihood Ratio (LR) Pathogenic | Sensitivity / (1 - Specificity) | > 18.0 (Strong) | > 4.5 (Moderate) | < 1 |
| Likelihood Ratio (LR) Benign | (1 - Sensitivity) / Specificity | < 1 | < 1 | < 0.05 (Strong) |
| Confidence Interval (95%) | Threshold ± 1.96*SE | Must not overlap supporting/benign range | Must not overlap strong/benign range | Must not overlap pathogenic ranges |
Table 2: Example Calibration Data for a Hypothetical Protein Abundance Assay
| Variant Class (n) | Mean Activity (% of WT) | Standard Deviation | Assay Score Range (Pathogenic) | Assay Score Range (Benign) | Calculated LR |
|---|---|---|---|---|---|
| Pathogenic Controls (50) | 25.4% | 8.7% | 0-40% | N/A | 22.5 |
| Benign Controls (50) | 98.2% | 5.1% | N/A | 75-120% | 0.04 |
| Variant of Uncertain Significance | 52.0% | - | Inconclusive Zone: 40-75% | 1.1 (Uninformative) |
Detailed Experimental Protocols
Protocol 1: Establishing a Quantitative Functional Assay & Calibration Curve
Aim: To generate a robust dose-response or activity curve for a wild-type protein and define the normal reference range. Materials: See Scientist's Toolkit. Procedure:
- Construct Generation: Clone the wild-type (WT) cDNA into an appropriate expression vector with a detectable tag (e.g., GFP, luciferase, HALO).
- Cell Line Seeding: Seed appropriate cells (e.g., HEK293T, patient-derived iPSCs) in 96-well plates for triplicate readings.
- Transfection & Titration: Transfect with a serial dilution of the WT construct (e.g., 10 ng to 1000 ng DNA per well) alongside a constitutive transfection control (e.g., Renilla luciferase).
- Assay Execution: At 48 hours post-transfection, perform the functional readout (e.g., luminescence, fluorescence, enzyme activity, imaging). Normalize raw data to the transfection control.
- Data Analysis: Plot normalized activity vs. DNA amount (or expressed protein level). Use non-linear regression to fit a sigmoidal dose-response curve (4PL). Define the "WT reference range" as the mean ± 3 standard deviations of activity at the saturating plasmid concentration.
Protocol 2: Calibration Using Variant Control Sets & Threshold Determination
Aim: To test known pathogenic and benign variants to establish evidence thresholds. Procedure:
- Control Variant Selection: Curate a set of 20-50 variants with definitive clinical classifications (P/LP and B/LB) from ClinVar.
- Blinded Testing: Construct and test all variants in triplicate as in Protocol 1, using a single, saturating DNA amount determined from the WT curve.
- Data Collation: Calculate the mean functional score (% of WT) for each variant.
- Statistical Modeling:
- Perform Receiver Operating Characteristic (ROC) curve analysis.
- Determine the optimal threshold that maximizes the Youden Index (Sensitivity + Specificity - 1).
- Apply likelihood ratio calculations. Define zones:
- Pathogenic Threshold: Score below which LR > 18.
- Benign Threshold: Score above which LR < 0.05.
- Inconclusive Zone: The region between thresholds.
- Validation: Test the thresholds on an independent validation set of variants.
Protocol 3: Bayesian Integration for ACMG Code Application
Aim: To integrate functional data with prior probability using the ACMG framework. Procedure:
- Establish Prior Odds: Based on population data and disease penetrance (e.g., from gnomAD, disease databases).
- Calculate Likelihood Ratio (LR): From assay calibration data (Protocol 2).
- Calculate Posterior Odds: Posterior Odds = Prior Odds × LR.
- Map to ACMG Evidence:
- PS3: LR ≥ 18. This typically provides ~18-fold increase in odds of pathogenicity.
- BS3: LR ≤ 0.05. This provides strong evidence for benignity.
- Supporting (PP3/BP4): 4.5 < LR < 18 (for pathogenic) or 0.05 < LR < 0.22 (for benign).
Visualization: Pathways and Workflows
Title: Functional Evidence Application Workflow
Title: Bayesian Integration of Functional Data
The Scientist's Toolkit: Research Reagent Solutions
Table 3: Essential Reagents for Functional Assay Development & Calibration
| Reagent / Solution | Function & Rationale |
|---|---|
| Site-Directed Mutagenesis Kit | For rapid generation of variant expression constructs from a wild-type template. Essential for creating control and test variants. |
| Bicistronic Dual-Luciferase Reporter Vector | Enables expression of the gene of interest fused to Firefly luciferase and a separate Renilla luciferase transfection control for precise normalization. |
| HaloTag or SNAP-tag Vectors | Provides a universal, covalent labeling system for protein quantification, localization, and stability assays via fluorescent ligands. |
| Validated Pathogenic/Benign Control DNA | Commercially available or consortium-derived genomic DNA or clones for key disease genes to serve as essential assay calibrators. |
| Near-WT Pooled Human Genomic DNA | Serves as a multi-allelic "benign" control baseline for assays measuring abundance or function against a population norm. |
| High-Efficiency, Low-Variability Transfection Reagent | Critical for achieving consistent protein expression levels across many samples in 96-well formats, reducing technical noise. |
| ROC Curve Analysis Software (e.g., MedCalc, R pROC) | Specialized statistical software to accurately calculate sensitivity, specificity, and optimal thresholds from control variant data. |
| Reference Cell Line (e.g., HEK293, HeLa) | Well-characterized, easily transfectable cell line providing a consistent background for initial assay development and calibration. |
| Patient-Derived iPSC Line (Wild-type) | Provides a disease-relevant genetic background for more physiologically accurate functional studies in differentiated cell types. |
1.0 Introduction and Context Within ACMG/AMP Guidelines Research
Within the framework of the ACMG/AMP variant interpretation guidelines, criterion PS3 supports pathogenic classification based on well-established functional studies demonstrating a deleterious effect. This case study provides a detailed protocol for generating and applying PS3-level evidence for a suspected loss-of-function (LoF) variant in a canonical tumor suppressor gene (TSG), such as TP53 or PTEN. The broader thesis context emphasizes the necessity of standardized, quantitative, and clinically calibrated functional assays to translate experimental data into reliable evidence for variant curation.
2.0 Application Notes: Key Considerations for PS3 Assignment
- Assay Relevance: The chosen functional assay must directly measure the established biological function of the gene (e.g., transcriptional activation for TP53, lipid phosphatase activity for PTEN).
- Benchmarking: Results from the variant must be compared to both wild-type (WT) and known pathogenic null controls (e.g., truncating variants) run in parallel.
- Statistical Rigor: Experiments require independent biological replicates (n≥3) with appropriate statistical testing (e.g., unpaired t-test, ANOVA).
- Magnitude of Effect: The observed functional defect should be comparable to known pathogenic LoF variants. A threshold of <20% of wild-type activity is commonly used for strong (PS3) evidence in well-calibrated assays.
- Calibration to Clinical Data: Optimal assay thresholds are derived from ROC curve analysis comparing functional results for known pathogenic versus benign variants.
3.0 Experimental Protocol: A Tiered Approach for PS3 Evidence Generation
This protocol outlines a sequential, multi-assay strategy for a TP53 missense variant as a model TSG.
3.1 Phase I: In Silico and Preliminary Cellular Analysis
Protocol 3.1.1: Plasmid Construction and Cell Culture
- Method: Site-directed mutagenesis is used to introduce the variant into a mammalian expression vector containing a C-terminal tag (e.g., FLAG). All constructs are verified by Sanger sequencing.
- Materials: WT TP53 cDNA clone, mutagenesis kit, competent E. coli, HEK293T (or Saos-2 p53-null) cells, standard DMEM culture media.
Protocol 3.1.2: Steady-State Protein Expression Analysis
- Method: Transient transfection of isogenic p53-null cells (Saos-2) with WT, variant, and vector-only control plasmids. Cells are harvested 48h post-transfection.
- Lysis & Immunoblotting: Use RIPA buffer for lysis. Perform SDS-PAGE, transfer to PVDF membrane, and probe with anti-p53 (DO-1) and anti-β-actin antibodies.
- Key Analysis: Quantify band intensity. Normalize p53 signal to loading control. Assess for reduced stability (common LoF mechanism).
3.2 Phase II: Functional Transactivation Assay (Core PS3 Assay)
Protocol 3.2.1: Luciferase Reporter Gene Assay
- Method: Co-transfect Saos-2 cells with: (1) TP53 expression plasmid (WT, variant, or pathogenic/benign controls), (2) a firefly luciferase reporter plasmid under control of a p53-responsive promoter (e.g., from CDKN1A/p21), and (3) a Renilla luciferase control plasmid for normalization.
- Procedure:
- Seed cells in 24-well plates.
- Co-transfect using a lipid-based transfection reagent per manufacturer's instructions.
- At 24h post-transfection, treat cells with 0.5 µM Nutlin-3 (MDM2 antagonist) or DMSO for 24h to activate and stabilize p53.
- Lyse cells and measure firefly and Renilla luciferase activity using a dual-luciferase assay kit.
- Data Analysis: Calculate the ratio of Firefly/Renilla luminescence for each replicate. Normalize the variant's mean activity to the WT control set at 100%.
Table 1: Representative Luciferase Assay Data for TP53 Variants
| Variant | Class (ClinVar) | Normalized Transcriptional Activity (%) ± SEM (n=4) | p-value (vs. WT) | Supports PS3? |
|---|---|---|---|---|
| Wild-Type | -- | 100.0 ± 5.2 | -- | -- |
| p.R175H | Pathogenic | 15.3 ± 2.1 | <0.0001 | Yes |
| p.R273H | Pathogenic | 22.4 ± 3.8 | <0.0001 | Yes |
| Case Variant (VUS) | Uncertain | 18.7 ± 4.5 | <0.0001 | Yes |
| p.P47S | Benign | 92.1 ± 6.7 | 0.31 | No |
3.3 Phase III: Orthogonal Functional Assay (Supporting Evidence)
Protocol 3.3.1: Growth Suppression Assay
- Method: Stable expression of WT or variant TP53 in p53-null cells (e.g., using lentiviral transduction and puromycin selection). Seed equal numbers of cells in 6-well plates.
- Procedure: Perform clonogenic or colony formation assay. Stain colonies with crystal violet after 10-14 days. Count colonies or elute dye for spectrophotometric quantification.
- Analysis: Normalize colony formation of variant-expressing cells to WT control. Pathogenic LoF variants fail to suppress growth, yielding colony counts similar to empty vector.
Table 2: Orthogonal Colony Formation Assay Results
| Cell Line | Normalized Colony Count (%) ± SD (n=3) | p-value (vs. WT) |
|---|---|---|
| Vector Only (p53-null) | 100.0 ± 8.5 | -- |
| Wild-Type TP53 | 32.1 ± 6.2 | -- |
| Case Variant (VUS) | 89.5 ± 7.9 | <0.001 |
4.0 The Scientist's Toolkit: Research Reagent Solutions
| Item | Function/Application in TSG LoF Analysis |
|---|---|
| p53-Null Cell Line (e.g., Saos-2) | Provides a clean genetic background without confounding endogenous p53 activity. Essential for functional complementation assays. |
| Dual-Luciferase Reporter Assay System | Quantifies transcriptional activity with high sensitivity and dynamic range. Internal Renilla control normalizes for transfection efficiency. |
| Validated Pathogenic & Benign Control Plasmids | Critical assay calibrators. Establish the dynamic range and threshold for pathogenicity (e.g., <20% activity). |
| MDM2 Inhibitor (Nutlin-3a) | Stabilizes wild-type p53 protein by disrupting its interaction with MDM2, enhancing assay signal and reliability. |
| Anti-p53 Antibody (DO-1 clone) | Widely validated for immunoblotting of human p53; recognizes an N-terminal epitope unaffected by most missense mutations. |
| Site-Directed Mutagenesis Kit | Enables rapid and accurate introduction of the specific nucleotide variant into the wild-type expression construct. |
5.0 Decision Pathway and Data Integration
PS3 Application Decision Pathway for a TSG Variant
6.0 Conclusion and Reporting for Curation
For PS3 application, compile data from all phases into a variant assessment report. The case variant, showing <20% transcriptional activity (Table 1) and loss of growth suppression (Table 2) akin to known pathogenic controls, meets the calibrated threshold for PS3. This evidence, generated following this standardized protocol, can be integrated with clinical and computational data for final variant classification within the ACMG/AMP framework.
This application note provides a detailed protocol for applying the American College of Medical Genetics and Genomics and the Association for Molecular Pathology (ACMG/AMP) benign strong (BS3) criterion. The BS3 criterion is used when "well-established" functional studies show no damaging effect on protein function or splicing. This walkthrough is framed within a broader research thesis on standardizing the application of functional evidence within the ACMG/AMP variant classification framework, aiming to reduce subjectivity and improve consistency for researchers and clinical laboratories.
ACMG/AMP BS3 Criterion Application Framework
The decision to apply BS3 requires critical evaluation of the functional assay's validity and the congruence of results. The following workflow outlines the logical assessment steps.
Decision Pathway for BS3 Application
Case Study:BRCA1c.2612C>T p.Pro871Leu
This missense variant in the BRCA1 C-terminal (BRCT) domain was identified in trans with a pathogenic BRCA1 variant in an individual without personal cancer history. In silico predictors were conflicting.
Table 1: Functional Assay Results for BRCA1 p.Pro871Leu
| Assay Type | Measurement (Mean ± SD) | WT Control (Mean ± SD) | Statistical Result (p-value) | Clinical Validation Status |
|---|---|---|---|---|
| Transcription Activation | 102% ± 8% | 100% ± 7% | p = 0.79 (NS) | Well-established for BRCA1 BRCT |
| Homologous Recombination Repair (HRR) | 95% ± 10% | 100% ± 9% | p = 0.62 (NS) | Well-established for BRCA1 |
| Protein Stability (Half-life) | 5.1 ± 0.4 hrs | 5.3 ± 0.3 hrs | p = 0.28 (NS) | Complementary evidence |
| Co-immunoprecipitation (Binding) | 98% ± 12% | 100% ± 10% | p = 0.85 (NS) | Complementary evidence |
NS = Not Significant. All assays performed in triplicate across ≥3 independent experiments.
Detailed Experimental Protocols
Protocol 1: BRCA1 Transcription Activation Assay
This assay measures the ability of the BRCA1 BRCT domain to activate transcription of a reporter gene, a key function for tumor suppression.
Methodology:
- Cloning: Site-directed mutagenesis to introduce c.2612C>T into a mammalian expression vector encoding the GAL4 DNA-binding domain fused to the BRCA1 BRCT domain (amino acids 775-1292).
- Cell Culture & Transfection: Co-transfect HEK293T cells in a 24-well plate with:
- 100 ng of pM-BRCT (WT or variant) plasmid.
- 100 ng of pG5-luciferase reporter plasmid (containing five GAL4 binding sites).
- 5 ng of pRL-SV40 Renilla luciferase plasmid for normalization.
- Reporter Measurement: Harvest cells 48 hours post-transfection. Perform dual-luciferase assay (Promega). Measure firefly luciferase signal (experimental reporter) and Renilla luciferase signal (transfection control).
- Data Analysis: Calculate normalized activity as (Firefly/Renilla)variant / (Firefly/Renilla)WT x 100%. Perform unpaired two-tailed t-test on data from ≥3 independent experiments.
Protocol 2: Homologous Recombination Repair (HRR) Proficiency Assay
This direct functional complementation assay is considered a gold standard for BRCA1.
Methodology:
- Cell Line: Use BRCA1-deficient DLD-1 or CAPAN-1 cells with stable integration of an HRR reporter (e.g., DR-GFP or Rad51 foci formation assay).
- Reconstitution: Transfect cells with a vector expressing full-length, untagged BRCA1 (WT or variant) or empty vector control.
- Damage Induction: 24h post-transfection, induce a site-specific double-strand break using the I-SceI endonuclease.
- Quantification:
- For DR-GFP: Analyze by flow cytometry 48-72h after I-SceI transfection. HRR efficiency is calculated as the percentage of GFP-positive cells.
- For Rad51 Foci: Immunostain for Rad51 6-12h after damage induction. Score foci-positive nuclei via microscopy.
- Data Analysis: Normalize HRR efficiency of the variant to WT (set at 100%). Statistical comparison via one-way ANOVA with post-hoc test.
The Scientist's Toolkit: Research Reagent Solutions
Table 2: Essential Reagents for Functional Studies of Missense Variants
| Item | Function & Application | Example/Supplier |
|---|---|---|
| Site-Directed Mutagenesis Kit | Introduces specific nucleotide changes into plasmid DNA for variant construction. | Agilent QuikChange II, NEB Q5 Site-Directed Mutagenesis Kit |
| Dual-Luciferase Reporter Assay System | Quantifies transcriptional activity by measuring firefly and control Renilla luciferase luminescence. | Promega Dual-Luciferase Reporter (DLR) Assay System |
| Validated Antibodies | For protein detection (Western blot), localization (immunofluorescence), and interaction studies (co-IP). | Cell Signaling Technology, Abcam, Santa Cruz Biotechnology |
| HRR Reporter Cell Line | Stably integrated system to measure homologous recombination repair proficiency. | DR-GFP U2OS (from M. Jasin lab), NHEJ/HR reporter kits (e.g., GeneCopoeia) |
| Flow Cytometer | Analyzes and quantifies fluorescence in cells (e.g., GFP-positive cells in HRR assays). | BD Biosciences FACSCelesta, Beckman Coulter CytoFLEX |
| High-Content Imaging System | Automated microscopy for quantitative analysis of cellular phenotypes (e.g., Rad51 foci). | PerkinElmer Operetta, Molecular Devices ImageXpress |
| Statistical Analysis Software | Performs significance testing and data visualization for robust result interpretation. | GraphPad Prism, R Statistics |
For BRCA1 p.Pro871Leu, the data from two clinically validated functional assays (Transcription Activation and HRR) showing normal results, supported by complementary biochemical data, meet the threshold for "well-established" functional studies showing no damaging effect. Within the ACMG/AMP framework, this justifies the application of the BS3 (Benign Strong) criterion. The final classification integrates this with other evidence (e.g., population data, co-occurrence data) towards a final benign assessment. This case exemplifies a rigorous, evidence-based application of functional data that can be modeled for other genes and variants.
Application Notes
Within the research framework for applying ACMG/AMP functional evidence criteria (PS3/BS3), structured data submission to public repositories is the critical final step that translates bench findings into clinically actionable knowledge. ClinVar and the Variant Interpretation for Cancer Consortium (VICC) are the authoritative databases for aggregating evidence on variant pathogenicity, directly supporting precision medicine. Adherence to best practices in documentation and curation ensures evidence is reproducible, interoperable, and maximally useful for downstream re-analysis and meta-assessment.
Effective submissions must contextualize experimental data within the specific ACMG/AMP rule being addressed. For functional evidence, this requires explicitly linking the quantitative results from validated assays to the assertion of pathogenicity or benignity. Incomplete or poorly documented submissions can lead to evidence being classified as "criteria provided, conflicting interpretations," diminishing its clinical utility.
Current search analysis of database submission guidelines and recent publications underscores the necessity of comprehensive metadata. Key quantitative metrics, such as effect size (e.g., percentage of residual activity), statistical confidence (p-values), and assay precision, must be clearly reported. The following table summarizes the core data elements mandated for a clinically impactful functional evidence submission.
Table 1: Essential Quantitative Data for Functional Evidence Submission
| Data Category | Specific Metrics | ClinVar Field / VICC Recommendation | ACMG/AMP Context |
|---|---|---|---|
| Assay Type | Functional domain tested (e.g., kinase activity, transcriptional activation). | Method; Assay description | Required for determining assay appropriateness (BS3/PS3). |
| Result Values | Mean activity/function relative to wild-type control (%). Standard deviation or SEM. | Observations; Reported phenotype | Direct input for strength determination (e.g., <10% activity supports PS3). |
| Statistical Analysis | p-value vs. wild-type; p-value vs. known pathogenic/benign controls; n (biological replicates). | Citations; Comments | Required for supporting (BS3) or strong (PS3) evidence. |
| Control Variants | Internal dataset for known pathogenic and benign variants in the same assay. | Submitter's assertion of pathogenicity is based on internal data. | Calibrates assay sensitivity/specificity; critical for BS3. |
| Experimental Replicates | Number of independent experiments and total replicates. | Method details | Key for reproducibility assessment. |
Protocols
Protocol 1: Submitting Functional Evidence to ClinVar
This protocol details the process for submitting experimentally derived functional evidence to support a variant interpretation in ClinVar, aligning with ACMG/AMP PS3/BS3 criteria.
Pre-Submission Preparation:
- Gather all experimental data, including raw values, normalized results, statistical analyses, and detailed assay methodology.
- Define the variant(s) using standard HGVS nomenclature (e.g., NM_000059.3(BRCA2):c.5946delT).
- Formulate a concise interpretation (e.g., "Pathogenic," "Likely benign") based on the aggregated evidence, including the functional data.
- Prepare a summary of the functional assay and how it calibrates to known controls, suitable for the "Comments" field.
Submission via ClinVar Submission Portal:
- Access the ClinVar submission portal (https://submit.ncbi.nlm.nih.gov/clinvar/).
- Select "Submit to ClinVar" and choose the appropriate submission type (e.g., "Variation only," "Variation and interpretation").
- Enter variant information, ensuring genomic, transcript, and protein coordinates are consistent.
- Under "Interpretation," select the clinical significance and provide the explanation in the "Assertion criteria" field, specifying "ACMG/AMP guidelines" and noting the applicable functional evidence code (PS3 or BS3).
- In the "Evidence" section, upload or cite the publication detailing the functional studies. In the "Method" field, describe the assay (e.g., "In vitro kinase assay using purified recombinant protein").
- Link to any supporting internal database or repository where primary data may be stored.
Curation and Review:
- ClinVar staff will perform a basic review for completeness and clarity.
- The submission will be made public and receive an SCV (Submitter ClinVar) accession number.
- The evidence will be aggregated with other submissions for the same variant, contributing to the overall review status (e.g., "criteria provided, single submitter").
Protocol 2: Contributing Functional Evidence to VICC
The VICC leverages a decentralized model, often integrating evidence via member knowledgebases (e.g., CIViC, OncoKB). This protocol outlines submission to the CIViC platform as a representative example.
Evidence Curation in CIViC:
- Create an account on the CIViC platform (https://civicdb.org/).
- Use the "Add Evidence" function for a specific gene/variant.
- Select evidence type "Predictive" or "Functional."
Structured Data Entry:
- Complete required fields: Evidence direction (Supports/Does not support), Significance (e.g., "Gain-of-function"), and Disease.
- In the "Evidence Statement" field, provide a clear, standalone summary of the functional findings and their implication.
- In the "Details" section, provide the complete experimental protocol, including cell line, readout, controls, and quantitative results.
- Add the originating publication as a source.
VICC Harmonization:
- Once accepted by CIViC curators, the evidence becomes part of the CIViC knowledgebase.
- VICC's meta-knowledgebase regularly ingests and harmonizes evidence from CIViC and other sources, creating a unified resource for cancer variant interpretation.
Diagrams
Title: Functional Evidence Submission Workflow
Title: Linking Experimental Data to ACMG/AMP Rules
The Scientist's Toolkit: Research Reagent Solutions for Functional Assays
Table 2: Essential Materials for Generating Submissible Functional Evidence
| Item | Function | Example Application |
|---|---|---|
| Validated WT and Mutant Expression Constructs | Ensures observed effects are due to the variant, not cloning artifacts. Critical for PS3/BS3. | Site-directed mutagenesis kits, Gateway cloning systems. |
| Calibrated Control Plasmids | Known pathogenic and benign variant controls to establish assay sensitivity/specificity. | Repository-sourced controls (e.g., BRCA1 p.Cys64Gly as benign). |
| Standardized Reporter Cell Lines | Provides consistent, low-background cellular context for functional readouts (e.g., luciferase). | HEK293T, Yeast-based functional assay strains. |
| Quantitative Activity Assay Kits | Provides validated reagents for measuring specific enzymatic or interaction functions. | Kinase-Glo, β-galactosidase, Fluorescent GTPase kits. |
| High-Fidelity Antibodies for Protein Detection | Essential for Western blot quantification of protein expression and stability. | Phospho-specific antibodies, conformation-specific antibodies. |
| Reference Genomic DNA | Used as a wild-type control in endogenous editing assays (e.g., CRISPR). | NA12878 or other high-coverage, characterized cell line DNA. |
| Data Analysis Software | Enables rigorous statistical comparison between variant and control groups. | GraphPad Prism, R/Bioconductor packages. |
Navigating Ambiguity: Solving Common Challenges in Functional Evidence Implementation
Application Notes: Integrating Functional Data for Variant Interpretation
In the framework of the ACMG/AMP guidelines, functional evidence codes (PS3/BS3) provide critical support for variant classification. However, experimental data often yields results of intermediate strength or conflicting outcomes, creating a "Variant of Uncertain Significance (VUS) conundrum." This document provides structured protocols for generating, analyzing, and integrating such ambiguous functional data within a research and drug development context.
Quantitative Data Synthesis
The interpretation of intermediate functional data requires calibration against known controls. The following table summarizes expected outcomes from benchmark assays for variant effect prediction.
Table 1: Calibration Metrics for Functional Assays in Variant Interpretation
| Assay Type | Known Pathogenic Mean Result (SD) | Known Benign Mean Result (SD) | Intermediate "Gray Zone" Range | Typical Throughput |
|---|---|---|---|---|
| In Vitro Splicing Assay (RT-PCR) | >80% aberrant transcripts (5%) | <10% aberrant transcripts (3%) | 20% - 70% aberrant transcripts | Medium (10-50 variants/week) |
| Lymphoblastoid Cell Growth Assay | <30% viability vs WT (8%) | >85% viability vs WT (6%) | 40% - 75% viability | High (100+ variants/week) |
| Protein Thermal Shift (ΔTm) | ΔTm ≤ -4.5°C (0.5°C) | ΔTm ≥ -1.0°C (0.3°C) | -4.0°C to -1.5°C | High |
| Reporter Gene Assay (Luciferase) | <25% activity vs WT (7%) | >90% activity vs WT (5%) | 30% - 80% activity | Medium |
| High-Throughput Sequencing Fitness Score | Score ≤ -2.0 (0.3) | Score ≥ 0.5 (0.2) | -1.9 to 0.4 | Very High |
Tiered Experimental Protocol for Resolving Intermediate Data
Protocol 1: Orthogonal Functional Validation Workflow
Aim: To resolve ambiguity from a primary assay by employing two secondary, mechanistically distinct methods.
Materials & Reagents:
- Plasmids: Wild-type and variant open reading frames in mammalian expression vectors (e.g., pcDNA3.1).
- Cell Lines: Relevant disease-model cell lines (e.g., HEK293T, patient-derived iPSCs).
- Assay Kits: Commercial luciferase, SEAP, or β-galactosidase reporter kits for normalization.
- Antibodies: For western blot (anti-target protein, anti-GAPDH loading control).
Methodology:
- Primary Assay (e.g., Transcriptional Activity):
- Transfect cells in triplicate with WT, variant, and empty vector controls.
- Harvest 48h post-transfection, lyse, and measure reporter activity.
- Normalize to transfection efficiency (co-transfected Renilla luciferase).
- Analysis: Calculate percentage activity relative to WT. Results in the 40-70% range trigger Tier 2 analysis.
Secondary Assay 1: Protein Stability & Localization
- Transfert cells as above for immunofluorescence and western blot.
- Fix cells 24h post-transfection, stain with primary & fluorescent secondary antibodies, image via confocal microscopy.
- In parallel, prepare lysates for western blot to quantify total protein levels.
- Analysis: Quantify nuclear/cytoplasmic ratio and protein half-life via cycloheximide chase.
Secondary Assay 2: Protein-Protein Interaction (PPI)
- Perform co-immunoprecipitation (co-IP) or proximity ligation assay (PLA).
- For co-IP: Lyse cells, incubate lysate with anti-tag antibody-bound beads, wash, elute, and detect interacting partners by western blot.
- Analysis: Calculate band intensity ratio (variant/WT) for key interacting partners.
Data Integration:
- Use a pre-defined scoring matrix (see Table 2) to combine results from all three assays.
- A composite score falling in the "Supporting" range can be used to upgrade or downgrade ACMG evidence strength.
Table 2: Composite Scoring Matrix for Orthogonal Assays
| Assay Result (vs WT) | Primary Assay Score | Secondary 1 Score | Secondary 2 Score | Composite Interpretation |
|---|---|---|---|---|
| Severely Disrupted (<25%) | +2 (Path) | +2 | +2 | Strong (PS3) |
| Moderately Disrupted (40-60%) | 0 (Ambiguous) | +1 | 0 | Supporting (PP3/BP4) |
| Mild Effect (60-85%) | 0 (Ambiguous) | 0 | -1 | Supporting (BP4) |
| No Effect (>85%) | -2 (Benign) | -2 | -2 | Strong (BS3) |
Protocol 2: High-Throughput Saturation Genome Editing (SGE) Follow-up
Aim: To contextualize an intermediate variant result within a comprehensive map of gene function.
Workflow:
- Design sgRNAs and donor templates for the genomic locus of interest.
- Perform SGE in a pooled format in a functionally relevant haploid or diploid cell line.
- Harvest cells at multiple time points (e.g., 3, 7, 14 days) to assess variant effects on cellular fitness via deep sequencing.
- Calculate a normalized variant effect score from the change in allele frequency over time.
- Compare the score of the VUS to the distribution of scores for all variants in the gene (known pathogenic/benign).
- Interpretation: A VUS score within the 10th-25th percentile of known benign scores is considered intermediate; such data should be weighted as "Supporting" rather than "Standalone" evidence.
Visualizations
Diagram Title: Decision Workflow for Intermediate Functional Data
Diagram Title: Biological Pathways Interrogated by Orthogonal Assays
The Scientist's Toolkit: Key Research Reagent Solutions
Table 3: Essential Reagents for Functional Assays of Genetic Variants
| Reagent / Solution | Primary Function | Example Product/Catalog | Key Considerations |
|---|---|---|---|
| Site-Directed Mutagenesis Kit | Introduces specific nucleotide changes into plasmid DNA. | Q5 Site-Directed Mutagenesis Kit (NEB) | High fidelity and efficiency are critical for low-error throughput. |
| Dual-Luciferase Reporter Assay System | Quantifies transcriptional activity by measuring firefly and Renilla luciferase. | Dual-Glo Luciferase Assay (Promega) | Allows normalization for transfection efficiency and cell viability. |
| Co-Immunoprecipitation Kit | Isolates protein complexes to assess protein-protein interactions. | Pierce Co-IP Kit (Thermo Scientific) | Low non-specific binding is essential for clean results. |
| Protein Thermal Shift Dye | Monotes protein unfolding to measure thermal stability (ΔTm). | Protein Thermal Shift Dye (Applied Biosystems) | Compatible with standard real-time PCR instruments for high-throughput. |
| Splicing Reporter Minigene Vectors | Assesses impact of exonic/intronic variants on mRNA splicing. | pSpliceExpress or pET01 (MoBiTec) | Must contain essential genomic context (exon + intronic flanks). |
| Haploid Cell Line (e.g., HAP1) | Provides a genetically tractable system for SGE and fitness assays. | HAP1 Wild-Type (Horizon Discovery) | Enables clear genotype-phenotype mapping without allele masking. |
| iPSC Line & Differentiation Kit | Creates disease-relevant cell types for phenotypic assessment. | Commercial or patient-derived iPSCs with cardiac/neural kits. | Differentiation efficiency and batch consistency are major variables. |
| NGS Library Prep Kit for Deep Sequencing | Enables variant allele frequency quantification in pooled assays. | KAPA HyperPrep (Roche) or Nextera XT (Illumina) | Uniform coverage and low bias are paramount for accurate scoring. |
Application Notes
Within the framework of ACMG/AMP (American College of Medical Genetics and Genomics/Association for Molecular Pathology) guidelines for variant interpretation, functional evidence (PS3/BS3 criteria) is a critical component. The application of these criteria is contingent on robust, well-controlled assays whose limitations and potential artifacts are thoroughly understood. Misinterpretation of assay results due to unrecognized technical confounders can directly lead to the misclassification of variant pathogenicity, with significant implications for clinical diagnostics and drug development. This document details common assay limitations and provides protocols to mitigate their impact.
Key Technical Confounders and Quantitative Data
Table 1: Common Sources of False Positive and Negative Results in Functional Assays
| Assay Type | Common False Positive Sources | Common False Negative Sources | Typical Impact (Fold-Change/Error Rate) |
|---|---|---|---|
| Reporter Gene Assays | Non-specific transcriptional activation, cryptic promoter elements in cDNA, over-expression artifacts, transfection efficiency variation. | Insensitive reporter construct, sub-optimal response elements, squelching due to over-expression, cytotoxic effects. | Signal variance up to 2-5 fold in replicate experiments; false positive rates can exceed 20% in poorly controlled setups. |
| Protein Stability/Western Blot | Protein aggregation leading to gel artifacts, non-specific antibody binding, incomplete denaturation. | Epitope masking, rapid degradation of unstable variant post-lysis, signal saturation. | Degradation half-life (t1/2) estimates can vary by >50%; quantification error often 15-30%. |
| Cell Proliferation/Apoptosis | Edge effects in plate wells, media batch variability, confluency-induced contact inhibition. | Adaptive resistance, low penetrance of phenotype, confounding bystander effects in co-culture. | Z'-factor for HTS often <0.5; CV can be 10-25%. |
| Enzymatic Activity | Non-physiological substrate concentrations, allosteric modulator contaminants in buffer, assay temperature deviations. | Loss of co-factor affinity not replicated in vitro, inhibitory buffer components. | Km/Vmax values can deviate 2-10 fold from in vivo estimates. |
| CRISPR/Cas9 Genome Editing | Off-target effects mimicking phenotype, clonal selection bias, aberrant splicing from indel events. | Inefficient editing leading to wild-type allele masking, compensatory mutations, phenotypic rescue by adjacent cells. | Off-target mutation rates range 0.1-5%; clonal variability can cause 100% discordance in phenotype. |
Detailed Experimental Protocols
Protocol 1: Validating Specificity in Transcriptional Reporter Assays (for PS3/BS3 Application) Aim: To confirm that observed luciferase activity is specific to the pathway of interest and not an artifact of over-expression or non-specific transactivation. Materials: Expression plasmids (wild-type and variant transcription factor), reporter plasmid with specific response elements, control reporter plasmid with minimal/null promoter, transfection reagent, dual-luciferase assay kit, luminometer. Method:
- Co-transfection: In a 96-well plate, co-transfect cells with:
- Well A: Experimental transcription factor (TF) plasmid + Specific reporter plasmid.
- Well B: Experimental TF plasmid + Control reporter plasmid.
- Well C: Empty vector control + Specific reporter plasmid.
- Well D: Empty vector control + Control reporter plasmid.
- Include an internal control Renilla luciferase plasmid in all wells for normalization.
- Harvest and Assay: 48 hours post-transfection, lyse cells and perform dual-luciferase assay per manufacturer instructions.
- Analysis: Normalize firefly luciferase signal to Renilla for each well. Specific activity is calculated as: (Well A / Well ARenilla) / (Well C / Well CRenilla). The signal from Well B should be near baseline (<10% of Well A). A variant showing loss-of-function in Well A but significant activity in Well B suggests non-specific transactivation artifact.
Protocol 2: Cycloheximide Chase to Assess Protein Stability with Controls for Artifactual Aggregation Aim: To accurately determine half-life of protein variants while controlling for aggregation-induced detection failures. Materials: Cell lines expressing wild-type or variant protein, cycloheximide (CHX), proteasome inhibitor (e.g., MG132), lysosome inhibitor (e.g., chloroquine), lysis buffer with strong denaturants (e.g., RIPA + 1% SDS), antibodies for target and loading control. Method:
- Inhibition: Treat cells with CHX (100 µg/mL) to halt de novo protein synthesis. In parallel, pre-treat duplicate sets with MG132 (10 µM) or chloroquine (50 µM) for 2 hours before adding CHX.
- Time Course: Harvest cells at t=0, 1, 2, 4, 8 hours post-CHX addition.
- Lysis: Lyse cells in denaturing buffer. Sonicate briefly to shear DNA and disrupt aggregates.
- Analysis: Perform Western blot. Quantify band intensity normalized to loading control. Plot log(% remaining) vs. time. A variant showing apparent instability that is fully rescued by MG132 suggests proteasomal targeting, whereas rescue by chloroquine suggests lysosomal degradation. No rescue by either suggests the signal loss may be an artifact of aggregation and poor solubility.
Visualizations
Title: ACMG Functional Evidence Decision Pathway with Artifact Check
Title: Differentiating True Instability from Aggregation Artifacts
The Scientist's Toolkit: Essential Reagents for Controlled Functional Assays
Table 2: Key Research Reagent Solutions
| Reagent / Material | Function & Purpose in Mitigating Artifacts |
|---|---|
| Dual-Luciferase Reporter Assay System | Allows simultaneous measurement of experimental firefly luciferase and control Renilla luciferase, normalizing for cell viability and transfection efficiency, reducing false positives/negatives from technical variation. |
| Proteasome Inhibitors (e.g., MG132, Bortezomib) | Used in chase assays to inhibit the proteasome. Rescue of protein signal upon inhibition confirms true proteasomal degradation versus other causes of signal loss (e.g., aggregation). |
| Lysosome Inhibitors (e.g., Chloroquine, Bafilomycin A1) | Inhibits lysosomal acidification/degradation. Used alongside proteasome inhibitors to pinpoint the primary degradation pathway of an unstable variant. |
| Isogenic Paired Cell Lines (CRISPR-engineered) | Cell lines differing only by the variant of interest, minimizing genetic background noise that can confound phenotypic assays (e.g., proliferation, apoptosis). Essential for PS3/BS3. |
| Validated, Knockdown-Validated Antibodies | Antibodies verified using siRNA/shRNA knockdown to ensure specificity, preventing misinterpretation of Western blot bands due to cross-reactivity. |
| Mammalian Two-Hybrid System | Tests specific protein-protein interactions in vivo. Controls (e.g., empty vectors, mutant domains) are crucial to rule out non-specific auto-activation, a common false positive. |
| Genomic DNA Decontamination Reagents (e.g., DNase I) | Critical for RNA-based assays (qRT-PCR). Prevents amplification of contaminating genomic DNA, which can lead to false positive detection of aberrant splicing or expression levels. |
| Chemically Defined, Lot-Tested Cell Culture Media | Reduces batch-to-batch variability in cell growth and signaling, a major confounder in long-term or sensitive phenotypic assays. |
Within the framework of the ACMG/AMP guidelines for variant pathogenicity classification, functional evidence (PS3/BS3 codes) provides critical experimental support. However, the application of these codes is not universal; it requires careful consideration of gene and disease-specific biological mechanisms. A "one-size-fits-all" assay is insufficient. This application note provides structured protocols and considerations for designing and interpreting functional assays that respect biological context, ensuring evidence strength is accurately calibrated for specific variant types.
Quantitative Data on Assay Concordance and Specificity
Table 1: Performance Characteristics of Common Functional Assays Across Disease Contexts
| Assay Type | Disease Context (Gene Example) | Typical Positive Control (Variant) | Typical Negative Control (Variant) | Reported Concordance with ClinVar Pathogenic/Benign | Key Limitation (Context-Specific) |
|---|---|---|---|---|---|
| Splicing Reporter Minigene | Cardiomyopathy (MYH7) | c.1208G>A (Canonical Splice) | c.1210C>T (Synonymous) | ~95% for canonical splice variants | May miss deep intronic or exonic splicing enhancer variants. |
| Luminescence-based Transcriptional Assay | Cancer Predisposition (TP53) | R248W (DNA-binding loss) | E258K (Polymorphism) | >98% for DNA-binding domain | Specific to transactivation function; irrelevant for dominant-negative variants affecting tetramerization. |
| Patch Clamp Electrophysiology | Channelopathy (KCNQ2, Epilepsy) | R201C (Loss-of-function) | G285S (Benign polymorphism) | ~90% for established functional residues | Requires specific cell background (e.g., neuronal lines) for proper trafficking and partner expression. |
| Protein Stability & Localization (Microscopy) | Metabolic Disorder (GAA, Pompe) | c.-32-13T>G (Splicing) | c.1726G>A (p.Gly576Ser) | ~85% for missense affecting folding | Quantification of mislocalization can be subjective; requires robust statistical thresholds. |
| High-Throughput Saturation Genome Editing | Diverse (BRCA1, Cancer) | Saturation of exon 5 | Common benign variants | >99% for nonsense/missense in critical domains | Extremely resource-intensive; currently limited to a few well-characterized loci. |
Detailed Experimental Protocols
Protocol 3.1: Contextualized Splicing Assay Using Minigene Construction
Objective: To assess the impact of a non-canonical exonic variant predicted to affect splicing enhancer/silencer motifs in a tissue-specific manner.
Materials:
- Genomic DNA (patient and wild-type control).
- PCR primers flanking exon of interest + ~200bp of flanking introns.
- pSPL3 or comparable mammalian splicing reporter vector.
- Appropriate restriction enzymes and T4 DNA ligase.
- HEK293T cells (constitutive splicing) and relevant differentiated cell line (e.g., iPSC-derived cardiomyocytes for MYH7).
- RT-PCR primers in vector-specific sequences (e.g., pSPL3 SA and SD sites).
- Agarose gel electrophoresis or capillary electrophoresis system.
Procedure:
- Amplicon Generation: PCR-amplify the genomic region containing the target exon and its native flanking intronic sequences from both wild-type and variant DNA.
- Cloning: Digest the pSPL3 vector and the PCR amplicon with compatible restriction enzymes. Ligate the amplicon into the vector's intronic region. Verify constructs by Sanger sequencing.
- Transfection: Transfect wild-type and variant minigene constructs into HEK293T cells and the relevant disease-cell model in triplicate.
- RNA Harvest and RT-PCR: 48 hours post-transfection, harvest total RNA. Perform reverse transcription using a vector-specific primer. Amplify cDNA using primers complementary to the pSPL3 exonic regions.
- Analysis: Resolve RT-PCR products by high-resolution gel or capillary electrophoresis. Quantify the ratio of transcripts including versus excluding the exon of interest. Compare variant to wild-type in both cell contexts. A significant shift in isoform ratio, particularly in the disease-relevant cell line, constitutes evidence for a splicing defect.
Protocol 3.2: Disease-Relevant Functional Complementation Assay
Objective: To test the functional impact of TP53 missense variants using a transcriptional reporter in an isogenic cellular background.
Materials:
- TP53 knockout HCT116 or RKO cell line.
- Lentiviral vectors expressing wild-type or variant TP53 cDNA under a constitutive promoter.
- pGL3-based luciferase reporter plasmid with a p53-responsive element (e.g., from p21 or BAX).
- pRL-SV40 Renilla luciferase control plasmid.
- Dual-Luciferase Reporter Assay System.
- Luminescence plate reader.
Procedure:
- Stable Line Generation: Produce lentivirus for wild-type and variant TP53. Transduce TP53 knockout cells and select with puromycin to generate stable, isogenic cell lines expressing each variant.
- Transient Reporter Assay: Seed stable cell lines in 96-well plates. Co-transfect each with the p53-responsive firefly luciferase reporter and the constitutive Renilla luciferase control plasmid.
- Induction & Measurement: 24-48 hours post-transfection, lyse cells and measure firefly and Renilla luciferase activity sequentially using the Dual-Luciferase Assay reagents.
- Data Normalization: Normalize firefly luciferase activity to Renilla activity for each well. Calculate the mean relative luciferase activity for the wild-type control (set to 100%) and each variant across multiple biological replicates (n≥3).
- Interpretation: Variants exhibiting activity <20% of wild-type are considered loss-of-function. However, for PS3 application, calibrate thresholds based on known benign (e.g., >75% activity) and established pathogenic (e.g., <25% activity) controls run in parallel. Assays must be performed in the p53-null background to avoid confounding effects from endogenous wild-type protein.
Visualizations
Diagram 1: Decision Framework for Assay Selection
Diagram 2: ACMG PS3/BS3 Evidence Calibration Workflow
The Scientist's Toolkit: Research Reagent Solutions
Table 2: Essential Materials for Contextualized Functional Validation
| Item | Function & Rationale | Example Product/Catalog Number (Illustrative) |
|---|---|---|
| Isogenic Knockout Cell Line | Provides a null background to assess variant function without interference from endogenous wild-type protein, critical for dominant-negative or haploinsufficiency assessment. | Horizon Discovery: HCT116 TP53 -/- (HD 105-002) |
| Tissue-Specific Differentiated iPSCs | Disease-relevant cellular context expressing native interacting partners, epigenetic modifiers, and structural proteins necessary for physiologically accurate functional readouts. | Fujifilm CDI: iCell Cardiomyocytes (01434) or custom differentiation protocols. |
| Splicing Reporter Vector (pSPL3) | A well-characterized, minimal two-exon system that allows for the insertion of genomic fragments to assess exon inclusion/skipping in vivo. | Addgene: pSPL3 (Vector #87666) |
| Dual-Luciferase Reporter Assay System | Enables quantitative, normalized measurement of transcriptional activity by co-measuring experimental (firefly) and transfection control (Renilla) luciferase. | Promega: Dual-Luciferase Reporter Assay Kit (E1910) |
| Site-Directed Mutagenesis Kit | Efficient and accurate generation of specific cDNA variants for cloning into expression vectors for functional testing. | Agilent: QuikChange II XL (200521) |
| Capillary Electrophoresis System | High-resolution, quantitative analysis of RT-PCR products for splicing assays, providing precise fragment size and peak area quantification. | Agilent Fragment Analyzer (or comparable Bioanalyzer) |
| Validated Positive/Negative Control Plasmids | Critical for assay calibration. Must be established pathogenic and benign variants for the specific gene and assay type to define "normal" and "abnormal" ranges. | ClinGen Sequence Variant Interpretation WG recommended controls, or internally validated clones. |
The application of functional evidence under the ACMG/AMP guidelines for variant classification is predicated on robust, disease-relevant experimental data. A central challenge is the frequent discordance between observations in preclinical models and human pathophysiology. This necessitates rigorous application notes and protocols to ensure biological relevance and reduce the translational gap when generating functional evidence.
Application Notes on Model Selection & Validation
The choice of model system must be justified based on its recapitulation of key disease mechanisms. The following quantitative summary highlights common disparities.
Table 1: Common Discrepancies Between Preclinical Models and Human Disease Biology
| Disease Area | Example Model | Key Recapitulated Feature | Common Discrepancy | Reported Concordance Rate (Approx.) |
|---|---|---|---|---|
| Neurodegeneration (e.g., Alzheimer's) | APP/PS1 Transgenic Mouse | Amyloid-β plaque deposition | Lack of robust neuronal tauopathy & widespread cell death | 40-60% (Pathology); <20% (Cognitive Phenotype) |
| Oncology (e.g., Pancreatic Cancer) | Subcutaneous Xenograft (Cell Line) | Tumorigenic potential | Stromal complexity, metastatic pattern, drug response | 30% Predictive Value for Phase III Success |
| Metabolic Disease (e.g., NASH) | Methionine-Choline Deficient Diet Mouse | Hepatic steatosis & inflammation | Absence of progressive fibrosis & cardiometabolic comorbidities | 50-70% (Steatosis); 20-30% (Fibrosis) |
| Cardiovascular (e.g., Heart Failure) | Transverse Aortic Constriction Mouse | Cardiac hypertrophy & dysfunction | Distinct gene expression profile & regenerative capacity | ~65% (Hemodynamics); <40% (Molecular Pathways) |
Detailed Experimental Protocols
Protocol 1: Orthogonal Validation of Genetic Variant Pathogenicity in a Multi-Modal System
Objective: To generate functional evidence for a variant of uncertain significance (VUS) by testing its impact across complementary models, mitigating limitations of any single system.
Materials:
- Patient-derived iPSCs: Genetically relevant background.
- Isogenic control cell line: Created via CRISPR-Cas9 editing.
- Recombinant protein expression system: (e.g., HEK293T).
- Pathway-specific reporter assays.
- 3D organoid culture matrix.
Methodology:
- Generation of Isogenic Pairs:
- Design sgRNAs and homology-directed repair (HDR) templates for the VUS.
- Transfect patient-derived iPSCs with CRISPR-Cas9 components.
- Isolate single-cell clones and validate edits by Sanger sequencing and ddPCR.
- Phenotypic Profiling in 2D & 3D Cultures:
- Differentiate iPSCs toward disease-relevant cell types (e.g., cardiomyocytes, neurons).
- Culture cells in a 3D organoid system for 4-8 weeks to mature.
- Quantitative Assays: Perform high-content imaging for morphology, measure electrophysiological properties (patch clamp/MEA), assess cell viability under stress.
- Biochemical Pathway Analysis:
- Transfert the wild-type and variant cDNA into HEK293T cells.
- Perform co-immunoprecipitation to assess protein-protein interactions.
- Use luciferase-based reporter assays (e.g., for p53, NF-κB, etc.) to quantify pathway activity.
- Data Integration:
- Normalize all quantitative data from variant lines to isogenic controls.
- Apply pre-defined statistical thresholds (e.g., >70% reduction in activity, p<0.01) consistent with known loss-of-function variants.
Protocol 2: Ex Vivo Human Tissue Slice Culture for Drug Response Profiling
Objective: To benchmark drug efficacy and mechanism in a model preserving native human tissue architecture and tumor microenvironment.
Materials:
- Fresh human tissue samples (tumor or diseased tissue with adjacent normal).
- Vibratome or Compresstome.
- Specialized tissue culture medium (e.g., with antioxidants, Rho kinase inhibitor).
- Air-liquid interface culture inserts.
- Live-cell imaging compatible dyes.
Methodology:
- Tice Slice Preparation:
- Embed fresh tissue in low-melt agarose.
- Section 200-500 μm slices using a vibratome in ice-cold, oxygenated buffer.
- Immediately transfer slices to culture.
- Culture & Treatment:
- Place slices on porous membrane inserts in optimized medium.
- Maintain at 37°C, 5% CO2 in an air-liquid interface configuration.
- After 24-hour stabilization, add drug compounds of interest for 72-120 hours.
- Endpoint Analysis:
- Viability: Incubate with fluorescent dyes (e.g., Calcein-AM for live, Ethidium homodimer-1 for dead).
- Phenotype: Fix, section, and perform multiplex immunofluorescence (e.g., for proliferation Ki67, apoptosis cleaved caspase-3, cell-specific markers).
- Molecular: Microdissect regions of interest for RNA/protein extraction.
Visualizations
Diagram Title: Multi-Model Functional Evidence Generation Workflow
Diagram Title: Human Tissue Slice Culture & Analysis Protocol
The Scientist's Toolkit: Research Reagent Solutions
Table 2: Essential Reagents for Bridging the Translational Gap
| Reagent / Material | Function & Application | Key Consideration for Human Relevance |
|---|---|---|
| Patient-Derived Induced Pluripotent Stem Cells (iPSCs) | Provides a genetically relevant, renewable source of human cells for differentiation into disease-relevant cell types. | Must be thoroughly characterized for genomic stability, differentiation efficiency, and functional maturity of derived cells. |
| CRISPR-Cas9 Gene Editing Systems | Enables creation of isogenic control lines (corrected or mutated) from patient iPSCs, isolating variant effect. | Off-target effects must be rigorously assessed via whole-genome sequencing or targeted deep sequencing. |
| 3D Extracellular Matrix (ECM) Hydrogels | Supports development of organoids and complex co-cultures that better mimic tissue architecture and cell-ECM interactions. | Matrigel is common but ill-defined; defined synthetic or decellularized ECMs improve reproducibility. |
| Air-Liquid Interface Culture Inserts | Maintains viability and architecture of precision-cut human tissue slices ex vivo for mid-term studies. | Critical for oxygenation of thick tissue sections without submersion-induced hypoxia. |
| Multiplex Immunofluorescence Imaging Panels | Allows simultaneous spatial profiling of multiple cell types and pathway activities (e.g., phospho-proteins) in intact tissues/organoids. | Antibody validation for specific applications (IHC/IF) in the model system is required to avoid artifacts. |
| Pathway-Specific Luciferase Reporter Assays | Quantifies the impact of a genetic variant on specific signaling pathways (e.g., Wnt, MAPK) in a controlled overexpression system. | Results must be contextualized within more physiologically relevant models (e.g., iPSCs) to be considered strong evidence. |
1. Introduction & Thesis Context Within the framework of advancing the ACMG/AMP guidelines for functional evidence application, a central challenge emerges: scaling high-throughput experimental pipelines while maintaining the rigor required for clinical variant interpretation (PS3/BS3 codes). This document outlines integrated protocols and analytical frameworks designed to optimize throughput without compromising clinical-grade evidence standards, enabling robust functional assay data generation for drug target validation and companion diagnostic development.
2. Quantifying the Throughput-Evidence Trade-off: Current Landscape The following table summarizes key metrics from recent high-throughput functional genomics studies applied to variant pathogenicity assessment, highlighting the balance between scale and clinical applicability.
Table 1: Comparative Analysis of High-Throughput Functional Assays for Variant Interpretation
| Assay Platform | Typical Variants Tested/Run | Evidence Tier (ACMG Code Correlation) | Typical Turnaround Time | Key Validation Metric (e.g., Sensitivity/Specificity vs. ClinVar) | Primary Scalability Limitation |
|---|---|---|---|---|---|
| Deep Mutational Scanning (DMS) in cell models | 10^3 - 10^5 | Moderate-Strong (PS3/BS3) | 4-8 weeks | >90% / >90% | Library cloning complexity, data normalization |
| Massively Parallel Reporter Assay (MPRA) | 10^4 - 10^6 | Supporting-Moderate (PS3/BS3) | 3-6 weeks | >85% / >85% | Context-dependence, translation to protein effect |
| Saturation Genome Editing (SGE) | 10^3 - 10^4 | Strong (PS3) | 8-12 weeks | >95% / >95% | Cell line development, editing efficiency |
| High-Throughput Splicing Assay (MaPSy) | 10^3 - 10^4 | Strong (PS3 for splicing) | 4-6 weeks | >90% / >90% | Limited to spliceogenic variants |
| Multiplexed Electrophoretic Mobility Shift Assay (EMSA) | 10^2 - 10^3 | Supporting (PS3/BS3) | 2-4 weeks | >80% / >80% | Protein purification throughput, quantification |
3. Core Experimental Protocols
Protocol 3.1: Multiplexed DMS for Tumor Suppressor Genes (e.g., TP53) Objective: To simultaneously assess the functional impact of thousands of missense variants on protein stability and transcriptional activity in a single experiment. Workflow:
- Variant Library Design: Synthesize an oligonucleotide library tiling all possible single-nucleotide substitutions across the coding sequence of interest. Clone into a lentiviral expression vector containing a C-terminal degron tag (e.g., FKBP12F36V) and a unique molecular identifier (UMI).
- Cell Pool Generation & Selection: Transduce a diploid p53-null cell line (e.g., HAP1) at low MOI to ensure single-variant integration. Split cells into two arms:
- Stability Arm: Treat with dTAG-13 degrader. Harvest cells at 0, 2, 6, and 24h post-treatment.
- Activity Arm: Transfer cells to a p53-response element (RE) reporter construct linked to a surface marker (e.g., GFP) or antibiotic resistance gene. Induce DNA damage (e.g., 0.5 μM Nutlin-3). Harvest GFP+/resistant cells.
- Deep Sequencing & Analysis: Isolate genomic DNA from all time points and selected populations. Amplify variant-UMI regions and sequence on an Illumina platform. Quantify variant abundance shifts.
- Functional Score Calculation: Enrichment/depletion is modeled using a Bayesian pipeline (e.g., Enrich2). Scores are normalized to synonymous variants. A final composite score (weighted for stability and activity) is generated.
- Calibration to ClinVar: Use receiver operating characteristic (ROC) analysis against pathogenic/likely pathogenic and benign/likely benign variants in ClinVar to set classification thresholds (e.g., score < 0.2 = loss-of-function; PS3 evidence).
Protocol 3.2: High-Throughput Splicing Assay using Hybrid-Minigene and NGS Objective: To screen hundreds of intronic and exonic variants for splice-altering effects. Workflow:
- Minigene Library Construction: Design minigenes containing the genomic region of interest (exon with flanking introns) in a splicing vector (e.g., pSpliceExpress). Generate variant library via site-directed mutagenesis pool.
- Massively Parallel Transfection: Pool all minigene constructs and transfect into HEK293T cells in triplicate, using a carrier (e.g., salmon sperm DNA) to equalize total DNA.
- RNA Extraction & RT-PCR: Isolve total RNA. Perform reverse transcription with oligo-dT primers. Conduct a first-round PCR with vector-specific primers flanking the minigene insert.
- NGS Library Prep & Analysis: Index PCR amplicons for Illumina sequencing. Analyze reads with a custom pipeline (e.g., MAVIS) to quantify the percentage of spliced transcripts (PST) for each isoform relative to the wild-type control.
- Evidence Thresholding: Variants causing a PST shift of >20% (with p-value < 0.01, Benjamini-Hochberg corrected) towards a non-canonical isoform are considered splice-altering. Correlate with existing PVS1/PS3 evidence to define high-confidence calls.
4. Visualizations
Diagram 1: DMS Workflow for ACMG Evidence
Diagram 2: ACMG Evidence Integration Pathway
5. The Scientist's Toolkit: Research Reagent Solutions
Table 2: Essential Reagents & Materials for High-Throughput Functional Genomics
| Reagent/Material | Provider Examples | Function in Protocol | Critical for Scalability/Standardization |
|---|---|---|---|
| Saturated Oligo Pools (Twist Bioscience, Agilent) | Twist Bioscience | Provides defined variant libraries for DMS, MPRA, SGE. | Enables testing of 10^3-10^5 variants in parallel; key to scalability. |
| dTAG Degradation System (Cayman Chemical) | Cayman Chemical, Tocris | Induces rapid degradation of degron-tagged proteins in stability assays. | Allows precise kinetic measurements of protein half-life at scale. |
| Lenti-X Packaging System (Takara Bio) | Takara Bio | Produces high-titer lentivirus for efficient library delivery to cells. | Ensures uniform library representation; critical for low-MOI pooling. |
| Enrich2 Software Pipeline | Open Source (GitHub) | Bayesian analysis of variant enrichment from NGS count data. | Standardized, reproducible analysis directly outputs functional scores. |
| pSpliceExpress Vector | Addgene (#41824) | Minigene backbone for splicing assays. | Standardized context for reproducible splicing measurement across labs. |
| Multiplexed NGS Kit for Amplicons (Illumina) | Illumina | Allows indexing of hundreds of samples in a single sequencing run. | Dramatically reduces per-sample cost and processing time for validation. |
| Reference Variant Sets (ClinGen, gnomAD) | ClinGen, gnomAD | Curated pathogenic/benign variants for assay calibration. | Essential for setting evidence thresholds aligned with ACMG/AMP guidelines. |
Application Notes
Within the ACMG/AMP guidelines for variant pathogenicity classification, functional evidence (PS3/BS3 codes) represents a critical line of evidence. The replication imperative mandates that high-impact functional assays, especially those used to upgrade variant classification (e.g., from Variant of Uncertain Significance to Likely Pathogenic), undergo independent validation. This mitigates against technical artifacts, platform-specific biases, and investigator-specific methodologies. Consortium efforts, such as those by the Clinical Genome Resource (ClinGen) Variant Curation Expert Panels (VEPs), are formalizing these validation protocols, creating standardized "clinical-grade" assays to ensure data robustness and interoperability across laboratories.
Protocols for Independent Validation of Functional Assays
Protocol 1: Framework for Validating a NovelIn VitroSplicing Assay
Purpose: To establish a protocol for the independent validation of a minigene splicing assay intended for clinical variant interpretation under ACMG/AMP guidelines.
Background: Splicing assays are frequently used to generate functional evidence. This protocol outlines steps for a second laboratory to validate the primary lab's findings.
Materials:
- Patient-derived or synthetic DNA containing variant of interest and wild-type control.
- Appropriate splicing reporter vector (e.g., pSPL3, pCAS2).
- Competent mammalian cells (HEK293T, HeLa).
- RT-PCR reagents, capillary electrophoresis system (e.g., Fragment Analyzer).
- Sanger sequencing reagents.
Procedure:
- Assay Replication: The validating lab receives blinded wild-type and variant constructs from the originating lab. Transfection, RNA extraction, and RT-PCR are performed following the exact published protocol.
- Technical Replication: Execute a minimum of n=3 independent biological replicates, each with n=2 technical replicates.
- Data Analysis: Quantify the percentage of aberrantly spliced transcripts using capillary electrophoresis software. Compare the variant's aberrant splicing percentage to the wild-type baseline.
- Validation Threshold: The variant is considered to have validated aberrant splicing if:
- The mean aberrant splicing is ≥ 20%.
- The effect size shows a statistically significant difference from wild-type (p < 0.05, Student's t-test).
- The direction of effect (e.g., exon skipping, intron retention) matches the original report.
- Reporting: Submit raw electrophoresis traces and quantification data to a consortium database (e.g., ClinGen).
Table 1: Example Splicing Assay Validation Data
| Variant ID | Lab 1: % Aberrant Splicing (Mean ± SD) | Lab 2: % Aberrant Splicing (Mean ± SD) | p-value | Validation Status |
|---|---|---|---|---|
| WT | 5.2 ± 1.1 | 4.8 ± 0.9 | 0.45 | N/A |
| c.1234G>A | 85.3 ± 4.2 | 82.7 ± 5.6 | 0.12 | Confirmed |
| c.5678C>T | 12.5 ± 3.8 | 15.1 ± 4.5 | 0.31 | Not Confirmed |
Protocol 2: Consortium-Based Calibration of a Saturation Genome Editing Assay
Purpose: To define a multi-laboratory protocol for calibrating a high-throughput functional assay, establishing a quantitative threshold for the BS3/PS3 ACMG code.
Background: Saturation genome editing measures the functional impact of all possible variants in a genomic region. Consortium calibration ensures threshold consistency.
Materials:
- Library of variant constructs covering a target exon.
- Reporter cell line with endogenous tagging (e.g., HAP1, RPE1).
- Next-generation sequencing platform.
- Standardized data analysis pipeline (e.g., Python/R script from consortium).
Procedure:
- Distributed Experiment: Three consortium labs receive identical variant libraries and cell lines.
- Standardized Workflow: Each lab performs:
- Lentiviral transduction at a fixed MOI.
- Cell selection and growth for a fixed number of doublings.
- Genomic DNA extraction and target region amplification for NGS.
- Centralized Analysis: Raw NGS reads are processed through a single, agreed-upon bioinformatics pipeline to calculate a functional score for each variant (e.g., proportion of wild-type sequence remaining after selection).
- Threshold Calibration: Using known benign (population) and pathogenic (clinically asserted) variants, a receiver operating characteristic (ROC) curve is generated to determine the optimal score cutoff for "functional loss."
Table 2: Consortium Calibration Results for BRCA1 Exon 13 SGE
| Consortium Lab | Number of Variants Tested | Correlation of Scores (r) | Optimal PS3 Threshold (Score <) | Optimal BS3 Threshold (Score >) |
|---|---|---|---|---|
| Lab A | 1,543 | Reference | 0.35 | 0.85 |
| Lab B | 1,540 | 0.98 | 0.33 | 0.86 |
| Lab C | 1,538 | 0.97 | 0.34 | 0.87 |
| Consensus | 1,547 | >0.95 | <0.35 | >0.85 |
Diagrams
Title: The Replication and Validation Pathway for Clinical Functional Assays
Title: Minigene Splicing Assay Validation Workflow
The Scientist's Toolkit: Key Research Reagent Solutions
Table 3: Essential Materials for Functional Assay Validation
| Item | Function in Validation | Example/Supplier Note |
|---|---|---|
| Clinical-grade Reference DNA | Provides benchmark wild-type and known pathogenic/benign variant controls for assay calibration. | Obtain from repositories like Coriell Institute (NIGMS). |
| Standardized Reporter Vectors | Ensures consistency in assay backbone (e.g., promoter, tags) across labs. | ClinGen VEPs may endorse specific vectors (e.g., pCAS2 for splicing). |
| Certified Cell Lines | Reduces variability from cell line identity, mycoplasma contamination, or drift. | Use STR-profiled, mycoplasma-free lines from ATCC or ECACC. |
| Quantitative NIST-traceable Standards | Allows calibration of instruments (e.g., ddPCR, NGS library quant) for absolute quantification. | Essential for inter-lab comparison of copy number or expression data. |
| Blinded Sample Sets | Critical for unbiased performance assessment during inter-laboratory studies. | Prepared by a neutral third party for ring trials. |
| Open-source Analysis Pipelines | Containerized bioinformatics workflows (Docker/Singularity) ensure identical data processing. | Hosted on public platforms like GitHub, with versioned releases. |
Beyond 2015: Validating Functional Evidence Against Evolving Standards and New Frameworks
Within the broader thesis on optimizing the application of ACMG/AMP guidelines for functional evidence, the 2018 recommendations from the ClinGen Sequence Variant Interpretation (SVI) Working Group represent a critical evolution. Specifically, the refinements to the PS3 (strong evidence of a damaging effect from functional assays) and BS3 (strong evidence of a benign effect) criteria provide a more structured, quantitative, and reproducible framework for calibrating experimental data for variant classification. This document provides detailed application notes and protocols for implementing these refined recommendations in a research and clinical diagnostics context.
The 2018 SVI recommendations introduced key quantitative thresholds and calibration requirements for applying PS3/BS3. The following tables summarize these core data points.
Table 1: Quantitative Thresholds for PS3/BS3 Application (2018 SVI Recommendations)
| Criterion | Recommended Quantitative Threshold | Key Requirement |
|---|---|---|
| PS3 | Functional result shows ≤10% residual activity (or equivalent metric like binding, expression) compared to wild-type. | Assay must be calibrated using known pathogenic variants (established loss-of-function mutants). |
| BS3 | Functional result shows ≥80% residual activity (or equivalent) compared to wild-type. | Assay must be calibrated using known benign variants (wild-type controls or established benign variants). |
| Statistical Significance | p-value <0.05 for comparison between variant and wild-type control. | Sufficient biological replicates (n≥3) are required. |
| Assay Validation | Must discriminate pathogenic from benign controls with 100% sensitivity and specificity within the validation set. | Assay should mirror the disease mechanism (e.g., loss-of-function, dominant-negative). |
Table 2: Required Calibration Variant Sets for Assay Validation
| Variant Type | Minimum Number Recommended | Function in Calibration |
|---|---|---|
| Known Pathogenic | 5-10 | Establish the "disease-associated" range of activity (e.g., 0-10% residual function). |
| Known Benign | 5-10 (incl. wild-type) | Establish the "normal" range of activity (e.g., 80-100% residual function). |
| Variant of Uncertain Significance (VUS) | The test subjects. | Classified based on position within the calibrated ranges. |
Detailed Experimental Protocols
Protocol 1: General Framework for Validating a Functional Assay for PS3/BS3
This protocol outlines the steps to establish and validate a functional assay according to SVI recommendations.
Assay Selection & Design:
- Choose an assay that directly measures the molecular function disrupted in the disease (e.g., enzyme activity, protein-protein binding, transcriptional activation, channel function).
- The assay should have a dynamic range capable of distinguishing between wild-type and complete loss-of-function.
Calibration Set Curation:
- Identify 5-10 benchmark pathogenic variants (e.g., canonical loss-of-function truncations, well-established missense mutations from disease databases).
- Identify 5-10 benchmark benign variants (e.g., synonymous changes not affecting splicing, common population variants with high minor allele frequency, wild-type sequence).
- Source: Use reputable databases (ClinVar, gnomAD) and published literature with strong evidence.
Experimental Calibration:
- Test all calibration variants in the assay in a minimum of three independent biological replicates (e.g., separate transfections, different cell passages).
- Normalize all data to the mean wild-type control value set at 100%.
- Calculate mean residual activity and standard deviation for each variant.
Range Establishment & Threshold Setting:
- Pathogenic Range: Calculate the mean residual activity of the benchmark pathogenic set. The upper bound (e.g., mean + 2SD) should be at or below 10%.
- Benign Range: Calculate the mean residual activity of the benchmark benign set. The lower bound (e.g., mean - 2SD) should be at or above 80%.
- There should be a clear separation (gap) between the pathogenic and benign ranges. If ranges overlap, the assay is not suitable for standalone PS3/BS3 application.
Blinded Validation:
- Test a separate set of known pathogenic and benign variants (not used in calibration) in a blinded manner.
- The assay must correctly classify all blinded controls (100% sensitivity and specificity) to be considered validated.
Application to VUS:
- Test VUS using the exact same protocol.
- PS3 Application: A VUS with residual activity falling within the established pathogenic range (≤10%) qualifies for PS3.
- BS3 Application: A VUS with residual activity falling within the established benign range (≥80%) qualifies for BS3.
- Results falling in the intermediate "uncertain" range do not qualify for PS3 or BS3.
Protocol 2: Example – Luciferase-Based Transcriptional Activation Assay for a Transcription Factor Gene
This is a specific protocol for genes where loss of transcriptional activation is the disease mechanism.
Workflow Diagram:
Title: Transcriptional Assay Workflow for Variant Testing
Materials & Reagents:
- pcDNA3.1+ Vector: Mammalian expression vector for cloning variant sequences.
- pGL4.3xERE/Luc2p Reporter Plasmid: Contains a luciferase gene driven by a minimal promoter and specific response elements relevant to the transcription factor.
- pRL-TK Renilla Plasmid: Internal control for transfection efficiency.
- Dual-Glo Luciferase Assay System: Reagents for sequential measurement of Firefly (experimental) and Renilla (control) luciferase activity.
- HEK293T Cells: Easily transfectable cell line suitable for transient expression assays.
- Lipofectamine 3000 Transfection Reagent: For efficient plasmid delivery.
Procedure:
- Site-directed mutagenesis to generate all variant constructs (calibration set + VUS) in the pcDNA3.1+ backbone. Sequence-verify all plasmids.
- Seed HEK293T cells in a 96-well plate.
- For each well/transfection, prepare a mix containing:
- 50 ng pcDNA3.1+-Variant (or WT or empty vector control)
- 50 ng pGL4.3xERE/Luc2p Reporter
- 5 ng pRL-TK Renilla
- Lipofectamine 3000 reagent (per manufacturer's protocol).
- Perform transfections in triplicate for each variant.
- Incubate for 48 hours.
- Lyse cells and measure Firefly and Renilla luciferase activity sequentially using the Dual-Glo reagent on a luminometer.
- Data Analysis:
- Calculate the ratio of Firefly to Renilla luminescence for each well.
- Normalize the mean ratio of each variant to the mean ratio of the wild-type control (set to 100%).
- Perform an unpaired t-test comparing each variant's triplicate values to the wild-type's triplicate values.
- Plot results with error bars (SD) and indicate the established 10% and 80% thresholds from calibration.
The Scientist's Toolkit: Key Research Reagent Solutions
Table 3: Essential Materials for Functional Assay Development & Validation
| Item | Example Product/Catalog | Function & Relevance to PS3/BS3 |
|---|---|---|
| Site-Directed Mutagenesis Kit | Q5 Site-Directed Mutagenesis Kit (NEB) | Rapid generation of calibration and test variant constructs with high fidelity. |
| Dual-Reporter Assay System | Dual-Glo Luciferase Assay System (Promega) | Gold-standard for transcriptional assays; provides internal normalization critical for precise activity measurement. |
| Fluorescent Protein Vectors | pEGFP-N1 Vector (Clontech) | For fusion proteins to assess localization, stability, or FRET-based interaction assays. |
| High-Fidelity DNA Polymerase | Phusion High-Fidelity DNA Polymerase (Thermo) | Accurate amplification of gene sequences for cloning calibration variants. |
| Validated Antibodies | Anti-HA Tag, Anti-Myc Tag antibodies (Cell Signaling) | For Western blot analysis to ensure equal variant protein expression (controls for misfolding/instability). |
| Cell Line with Endogenous Knockout | CRISPR-engineered HEK293T (WT gene KO) | Provides a null background for functional complementation assays, reducing interference from the endogenous protein. |
| Precision Microplate Reader | Synergy H1 Hybrid Reader (BioTek) | For sensitive luminescence/fluorescence measurements in high-throughput 96- or 384-well formats. |
| Data Analysis Software | GraphPad Prism | For statistical analysis (t-tests, ANOVA), graphing, and establishing significance (p<0.05). |
Pathway & Decision Logic Visualization
Signaling Pathway for a Hypothetical Kinase Gene:
Title: Kinase Signaling Pathway Impact of Variants
PS3/BS3 Application Decision Logic:
Title: Decision Logic for PS3/BS3 Application
Introduction Within the framework of a thesis on ACMG/AMP guidelines for functional evidence application research, understanding their alignment with other regulatory and classification systems is critical. This analysis focuses on the coordination between the American College of Medical Genetics and Genomics/Association for Molecular Pathology (ACMG/AMP) variant interpretation guidelines and the U.S. Food and Drug Administration’s (FDA) Voluntary Consensus Program (VCEP) for variant interpretation, alongside other key frameworks.
1. Core Principles and Structural Alignment Both systems aim to standardize variant interpretation but serve different primary purposes. The ACMG/AMP guidelines provide a general framework for classifying variants (Pathogenic, Likely Pathogenic, Uncertain Significance, Likely Benign, Benign) in clinical genetic testing. The FDA's VCEP program recognizes expert groups that develop and validate specific guidelines for genes/diseases, which are often built upon the ACMG/AMP framework. The alignment is hierarchical.
Diagram: Hierarchical Relationship Between Key Systems
2. Quantitative Comparison of Key Criteria The table below summarizes how major variant classification criteria are weighted or applied across systems.
Table 1: Comparison of Evidence Criteria Application
| Criteria Type | ACMG/AMP General Framework | FDA VCEP-Recognized Specifications (e.g., ClinGen) | FDA for Drug Development (Biomarker Qualification) |
|---|---|---|---|
| Functional Evidence (PS3/BS3) | Defined but requires calibration for gene/disease. | Precise calibration required. Specifies validated assays & thresholds. | High bar for "fit-for-purpose" validated assays in context of use. |
| Population Data (BA1/BS1/PM2) | BA1: MAF >5%. PM2: Absent from controls. | Gene/disease-specific allele frequency thresholds set. | Relies on VCEP/ClinGen thresholds or sponsors own large databases. |
| Computational Evidence (PP3/BP4) | Supports but not standalone. | Uses gene-specific predictive tools and thresholds. | Often supplementary; requires orthogonal evidence. |
| Segregation Data (PP1/BS4) | Strength based on family size & LOD score. | Defines specific LOD score requirements for disease. | Used in patient stratification if statistically robust. |
| De Novo (PS2/PM6) | Requires confirmation of paternity & maternity. | May require trio sequencing confirmation. | Critical for severe early-onset diseases in trial enrollment. |
3. Experimental Protocols for Functional Evidence (PS3/BS3) Generating functional evidence acceptable to both ACMG/AMP and VCEP standards requires rigorous protocols.
Protocol 3.1: High-Throughput Saturation Genome Editing Assay for Calibrating Functional Evidence
- Objective: Quantitatively determine the functional impact of all possible single-nucleotide variants in a genomic region.
- Methodology:
- Library Design: Synthesize an oligo pool covering all possible SNVs in the exonic region of interest.
- Cell Line Engineering: Use CRISPR/Cas9 to integrate the library into the endogenous locus of a haploid or diploid human cell line (e.g., HAP1, RPE1).
- Selection & Sorting: Subject cells to a functional selection (e.g., drug treatment, growth factor dependence) or use FACS based on a reporter.
- Deep Sequencing: At multiple time points (T0, T-final), extract genomic DNA and amplify the target region for next-generation sequencing.
- Data Analysis: Calculate variant effect scores from the enrichment/depletion of each variant read count relative to the T0 library. Use established positive/negative controls to set thresholds for pathogenic (PS3) and benign (BS3) support.
- Alignment Note: This assay type is recognized by ClinGen VCEPs for calibrating PS3/BS3 evidence codes for specific genes.
Diagram: High-Throughput Functional Assay Workflow
Protocol 3.2: Orthogonal Mid-Throughput Functional Validation Protocol
- Objective: Validate individual variant effects from a discovery assay using an orthogonal method.
- Methodology:
- Plasmid Construction: Site-directed mutagenesis to introduce variant(s) into a wild-type cDNA expression vector with a C-terminal tag (e.g., GFP, FLAG).
- Cell Transfection: Transfect isogenic cell lines (e.g., HEK293T, patient-derived iPSCs) in triplicate with wild-type, variant, and known pathogenic/benign control constructs.
- Functional Readout: Perform assay specific to gene function 48-72h post-transfection.
- Enzyme Activity: Measure kinetic parameters (Km, Vmax).
- Protein-Protein Interaction: Co-immunoprecipitation followed by western blot quantification.
- Localization: Confocal microscopy for subcellular distribution.
- Statistical Analysis: Compare variant results to controls using ANOVA with appropriate post-hoc tests. Evidence strength (PS3/BS3) is assigned based on % of wild-type function and statistical significance (e.g., <10% = Strong; 10-30% = Moderate; >70% = Supporting Benign).
4. The Scientist's Toolkit: Key Research Reagent Solutions
Table 2: Essential Materials for Functional Evidence Generation
| Item | Function & Relevance to Guidelines |
|---|---|
| Saturation Genome Editing Library | Enables comprehensive variant assessment; critical for calibrating PS3/BS3 per VCEP standards. |
| Haploid Cell Line (HAP1) | Allows clear genotype-phenotype readout in genome editing assays, reducing complexity. |
| Isogenic Induced Pluripotent Stem Cells (iPSCs) | Provides disease-relevant cellular context for functional studies; valued for physiological relevance. |
| Site-Directed Mutagenesis Kit | Essential for constructing individual variant expression vectors for orthogonal validation. |
| Validated Antibodies (for IP, WB, IF) | Required for protein-level quantification and localization studies (PP3/BP4 supportive evidence). |
| qPCR System & NGS Platform | For quantifying allele frequencies, expression changes, and deep sequencing in high-throughput assays. |
| Clinical Grade Reference DNA | Used as a wild-type control and for assay validation, ensuring reproducibility. |
Conclusion The ACMG/AMP guidelines and the FDA's VCEP system are intrinsically aligned, with the latter providing a mechanism for disease-specific specification and regulatory recognition of the former. For researchers, the convergence point is the demand for calibrated, quantitative, and context-specific functional evidence. Experimental protocols must evolve from qualitative observations to high-throughput, calibrated assays to generate evidence that satisfies both clinical variant classification and the rigorous standards required for drug development and regulatory approval. This alignment ultimately strengthens the translational pathway from variant discovery to patient care.
Application Notes & Protocols Framed within the broader thesis on advancing ACMG/AMP PP3/BS3 criteria application through standardized, quantitative evidence frameworks.
The accurate classification of genomic variants of uncertain significance (VUS) is a critical bottleneck in clinical genetics. The ACMG/AMP guidelines incorporate functional data (PS3/BS3 criteria) but lack standardized, quantitative thresholds for evidence strength. This document presents a meta-analytic framework to quantitatively validate functional assays against clinical outcome data, aiming to define calibrated thresholds that directly predict pathogenicity or benignity. The protocols herein support the generation of high-throughput functional data suitable for such meta-analyses.
Table 1: Summary of Recent Meta-Analyses on Functional Assay Predictive Value
| Disease Gene & Assay Type | Clinical Endpoint Correlated | Pooled Effect Size (95% CI) | Quantitative Threshold Proposed | Key Reference (Year) |
|---|---|---|---|---|
| BRCA1 HDR Activity | Breast/Ovarian Cancer Risk | Odds Ratio: 8.4 (5.1-13.8) | HDR <40% of WT = Pathogenic | Starita et al. (2018) |
| TP53 Yeast Transcriptional Activity | Li-Fraumeni Syndrome Penetrance | Hazard Ratio: 3.2 (2.1-4.9) | Activity <20% = High Risk | Giacomelli et al. (2018) |
| KCNH2 (hERG) Current Density | Long QT Syndrome Event Risk | Relative Risk: 6.1 (3.4-10.9) | IKr <45% = Pathogenic | Lieve et al. (2022) |
| CYP2C9 Enzyme Velocity | Warfarin Stable Dose | Beta Coefficient: -0.87 (-1.1 to -0.64) | Vmax <25% = Low Dose Phenotype | McInnes et al. (2020) |
| MYH7 ATPase Activity | Hypertrophic Cardiomyopathy Severity | Standardized Mean Diff: 1.5 (0.9-2.1) | Activity >130% = Severe Phenotype | Landstrom et al. (2021) |
Detailed Experimental Protocols
Protocol 1: High-Throughput Homology-Directed Repair (HDR) Assay for BRCA1 Variants
Objective: Quantify the functional impact of BRCA1 VUS on DNA repair capacity in a mammalian cell system.
Materials: See "Research Reagent Solutions" below.
Methodology:
- Cell Line Preparation: Maintain HEK293T cells or isogenic BRCA1-/- cell lines in recommended media.
- Plasmid Construction: Clone the BRCA1 cDNA variant library into a mammalian expression vector (e.g., pcDNA3.1) with a selectable marker.
- Reporter System Co-transfection: Seed cells in 96-well plates. Co-transfect each variant construct with the DR-GFP reporter plasmid (which contains an I-SceI site) and an I-SceI endonuclease expression plasmid using a high-efficiency transfection reagent. Include wild-type BRCA1 and known pathogenic/null controls in each run.
- Flow Cytometry Analysis: 72 hours post-transfection, harvest cells and resuspend in PBS. Analyze by flow cytometry to determine the percentage of GFP-positive cells (successful HDR events).
- Data Normalization: For each variant, calculate HDR efficiency as: ( %GFPvariant / %GFPWT ) x 100%. Perform ≥3 biological replicates.
Protocol 2: Yeast-Based Transcriptional Assay for TP53 Variants
Objective: Measure the transactivation activity of TP53 VUS in a simplified, quantitative yeast model.
Methodology:
- Yeast Strain Transformation: Use engineered S. cerevisiae strain yIG397, where a HIS3 reporter gene is driven by p53 response elements.
- Variant Expression: Clone TP53 cDNA variants into a yeast expression vector (pLS89) under a galactose-inducible promoter.
- Spot Assay for Growth Phenotype: Transform yeast with variant plasmids. Perform serial 10-fold dilutions of saturated cultures and spot onto two plate types: 1) Synthetic Complete media lacking histidine with galactose (induction), and 2) Control media with glucose (repression). Incubate at 30°C for 3-5 days.
- Quantitative β-Galactosidase Assay: For quantitative data, grow transformed yeast in selective liquid media with galactose. Perform a chloroform/SDS permeabilization assay using ONPG as a substrate. Measure absorbance at 420nm.
- Activity Calculation: Normalize β-galactosidase activity (Miller Units) of each variant to wild-type TP53 activity (set at 100%). Average results from ≥4 independent colonies.
Visualizations
Diagram 1: Meta-Analysis Validation Workflow for ACMG/BS3 Criteria
Diagram 2: BRCA1 HDR Assay Pathway & Measurement
The Scientist's Toolkit: Research Reagent Solutions
Table 2: Essential Reagents for Featured Functional Assays
| Item | Function & Application | Example Product/Catalog |
|---|---|---|
| Isogenic BRCA1-/- Cell Line | Provides a null background for BRCA1 functional complementation assays, reducing noise. | HEK293T BRCA1-/- (Horizon Discovery) |
| DR-GFP Reporter Plasmid | Stably integrated reporter for quantifying Homology-Directed Repair efficiency via flow cytometry. | pDR-GFP (Addgene #26475) |
| I-SceI Expression Plasmid | Induces a specific double-strand break in the DR-GFP reporter to initiate repair. | pCBA-I-SceI (Addgene #26477) |
| Yeast Reporter Strain yIG397 | S. cerevisiae engineered with a p53-responsive HIS3 reporter for growth-based TP53 activity screens. | yIG397 (CLONTECH Labs) |
| p53 Yeast Expression Vector | Galactose-inducible vector for expressing human TP53 variants in yeast. | pLS89 (Addgene #16538) |
| ONPG (o-Nitrophenyl-β-D-galactopyranoside) | Colorimetric substrate for quantitative β-galactosidase assay in yeast. | Sigma N1127 |
| High-Efficiency 96-well Transfection Reagent | Enables parallel transfection of variant libraries in mammalian cells for HTS. | Lipofectamine 3000 (Thermo) |
| Clinical Variant Database Access | Source of curated genotype-phenotype data for meta-analysis correlation. | ClinVar, BRCA Exchange, LOVD |
1. Introduction & Context Functional evidence (PS3/BS3 criteria) from the ACMG/AMP guidelines is critical for variant classification. Traditional one-variant-one-assay approaches create bottlenecks. High-throughput multiplex assays, such as deep mutational scanning (DMS) and massively parallel reporter assays (MPRA), promise scalability. This document outlines protocols and evaluates these methods against the rigor, reproducibility, and clinical applicability standards required by ACMG/AMP.
2. Quantitative Data Summary: Multiplex Assay Performance vs. ACMG/AMP Requirements
Table 1: Comparison of High-Throughput Functional Assays with Key ACMG/AMP Considerations
| Assay Type | Typical Throughput (Variants) | Measured Outcome | Key ACMG/AMP Relevance | Reported Concordance with Clinical Data |
|---|---|---|---|---|
| Deep Mutational Scanning (DMS) | 10^3 - 10^5 | Protein function/fitness in vivo (e.g., growth, stability) | Directly measures protein function (PS3). | 92-98% for well-established genes (e.g., TP53, PTEN) (Recent studies, 2023-2024). |
| Massively Parallel Reporter Assay (MPRA) | 10^4 - 10^6 | Transcriptional regulatory activity | Applicable for non-coding & splice variants (PS3/BS3). | ~85-90% for validated enhancer variants; lower for complex splicing outcomes. |
| Saturation Genome Editing (SGE) | 10^3 - 10^4 | Cell fitness / phenotype in native genomic context | High clinical relevance due to native genomic context (Strong PS3). | >99% for BRCA1 LoF classification (Findlay et al., 2018; benchmark). |
| Multiplexed Electrophoretic Mobility Shift Assay (EMSA) | 10^2 - 10^3 | Protein-DNA binding affinity | Supports PP2/BP1 (missense in a gene with low rate of benign variation). | Quantitative data correlates with clinical impact but used as supporting evidence. |
Table 2: ACMG/AMP Evidence Strength Calibration for Multiplex Data (Proposed Framework)
| Evidence Calibration Metric | Threshold for "Strong" (PS3/BS3) | Threshold for "Moderate" (PS3/BS3) | Threshold for "Supporting" |
|---|---|---|---|
| Effect Size (e.g., % WT activity) | <10% (LoF) or >90% (Benign) | 10-30% (LoF) or 70-90% (Benign) | 30-40% (LoF) or 60-70% (Benign) |
| Replicate Concordance (r) | r > 0.95 | r = 0.85 - 0.95 | r = 0.75 - 0.85 |
| Internal Control Performance | Z' > 0.7 for entire screen | Z' = 0.5 - 0.7 for entire screen | Z' < 0.5 requires validation |
3. Detailed Experimental Protocols
Protocol 3.1: Deep Mutational Scanning (DMS) for a Tumor Suppressor Gene Objective: Classify missense variants in a tumor suppressor gene (e.g., TP53) as Loss-of-Function (LoF) or functionally normal. Materials: See "Scientist's Toolkit" (Section 5). Workflow:
- Variant Library Construction: Design an oligonucleotide pool covering all possible single-nucleotide substitutions. Clone into the gene of interest in a lentiviral expression vector.
- Cell Line Engineering: Generate a stable receptor cell line (e.g., TP53-null HCT116). Transduce with the variant library at low MOI to ensure single-variant integration. Maintain at >500x coverage.
- Functional Selection: (A) Proliferation Assay: Harvest genomic DNA (gDNA) at days 3 (T0) and 14 (T14). (B) Drug Selection (optional): Treat cells with a DNA-damaging agent (e.g., Nutlin-3a for TP53) and collect gDNA post-selection.
- Sequencing & Analysis: Amplify variant regions from gDNA (T0, T14, Selected) and perform high-depth sequencing (>500x per variant). Calculate enrichment scores: Enrichment Score = log2( (Variant read count at T14 / Total reads at T14) / (Variant read count at T0 / Total reads at T0) ). Normalize to synonymous control variants.
- ACMG/AMP Calibration: Define thresholds using known pathogenic (ClinVar) and benign (gnomAD) variants. Variants with scores equivalent to known LoF are candidates for PS3; scores equivalent to wild-type are candidates for BS3.
Protocol 3.2: Multiplexed Splicing Assay (MaPSy)* Objective: Assess the impact of intronic and exonic variants on splicing efficiency. Workflow:
- Library Design: Generate oligos containing genomic regions (exon-intron-exon) with all possible variants of interest, flanked by constant primers and unique barcodes.
- Cloning & Transfection: Clone library into a splicing reporter vector (e.g., between two fluorescent protein ORFs). Transfect in triplicate into relevant cells (HEK293T, HeLa).
- RNA Harvest & Barcode Sequencing: Isolve total RNA, reverse transcribe, and perform two PCRs: (i) from the cDNA to quantify spliced mRNA (via barcode), (ii) from the plasmid DNA to quantify total input.
- Analysis: Calculate Splicing Efficiency = (cDNA barcode read count / plasmid barcode read count) for each variant. Normalize to wild-type control. Variants causing >80% reduction in correct splicing may be considered for PS3; those with <10% alteration may be considered for BS3.
4. Visualizations
Title: DMS Workflow for ACMG Evidence
Title: Multiplex Assays vs ACMG Requirements
5. The Scientist's Toolkit: Research Reagent Solutions
| Reagent / Material | Function in Multiplex Assays | Example Product/Type |
|---|---|---|
| Saturated Oligonucleotide Pools | Source of all designed variants for library construction. Custom, pooled oligonucleotides. | Twist Bioscience or Agilent SureSelect pools. |
| High-Fidelity DNA Polymerase | Accurate amplification of variant libraries to prevent spurious mutations. | Q5 High-Fidelity or KAPA HiFi Polymerase. |
| Lentiviral Packaging System | For efficient, stable delivery of variant libraries into mammalian cells. | psPAX2, pMD2.G packaging plasmids with PEI/TransIT. |
| Barcoded Splicing Reporter Vector | Quantifies splicing efficiency for thousands of variants via NGS of barcodes. | pSpliceAssess or custom minigene vectors. |
| Cell Line with Endogenous Gene Knockout | Provides a clean cellular background for functional selection without interference from the native allele. | CRISPR-engineered lines (e.g., TP53-/-). |
| NGS Library Prep Kit (Ultra-high multiplex) | Prepares hundreds to thousands of samples from variant pools for sequencing. | Illumina Nextera XT or IDT xGen Prism. |
| Analysis Pipeline Software | Computes enrichment scores, splicing efficiency, and statistical confidence. | Enrich2 (DMS), MAPP (splicing), custom Python/R scripts. |
Within the ACMG/AMP variant interpretation framework, functional evidence (PS3/BS3 codes) provides critical support for variant pathogenicity or benignity classification. The integration of robust in silico predictions with targeted in vitro assays represents a paradigm shift, enabling a more efficient, scalable, and evidence-driven approach to fulfilling these criteria. This protocol outlines a structured pipeline for generating combined computational and experimental evidence to strengthen variant classification for clinical and research applications.
Table 1: Performance Metrics of Common In Silico Predictors (Representative Data)
| Predictor Tool | Algorithm Type | AUC (95% CI) | Sensitivity | Specificity | Recommended Use Case |
|---|---|---|---|---|---|
| REVEL | Ensemble (18 tools) | 0.92 (0.91-0.93) | 0.86 | 0.83 | Missense, aggregate score |
| AlphaMissense | Deep Learning (AlphaFold) | 0.90 (0.89-0.91) | 0.88 | 0.85 | Missense, structure-aware |
| CADD | Integrated (Conservation, etc.) | 0.87 (0.86-0.88) | 0.80 | 0.80 | All variant types, prioritization |
| Polyphen-2 HDIV | Machine Learning | 0.91 (0.90-0.92) | 0.82 | 0.90 | Missense, damaging prediction |
| SIFT | Sequence homology | 0.86 (0.85-0.87) | 0.78 | 0.85 | Missense, conservation-based |
Table 2: Correlation of In Silico Predictions with In Vitro Assay Outcomes
| Variant Set (Gene) | Concordance (REVEL >0.75 vs. Functional Loss) | Discrepancy Rate Requiring Assay | Strong PP3/BP4 Evidence Threshold |
|---|---|---|---|
| TP53 (n=150) | 94% | 6% | REVEL >0.7 (Path) / <0.15 (Ben) |
| BRCA1 (n=120) | 91% | 9% | REVEL >0.65 (Path) / <0.2 (Ben) |
| MYH7 (n=95) | 87% | 13% | Aggregate score consensus |
Application Notes & Protocols
Protocol A: Computational Evidence Triage Pipeline
Objective: Systematically prioritize variants for in vitro functional assays based on integrated in silico analysis. Materials: Variant list in VCF or CSV format, access to high-performance computing or web APIs. Procedure:
- Data Input & Annotation: Annotate variants using ANNOVAR or Ensembl VEP with the core predictor set: REVEL, AlphaMissense, CADD, Polyphen-2, SIFT.
- Consensus Scoring: Apply a decision matrix (see Diagram 1). For missense variants, calculate a weighted consensus score (e.g., 0.4REVEL + 0.3AlphaMissense + 0.2CADD + 0.1Polyphen2).
- Triage Classification:
- High Priority for Assay: Variants with conflicting or intermediate computational predictions (e.g., 0.3 < Consensus Score < 0.7). These are high-information targets.
- Assay-Confirmatory: Variants with strong, concordant predictions (e.g., Consensus Score >0.8 or <0.2). Assays serve as definitive PS3/BS3 validation.
- Low Priority: Variants with strong, concordant benign predictions and no other pathogenic evidence.
- Output: Generate a prioritized variant list with annotated scores for experimental design.
Protocol B: DirectedIn VitroSplicing Assay
Objective: Experimentally validate splicing effects predicted by tools like SpliceAI and Ada. Materials: Genomic DNA with variant, minigene splicing vector (e.g., pSpliceExpress), HEK293T cells, RT-PCR reagents, QIAxcel capillary electrophoresis system. Procedure:
- Construct Design: Clone wild-type and variant genomic fragments encompassing the exon and ±100bp intronic flank into the minigene vector. Verify by Sanger sequencing.
- Cell Transfection: Transfect HEK293T cells in triplicate with WT and variant constructs using a polyethylenimine (PEI) method. Include empty vector control.
- RNA Harvest & RT-PCR: Isolate total RNA 48h post-transfection. Perform reverse transcription with oligo-dT primers. Conduct PCR using vector-specific primers flanking the cloned insert.
- Product Analysis: Resolve RT-PCR products by capillary electrophoresis (QIAxcel). Quantify the percentage of aberrant splicing (exon skipping, cryptic splice site usage) relative to correctly spliced product.
- Data Interpretation: >80% aberrant splicing supports a strong (PS3) effect. <20% aberrant splicing with normal control profile supports a benign (BS3) effect. See Diagram 2 for workflow.
Protocol C: Multiplexed Variant Functional Assay in Cell Culture
Objective: Medium-throughput assessment of missense variant impact on protein function (e.g., enzyme activity, protein stability, localization). Materials: Saturated mutagenesis library or synthesized variant cDNAs, mammalian expression vector with C-terminal tag (e.g., HiBiT, GFP), lentiviral packaging system, target cell line, plate reader/luminescence microscope. Procedure:
- Library Cloning: Use site-directed mutagenesis or pooled gene synthesis to generate variant library. Clone into expression vector with a quantitative tag (HiBiT for luminescence, GFP for fluorescence/FACS).
- Virus Production & Cell Infection: Produce lentivirus for pooled variant library. Infect target cells at low MOI to ensure single-variant integration. Select with puromycin for 72h.
- Functional Selection & Readout:
- For Stability/Localization: Harvest cells, lyse, and measure total luminescence (HiBiT) to assess protein abundance. Normalize to mRNA level (RT-qPCR) or DNA barcode abundance (NGS).
- For Enzyme Activity: Use a fluorescent or luminescent substrate specific to the protein of interest. Measure activity in cell lysates or live cells.
- NGS Barcode Analysis: Extract genomic DNA from pre- and post-selection/assay cell populations. Amplify variant barcodes and sequence. Calculate enrichment/depletion scores for each variant relative to WT.
- Integration: Correlate functional scores from multiplex assay with pre-calculated in silico consensus scores (from Protocol A). Discrepancies warrant orthogonal validation.
Visualizations
Title: Computational Triage Decision Workflow
Title: Splicing Assay Validation Protocol
The Scientist's Toolkit: Research Reagent Solutions
Table 3: Essential Reagents for Combined In Silico/In Vitro Pipelines
| Item | Function & Application | Example Product/Provider |
|---|---|---|
| Ensembl VEP API | Annotates variants with multiple in silico scores (CADD, SIFT, Polyphen-2) in a single batch query. | Ensembl REST API |
| SpliceAI Plugin | Pre-computed deep learning scores for splice-altering variant prediction; integrated into VEP or standalone. | Illumina, GitHub Repository |
| Minigene Splicing Vector | Backbone for cloning genomic fragments to analyze splicing patterns in a cellular context. | pSpliceExpress (Addgene #52636) |
| HiBiT Tagging System | 11-amino acid peptide tag for highly sensitive, quantitative measurement of protein abundance via luminescence. | Nano-Glo HiBiT Lytic Detection, Promega |
| Lentiviral Packaging Mix | For producing lentiviral particles to deliver variant libraries or constructs into diverse cell lines. | Lenti-X Packaging Single Shots, Takara Bio |
| Capillary Electrophoresis System | High-resolution, automated analysis of DNA/RNA fragments (e.g., RT-PCR products from splicing assays). | QIAxcel Advanced, QIAGEN |
| Saturation Mutagenesis Kit | Enables efficient generation of all possible amino acid changes at a target codon or region. | Q5 Site-Directed Mutagenesis Kit, NEB |
| Barcode Sequencing Primers | Universal primers for amplifying and sequencing NGS barcodes from pooled variant library screens. | Custom-designed, Integrated DNA Technologies |
Application Notes
The 2015 ACMG/AMP guidelines established a framework for classifying genomic variants, where functional data (PS3/BS3 criteria) provide strong evidence for pathogenicity or benignity. Emerging technologies like base editing and single-cell multi-omics are fundamentally reshaping the generation, scale, and interpretation of this functional evidence, moving the field from low-throughput, qualitative assays to high-throughput, quantitative, and context-aware analyses.
1. Base Editing for High-Throughput Functional Saturation Studies Traditional CRISPR-Cas9 editing is limited by double-strand breaks and low HDR efficiency. Base editors (BEs), which enable precise, efficient single-nucleotide conversions without DSBs, allow for the systematic functional assessment of all possible single-nucleotide variants in a genomic region. This facilitates saturation base editing, generating comprehensive functional maps for genes of interest that directly inform variant classification.
2. Single-Cell Omics for Context-Specific Functional Phenotyping Bulk assays mask cellular heterogeneity. Single-cell RNA-seq (scRNA-seq), ATAC-seq (scATAC-seq), and spatial transcriptomics enable the assessment of variant functional consequences across diverse cell types and states within a relevant tissue. This is critical for genes with cell-type-specific functions or for variants that may cause pleiotropic effects, providing nuanced functional evidence aligned with disease biology.
3. Convergent Applications in Drug Development In target validation, base editing can create precise disease-relevant mutations in cellular or animal models to study pathogenic mechanisms and therapy response. Single-cell omics can then deconvolve the heterogeneous cellular response to these perturbations, identifying biomarkers and resilient cell populations. This integrated approach strengthens the functional evidence chain from variant to mechanism to therapeutic strategy.
Table 1: Comparison of Functional Evidence Generation Technologies
| Technology | Typical Throughput (Variants Tested) | Key Quantitative Metric | Typical Turnaround Time | Primary ACMG/AMP Application |
|---|---|---|---|---|
| Traditional Site-Directed Mutagenesis | 1-10 | Protein activity (% of wild-type) | Weeks to months | PS3/BS3 (small scale) |
| CRISPR-Cas9 Homology-Directed Repair | 1-10 | Editing efficiency (%) / Phenotypic readout | Months | PS3/BS3 (isogenic models) |
| Base Editing Saturation | 100s - 1,000s | Variant effect score (e.g., growth rate, fluorescence) | Weeks | PS3/BS3 (calibrated, high-throughput) |
| Single-Cell Multi-omics (Perturb-seq) | 10s - 100s (perturbations) x 1000s of cells | Differential expression (log2FC), Pathway enrichment | 1-2 weeks | BS3/PS3 (context-specific effects) |
Table 2: Example Base Editor Efficacy Data (Representative Systems)
| Base Editor System | Target Window | Conversion Type | Typical Efficiency Range (in cells) | Indels Background |
|---|---|---|---|---|
| BE4max (CGBE) | ~5 nt (C•G to T•A) | C•G to T•A | 20-80% | <1% |
| ABE8e (ABE) | ~5 nt (A•T to G•C) | A•T to G•C | 30-90% | <0.5% |
| DdCBE (mitochondrial) | ~15 nt (T•A to C•G) | T•A to C•G | 10-50% | Low |
Experimental Protocols
Protocol 1: Saturation Base Editing for Variant Effect Mapping
Objective: To generate functional scores for all possible single-nucleotide variants in a critical protein domain.
Materials:
- Plasmid library encoding a gRNA tile covering the target domain.
- Appropriate base editor plasmid (e.g., BE4max for C>G>T>A, ABE8e for A>T>G>C).
- Cell line of interest (e.g., HAP1, HEK293T, or iPSC-derived relevant cell type).
- Delivery reagents (e.g., nucleofection kit, lipofectamine).
- Genomic DNA extraction kit.
- Next-generation sequencing (NGS) library prep reagents.
- Phenotypic selection system (e.g., cell survival, FACS for fluorescence).
Methodology:
- Library Design & Cloning: Design oligo library tiling gRNAs with a NNN (or focused) degenerate sequence at the target nucleotide position(s) within the spacer. Clone into a lentiviral gRNA backbone.
- Viral Production & Cell Infection: Produce lentiviral gRNA library. Co-transfect/infect target cells with the gRNA library and base editor plasmid at low MOI to ensure single perturbations.
- Phenotypic Selection & Harvest: Apply relevant selective pressure (e.g., drug treatment, fluorescence sorting) 7-14 days post-editing. Harvest genomic DNA from pre-selection and post-selection populations.
- Amplicon Sequencing & Analysis: PCR amplify the target genomic region from gDNA. Prepare NGS libraries. Sequence to high depth (>500x).
- Variant Effect Scoring: Calculate enrichment/depletion of each variant in the selected vs. initial population using computational pipelines (e.g., MAGeCK, BAGEL2). Generate a functional score (e.g., beta score) for each SNV.
Protocol 2: Single-Cell Multi-omics Assessment of Variant Impact
Objective: To characterize the cell-type-specific transcriptional and epigenetic consequences of a disease-associated variant.
Materials:
- Isogenic cell pairs (wild-type vs. variant) generated via base editing.
- Single-cell multi-ome kit (e.g., 10x Genomics Multiome ATAC + Gene Expression).
- Viable cell suspension buffer.
- Chromatin crosslinking reagents (if required).
- Next-generation sequencer.
- Cell culture reagents.
Methodology:
- Model Generation: Use base editing to introduce the variant of interest into a relevant diploid cell line or iPSC. Isolate and expand clonal lines. Confirm genotype by Sanger sequencing.
- Single-Cell Suspension: Harvest wild-type and variant cells, pool them at equal ratios, and prepare a high-viability (>90%) single-cell suspension in appropriate buffer. For nuclei isolation (for ATAC), use a detergent-based lysis protocol.
- Library Preparation: Following manufacturer's protocol (e.g., 10x Multiome):
- Perform tagmentation on nuclei to capture open chromatin regions.
- Capture mRNA from the same cells using gel bead-in-emulsions (GEMs).
- Generate indexed libraries for both chromatin accessibility and gene expression.
- Sequencing & Data Integration: Sequence libraries on an Illumina platform. Use Cell Ranger ARC or similar pipeline to align reads, call peaks, quantify gene expression, and link modalities per cell.
- Differential Analysis: Identify cell clusters using integrated data. Perform differential expression (DE) and differential accessibility (DA) analysis between wild-type and variant cells within each cluster to pinpoint cell-state-specific regulatory impacts.
Diagrams
Title: Saturation Base Editing Functional Workflow
Title: Single-Cell Multi-ome Variant Impact Analysis
The Scientist's Toolkit
Table 3: Key Research Reagent Solutions for Functional Genomics
| Item | Function / Application | Example Product/System |
|---|---|---|
| Base Editor Plasmids | Enables precise, efficient single-nucleotide editing without DSBs for functional assays. | BE4max (CBE), ABE8e (ABE) (Addgene). |
| Lentiviral gRNA Library | Delivers a pooled set of gRNAs to cells for high-throughput saturation editing screens. | Custom synthesized tile library (Twist Bioscience). |
| Single-Cell Multi-ome Kit | Simultaneously profiles chromatin accessibility (ATAC) and gene expression (GEX) in the same single cell. | 10x Genomics Chromium Single Cell Multiome ATAC + GEX. |
| Viability-Enhanced Cell Dissociation | Generates high-viability single-cell suspensions critical for live-cell assays and scRNA-seq. | STEMCELL Technologies Gentle Cell Dissociation Reagent. |
| Nucleofection Kit | Efficiently delivers base editor RNP complexes or plasmids into hard-to-transfect primary or stem cells. | Lonza 4D-Nucleofector System with specific cell line kits. |
| NGS Amplicon-Seq Kit | Prepares sequencing libraries from PCR-amplified target regions for deep variant quantification. | Illumina DNA Prep with Unique Dual Indexes. |
| Genomic DNA Extraction Kit | High-yield, high-purity gDNA extraction from cultured cells for downstream NGS library prep. | QIAGEN DNeasy Blood & Tissue Kit. |
| Cell Sorting Buffer | Maintains cell viability and integrity during FACS-based phenotypic selection post-editing. | PBS without Ca2+/Mg2+ with 1% BSA or FBS, 1mM EDTA. |
Conclusion
The ACMG/AMP guidelines for functional evidence provide an indispensable, though evolving, scaffold for translating experimental data into clinically meaningful variant classifications. Mastery of the PS3/BS3 criteria requires not only technical proficiency in relevant assays but also a deep understanding of the framework's intent and its inherent complexities. As high-throughput functional genomics and refined recommendations from groups like ClinGen continue to advance, the core principles of rigor, reproducibility, and clinical relevance remain paramount. For researchers and drug developers, rigorous application of these guidelines is critical for building a credible evidence base that can reliably inform diagnostic pipelines, patient stratification, and the development of targeted therapies, ultimately bridging the gap between variant discovery and improved patient care.