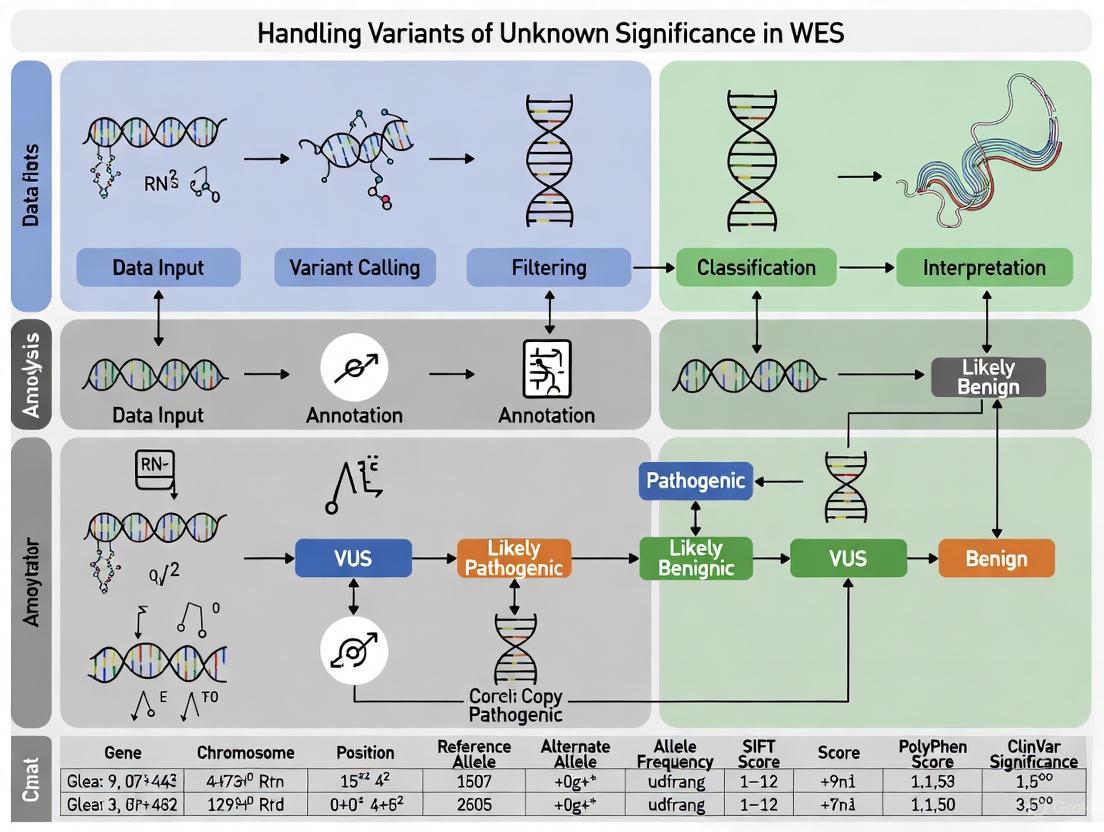
Navigating Variants of Unknown Significance in Whole Exome Sequencing: From Interpretation to Clinical Action and Drug Discovery
This article provides a comprehensive framework for researchers, scientists, and drug development professionals to manage Variants of Unknown Significance (VUS) in Whole Exome Sequencing (WES).
Navigating Variants of Unknown Significance in Whole Exome Sequencing: From Interpretation to Clinical Action and Drug Discovery
Abstract
This article provides a comprehensive framework for researchers, scientists, and drug development professionals to manage Variants of Unknown Significance (VUS) in Whole Exome Sequencing (WES). It covers the foundational challenge of VUS in clinical and research settings, explores advanced methodologies and bioinformatics tools for interpretation, details strategies for troubleshooting and optimizing diagnostic pipelines, and discusses validation frameworks for establishing clinical actionability. By synthesizing current evidence and best practices, this guide aims to enhance diagnostic yield, facilitate the translation of genetic findings into therapeutic insights, and improve patient outcomes in rare diseases and complex disorders.
Understanding VUS: Defining the Challenge in Genomic Medicine and Research
The Nature and Origin of VUS in Whole Exome Sequencing Data
FAQs: Understanding VUS in WES
What is a Variant of Uncertain Significance (VUS)? A VUS is a genetic variant for which the impact on human health cannot be definitively determined as either pathogenic (disease-causing) or benign with the current available evidence [1] [2]. It represents a "grey area" in genetic interpretation, complicating clinical decision-making [3].
Why do VUS results occur so frequently in WES? The frequency of VUS detections increases in proportion to the amount of DNA sequenced [1]. Whole Exome Sequencing analyzes approximately 30 million base-pairs of protein-coding regions, generating vast amounts of variation data [4]. Several factors contribute to high VUS rates:
- Limited population data: VUS are more likely for patients from populations with limited representation in genomic datasets (e.g., those not of European ancestry) [1].
- Expanded gene panels: Large multi-gene panels may include genes with doubtful disease associations, increasing VUS findings [1].
- Evidence scarcity: For many rare variants, sufficient clinical or functional evidence does not yet exist to determine pathogenicity [2].
What is the typical ratio of VUS to pathogenic findings? VUS substantially outnumber pathogenic findings in clinical sequencing [1]. The table below summarizes findings from key studies:
| Scenario | VUS to Pathogenic Variant Ratio | Details |
|---|---|---|
| Breast Cancer Predisposition (Meta-analysis) | 2.5:1 [1] | VUS were 2.5 times more frequent than pathogenic findings |
| 80-Gene Cancer Panel (2,984 patients) | ~3.6:1 [1] | 47.4% patients had VUS vs. 13.3% with pathogenic/likely pathogenic findings |
| Overall Rare Diseases (ClinVar database) | Majority [2] | Most variants categorized as VUS among 94,287 rare disease variants |
What happens to VUS over time? As new evidence emerges, VUS may be reclassified. Current data suggests that 10-15% of reclassified VUS are upgraded to likely pathogenic/pathogenic, while the remainder are downgraded to likely benign/benign [1]. However, reclassification occurs slowly - one study found only 7.7% of unique VUS were resolved over a 10-year period in cancer-related testing [1].
What are the practical consequences of a VUS finding?
- Clinical decision-making: VUS results fail to resolve the clinical question for which testing was performed [1]
- Psychological impact: May cause worry, anxiety, disappointment, or frustration [1]
- Clinical management: Potential for unnecessary procedures or clinical surveillance despite professional guidelines recommending against intervention based solely on VUS [1]
- Healthcare resources: Significant time required for variant interpretation and reinvestigation [1]
Troubleshooting Guide: Addressing VUS Challenges
Challenge: High VUS Rates in Specific Populations
Problem: Patients from underrepresented populations receive VUS results more frequently.
Solution:
- Utilize population-specific databases: Incorporate ancestry-matched population frequency data from sources like gnomAD [2]
- Implement family studies: Perform segregation analysis when possible - lack of segregation with disease provides strong evidence for benign classification [1]
- Advocate for diversity: Support research efforts to expand genomic datasets for underrepresented populations [1] [5]
Challenge: Automated Tools Provide Conflicting VUS Interpretations
Problem: Different computational tools yield varying classifications for the same variant.
Solution:
- Use expert-curated guidelines: Follow ACMG/AMP/ACGS standards for variant interpretation [6] [2] [7]
- Combine multiple evidence sources: Integrate population data, computational predictions, functional data, and clinical findings [1]
- Verify with specialized tools: Implement gene-specific interpretation methods like GAVIN that combine ExAC allele frequencies with SnpEff and CADD predictions [2]
- Maintain human oversight: Automated tools show significant limitations with VUS and still require expert review [6]
Challenge: Determining Clinical Actionability of VUS
Problem: Difficulty deciding whether a VUS should influence patient management.
Solution:
- Apply network-based analysis: Tools like VarClass utilize biological network associations to prioritize VUS with potential clinical significance [3]
- Implement functional studies: Multiplexed Assays for Variant Effect (MAVEs) can generate functional data at scale [5]
- Establish institutional protocols: Develop clear guidelines for when to pursue functional validation based on gene-disease validity and clinical context [5] [7]
Experimental Protocols for VUS Resolution
Protocol 1: Comprehensive Variant Interpretation Workflow
The following diagram illustrates the systematic approach to variant interpretation recommended by major genetics organizations:
Step-by-Step Methodology:
- Variant Identification: Call variants from WES data using standardized pipelines [7]
- Population Frequency Filtering: Compare against population databases (gnomAD) - variants with frequency higher than disease prevalence provide strong evidence for benign classification [1]
- Computational Prediction: Apply in silico tools (CADD, SIFT, PolyPhen) to predict functional impact [2]
- Database Review: Search clinical databases (ClinVar) for existing interpretations [2]
- Functional Evidence Integration: Incorporate data from functional assays when available [5]
- Segregation Analysis: Perform family studies when possible - segregation with disease provides evidence of pathogenicity [1]
- Evidence Synthesis: Apply ACMG/AMP guidelines to integrate all evidence sources [6] [2]
- Final Classification: Assign definitive classification based on cumulative evidence [7]
Protocol 2: Functional Validation of VUS
The diagram below outlines the functional validation pathway for VUS resolution:
Detailed Methodologies:
Mini-gene Splicing Assays (as used in DEPDC5 epilepsy study [8]):
- Construct Design: Clone genomic fragments encompassing the VUS and flanking intronic sequences into splicing reporter vectors
- Transfection: Introduce constructs into relevant cell lines
- RNA Analysis: Isolve RNA, perform RT-PCR, and analyze splicing products via gel electrophoresis or capillary electrophoresis
- Validation: Compare splicing patterns between wild-type and VUS constructs to identify aberrant splicing
Multiplexed Assays for Variant Effect (MAVEs):
- Variant Library Construction: Generate comprehensive variant libraries covering all possible amino acid substitutions in the protein of interest
- Functional Selection: Express variant libraries in appropriate cellular systems and apply functional selection pressure
- Deep Sequencing: Quantify variant abundance before and after selection using next-generation sequencing
- Variant Effect Mapping: Calculate functional scores for each variant based on enrichment/depletion patterns [5]
Research Reagent Solutions for VUS Investigation
| Reagent Category | Specific Examples | Function in VUS Resolution |
|---|---|---|
| Computational Prediction Tools | CADD, SIFT, PolyPhen-2, REVEL [2] | Predict functional impact of amino acid substitutions using evolutionary conservation and structural features |
| Variant Interpretation Platforms | PathoMAN, VIP-HL, VarClass [6] [3] | Automate ACMG guideline application and integrate multiple evidence sources for classification |
| Functional Assay Systems | Mini-gene constructs, MAVE libraries, iPSCs [5] [8] | Provide experimental evidence of variant impact on protein function, splicing, or cellular phenotype |
| Population Databases | gnomAD, dbSNP, 1000 Genomes [2] | Determine variant frequency across populations to assess rarity and potential pathogenicity |
| Clinical Databases | ClinVar, ClinGen, LOVD [2] | Access curated information on variant interpretations and gene-disease relationships |
| Network Analysis Tools | VarClass, GeneMANIA [3] | Prioritize VUS through biological network associations and gene-level relationships |
Quantitative Data on VUS Classification Outcomes
VUS Reclassification Statistics:
| Reclassification Direction | Percentage | Supporting Evidence |
|---|---|---|
| Upgraded to Pathogenic/Likely Pathogenic | 10-15% [1] | Accumulation of pathogenic evidence across multiple evidence types |
| Downgraded to Benign/Likely Benign | 85-90% [1] | Benign population frequency, lack of segregation, functional studies showing no deleterious effect |
| Resolved through functional data | 15-75% [5] | Gene-dependent; higher for well-characterized genes like BRCA1, TP53, PTEN |
Evidence Strengths for Variant Interpretation:
| Evidence Type | Strong Evidence Examples | Moderate/Supporting Examples |
|---|---|---|
| Population Data | Variant prevalence higher than disease prevalence [1] | Absent from population databases or very low frequency |
| Segregation Data | Segregation with disease in multiple families [1] | Segregation in single family with limited members |
| Functional Data | Well-validated assays showing deleterious impact [5] | Experimental data from preliminary or non-validated assays |
| Computational Data | Concordant predictions across multiple algorithms [2] | Single algorithm prediction without additional support |
In genomic medicine, a Variant of Uncertain Significance (VUS) represents a genetic variant for which there is insufficient evidence to classify it as either pathogenic or benign [9]. This classification is not a definitive result but rather an acknowledgment of the current limitations in genomic knowledge. The prevalence of VUS is substantial, affecting between 20% to 40% of patients undergoing genetic testing [10]. In the context of rare diseases alone, an analysis of the ClinVar database revealed that the majority of the 94,287 variants associated with rare diseases were categorized as VUS [2].
The fundamental challenge stems from the gap between our ability to detect genetic variants through advanced sequencing technologies and our understanding of their biological and clinical implications. While next-generation sequencing can identify millions of variants, interpreting their functional impact requires extensive evidence that often does not yet exist [10]. This creates significant challenges for researchers, clinicians, and patients, particularly in the context of Whole Exome Sequencing (WES) research where accurate variant interpretation is crucial for diagnosis and discovery.
VUS Classification and Reporting Frameworks
Standardized Classification Guidelines
Multiple professional organizations have established guidelines for variant classification to standardize interpretation across laboratories:
- ACMG/AMP Guidelines: The American College of Medical Genetics and Genomics (ACMG) and the Association for Molecular Pathology (AMP) use a five-tier classification system: Pathogenic (P), Likely Pathogenic (LP), Variant of Uncertain Significance (VUS), Likely Benign (LB), and Benign (B) [11] [9]. The "likely" categories correspond to >90% confidence in the classification [11].
- Oncology-Specific Frameworks: For somatic variants in cancer, the AMP/ASCO/CAP guidelines established a four-tier system (Tier I-IV), while more recently, ClinGen/CGC/VICC released specialized guidelines for classifying oncogenicity [11].
The VUS Reporting Dilemma
A central debate in clinical genetics involves whether and when to report VUS findings. Reporting practices vary significantly across contexts:
- Prenatal Settings: A 2025 study of prenatal exome sequencing found that VUS were reported in exceptional cases after stringent selection, with only a minority subsequently reclassified as (likely) pathogenic [12]. This careful approach reflects the time-sensitive nature of prenatal decisions.
- General Practice: Experts generally recommend against using VUS in clinical decision-making, emphasizing that patient management should be based on personal and family history rather than the presence of a VUS alone [9]. Multidisciplinary review is considered essential for VUS management [12].
Quantitative Landscape of VUS in Genomic Databases
Table: VUS Distribution and Reclassification Evidence
| Database/Context | VUS Prevalence | Reclassification Rate | Key Evidence |
|---|---|---|---|
| General Genetic Testing | 20-40% of patients receive a VUS [10] | Not specified | Based on clinical testing cohorts |
| Rare Diseases (ClinVar) | Majority of 94,287 rare disease variants [2] | Not specified | Database analysis as of October 2024 |
| Prenatal WES | 31 VUS reported in 27 pregnancies [12] | 5 of 7 reclassified VUS upgraded to (likely) pathogenic [12] | Retrospective review in Dutch academic hospitals |
| MAVE-Informed Reclassification | Not applicable | 55% (937 of 1,711 VUS) reclassified [10] | Analysis across twelve published studies |
Technical Challenges in VUS Interpretation
Evidence Assessment and Integration
VUS interpretation requires synthesizing multiple types of evidence, each with limitations:
- Population Frequency Data: Databases like gnomAD, dbSNP, and 1000 Genomes provide allele frequency information. Variants too common in general populations are unlikely to cause rare diseases, but absence from databases doesn't guarantee pathogenicity [11] [2].
- Computational Predictions: In silico tools (SIFT, CADD, GERP) predict variant impact using evolutionary conservation and protein structure models, but their predictions are not definitive for clinical classification [2] [10].
- Functional Evidence: Experimental data from biochemical assays or cell-based models can provide direct evidence of functional impact but are often unavailable for specific variants [11] [10].
- Segregation Analysis: Co-segregation of a variant with disease in families provides strong evidence, but is often limited by family size, availability, and late-onset conditions [9].
VUS in Specialized Contexts
- Tumor Suppressors vs. Oncogenes: These gene categories exhibit fundamentally different biological behaviors that affect VUS interpretation. Tumor suppressors typically require loss-of-function variants, while oncogenes are typically activated by gain-of-function variants [11].
- Non-Coding Variants: Variants in regulatory regions present particular challenges as their effects are often quantitative and poorly understood without specialized functional studies [2].
- Different Technical Platforms: Variants may be annotated differently depending on sequencing methodology (e.g., tissue vs. liquid biopsies, with or without matched normal samples), complicating cross-platform comparisons [11].
Research Approaches for VUS Resolution
Advanced Analytical Frameworks
Large-scale statistical approaches are increasingly powerful for VUS resolution:
- Gene Burden Testing: The geneBurdenRD framework, applied to the 100,000 Genomes Project, identified 141 new disease-gene associations by testing enrichment of rare protein-coding variants in cases versus controls [13]. This approach can implicate genes where VUS cluster in specific patient populations.
- Multidimensional Assessment: A holistic approach evaluates variants across multiple biological axes, including splicing impact, mutation interactions, copy number thresholds, and genome-wide signatures [11].
Experimental Solutions: Multiplexed Assays of Variant Effect (MAVE)
MAVEs (also called Deep Mutational Scanning) represent a transformative approach for generating functional data at scale:
- Methodology: These assays systematically generate thousands of missense variants in a gene, introduce them into functional assays, and measure their impact using high-throughput approaches [10].
- Impact: MAVEs have already enabled reclassification of 55% of VUS (937 of 1,711) across twelve studies [10]. The MaveDB database currently contains approximately 2,000 datasets comprising ~7 million variant effect measurements [10].
- Integration with Prediction Tools: MAVE data can refine computational predictors by providing experimental training data, creating a virtuous cycle of improved prediction and classification [10].
Computational and Filtration Strategies
Table: Research Reagent Solutions for VUS Interpretation
| Tool/Category | Primary Function | Application in VUS Resolution |
|---|---|---|
| In Silico Predictors (SIFT, CADD, GERP) [2] | Predict variant impact using evolutionary and structural features | Preliminary variant prioritization; evidence integration |
| Gene-Specific Tools (GAVIN) [2] | Combines gene-specific data with in silico predictions | Context-specific variant interpretation |
| Custom Filtration Pipelines [14] | Population-specific variant filtration | Reduce candidate variants from ~600,000 to 5-15 per case |
| Mathematical Models & ML [2] | Simulate biological outcomes and pattern recognition | Handle complex data relationships for classification |
| Variant Databases (ClinVar, gnomAD, dbSNP) [11] [2] | Aggregate population frequency and clinical assertions | Evidence gathering for classification |
Targeted filtration strategies can dramatically improve VUS interpretation efficiency. In consanguineous populations, focusing on autosomal recessive homozygous variants reduced the number of candidate variants from hundreds of thousands to 5-15 per case while maintaining an 82% detection rate for disease-causing variants [14]. This approach completed analysis in approximately 45 minutes per case compared to 5 hours without filtration [14].
FAQs: Troubleshooting Common VUS Challenges
Q1: How should I handle a VUS result in my research when trying to establish a new gene-disease association?
A: Begin by gathering all available evidence across multiple axes: search population databases for frequency data, conduct literature reviews for functional characterization, and use computational predictors for preliminary impact assessment [11] [2]. For stronger evidence, consider family segregation studies if possible [9], and explore whether the gene shows constraint against variation in population databases [13]. Large-scale gene burden testing in cohorts like the 100,000 Genomes Project can provide statistical evidence for novel disease-gene associations [13].
Q2: What is the most efficient workflow for triaging numerous VUS findings in a WES study?
A: Implement a stepwise filtration strategy:
- Start with quality control and population frequency filtering using databases like gnomAD [11] [14]
- Apply inheritance pattern filters based on your patient population and phenotype [14]
- Use impact prediction tools to prioritize loss-of-function and deleterious missense variants [13] [14]
- Consider gene-level characteristics such as constraint metrics (gnomAD o/e scores) and biological relevance to the phenotype [13]
- For remaining candidates, proceed to experimental validation or segregation analysis [9]
Q3: How reliable are computational predictions for VUS classification, and which tools should I use?
A: Computational predictions provide supporting evidence but should not be used alone for definitive classification [10]. Current tools have limitations but are improving, especially with new AI approaches [10]. Use multiple complementary tools (e.g., SIFT, CADD, GERP) and consider gene-specific classifiers like GAVIN when available [2]. Remember that predictions are more reliable for some gene categories than others, and functional validation remains the gold standard [11] [10].
Q4: What emerging technologies show the most promise for resolving VUS on a large scale?
A: Multiplexed Assays of Variant Effect (MAVEs) currently represent the most promising approach for large-scale VUS resolution [10]. These high-throughput functional assays can test thousands of variants simultaneously, generating functional data that has already reclassified 55% of VUS in studies to date [10]. Additionally, machine learning models trained on expanding genomic datasets are improving prediction accuracy, and large-scale statistical gene burden testing in biobanks is identifying new disease-gene associations [2] [13].
Q5: How should I handle a situation where different classification systems provide conflicting evidence for a VUS?
A: Conflicting interpretations are not uncommon and reflect the evolving nature of genomic evidence. In these situations:
- Carefully evaluate the quality and source of each evidence item, giving more weight to functional studies and large family segregation data over computational predictions alone [11] [10]
- Consider the context of the evidence - some may be more relevant to specific populations or disease mechanisms [11]
- Consult multiple databases and recent literature, as classifications can change rapidly with new evidence [9]
- When possible, generate additional evidence through functional studies or family testing to resolve the conflict [9] [10]
- Document all evidence and the rationale for your final classification decision [9]
The VUS challenge represents both a significant obstacle and an opportunity for advancement in genomic medicine. Current research approaches, including large-scale statistical analyses, multiplexed functional assays, and improved computational predictions, are steadily transforming VUS interpretation. The research community is working toward the National Human Genome Research Institute's goal of solving the VUS problem by 2030 [10], though substantial challenges remain, particularly for non-coding variants and genes with complex biological roles.
For researchers navigating VUS in WES studies, success depends on implementing systematic filtration strategies, leveraging growing public datasets, participating in data sharing initiatives, and maintaining cautious interpretation of results until sufficient evidence accumulates. As genomic technologies continue to evolve and collaborative efforts expand, the current gray zone of VUS will progressively give way to more definitive classifications that enhance both diagnosis and discovery.
In clinical whole exome sequencing (WES), understanding the distinction between different types of findings is crucial for effective research and patient communication.
- Primary Findings: Results relevant to the initial diagnostic question for which sequencing was ordered [15].
- Incidental Findings (IFs): Pathogenic alterations discovered unintentionally in genes unrelated to the diagnostic indication. Some guidelines use the term "unsolicited findings" (UFs) for variants that are found unintentionally, as opposed to actively sought [16] [17].
- Secondary Findings (SFs): Pathogenic alterations in genes not related to the diagnostic indication but that are deliberately sought and analyzed according to professional guidelines [15] [16].
- Variants of Uncertain Significance (VUS): Genetic variants for which available evidence is insufficient to classify them as clearly pathogenic or benign [2].
? Frequently Asked Questions (FAQs)
What exactly is a Variant of Uncertain Significance (VUS)?
A VUS is a genetic change identified through sequencing where current scientific knowledge cannot determine whether it causes disease, is benign, or has any health impact. VUS represent a significant challenge in genomics, comprising a substantial portion of classified variants. Research indicates they are among the most common variant classifications in databases like ClinVar [2]. They should not be used for clinical decision-making until more evidence becomes available [18].
What is the difference between incidental and secondary findings?
The key distinction lies in how they are discovered:
- Incidental/Unsolicited Findings: Discovered unintentionally during analysis [16] [17]
- Secondary Findings: Actively sought through deliberate analysis of specific genes based on professional guidelines [15] [16]
International policy documents vary in their terminology and approach to these findings, with some advocating for a more restrictive approach to secondary findings [16].
How common are unsolicited/incidental findings in WES?
Large-scale studies indicate the overall frequency of medically actionable UFs in clinical WES is relatively low. One study of 16,482 individuals found:
| Finding Type | Frequency | Rate |
|---|---|---|
| Any UF | 95/16,482 | 0.58% |
| Medically actionable UF | 86/16,482 | 0.52% |
Source: Lessons learned from unsolicited findings in clinical exome sequencing of 16,482 individuals [17]
The same study found significant differences in UF rates based on analysis strategy:
- Restricted disease-gene panels: 0.03% UF rate
- Whole-exome/Mendeliome analysis: 1.03% UF rate [17]
Which criteria determine if an incidental finding should be reported?
Two main criteria guide reporting decisions [16]:
- Clinical significance: Pathogenicity and medical actionability
- Patient-related factors: Patient preference to know, patient characteristics, and age
Professional consensus emphasizes that medically actionable findings should be disclosed when interventions can change disease course or allow prevention [17]. The ACMG recommends reporting mutations in specific genes associated with conditions where individuals remain asymptomatic for long periods and preventive measures/treatments are available [15].
How should I handle VUS in my research reporting?
Best practices include:
- Clearly label all VUS as having uncertain significance
- Do not use VUS for clinical decision-making [18]
- Implement periodic re-evaluation processes as knowledge evolves
- Report VUS in the context of the specific research question
- Acknowledge limitations in variant interpretation
? Troubleshooting Common Scenarios
Scenario: Managing Patient/Subject Anxiety About VUS
Challenge: Research participants express anxiety about receiving a VUS result.
Solution Framework:
- Emphasize that VUS are common findings with unknown implications
- Explain that most VUS are eventually reclassified as benign
- Provide clear timeline for re-evaluation
- Offer resources for genetic counseling support
Scenario: Deciding Whether to Report an Incidental Finding
Challenge: Determining whether a discovered incidental finding meets reporting thresholds.
Solution Framework:
- Apply the clinical significance criteria (pathogenicity, actionability)
- Consider patient/subject preferences and consent agreements
- Consult professional guidelines (ACMG, ESHG, etc.)
- Document the decision-making process thoroughly
- When in doubt, seek multidisciplinary consultation
? Experimental Protocols
Protocol 1: Systematic Approach to Variant Classification
Objective: Standardize variant interpretation across research team
Methodology:
- Variant Identification: Filter variants from WES data using quality metrics
- Database Annotation: Cross-reference with:
- Population databases (gnomAD)
- Disease-specific databases (ClinVar)
- In silico prediction tools (SIFT, PolyPhen-2, CADD)
- Evidence Collection: Gather data on:
- Population frequency
- Computational predictions
- Functional data
- Segregation data
- Literature evidence
- ACMG/AMP Guidelines Application: Classify using standardized criteria [2]
- Documentation: Record classification evidence and rationale
Expected Outcomes: Consistent variant classification across research cohort
Protocol 2: Incidentalfinding Evaluation Workflow
Objective: Ensure consistent handling of potential incidental findings
Methodology:
- Initial Identification: Flag pathogenic/likely pathogenic variants in genes unrelated to primary indication
- Clinical Actionability Assessment: Evaluate whether:
- Effective interventions exist
- Condition has significant health implications
- Early detection improves outcomes
- Consent Verification: Review participant preferences regarding result return
- Multidisciplinary Review: Discuss findings with ethics team, clinicians, researchers
- Decision Documentation: Record reporting decision and rationale
? Research Reagent Solutions
| Reagent/Resource | Function in VUS/IF Research |
|---|---|
| ClinVar Database | Repository of clinically relevant variants with interpretations [2] |
| ACMG/AMP Guidelines | Standardized framework for variant pathogenicity classification [2] |
| Genome Aggregation Database (gnomAD) | Population frequency data for variant filtering [2] |
| In silico Prediction Tools (SIFT, CADD) | Computational prediction of variant impact [2] |
| HGVS Nomenclature Standards | Standardized terminology for clear variant communication [19] |
? Workflow Visualization
Variant Interpretation and Reporting Workflow: This diagram illustrates the pathway from initial WES data generation through to reporting decisions for primary, secondary, and incidental findings, highlighting key decision points in the process.
Incidental Finding Rates by Analysis Type
| Analysis Approach | UF Rate | Study Population |
|---|---|---|
| Restricted disease-gene panels | 0.03% | 16,482 individuals [17] |
| Whole-exome/Mendeliome analysis | 1.03% | 16,482 individuals [17] |
| Overall WES cohort | 0.58% | 16,482 individuals [17] |
UF Characteristics from Large Cohort Study
| UF Characteristic | Percentage | Notes |
|---|---|---|
| In ACMG59 genes | 61% | [17] |
| Beyond ACMG59 list | 39% | Categories include disorders similar to ACMG59 (25%), modifiable disorders (7%), reproductive options (2%), pharmacogenetic (5%) [17] |
| Medically actionable | 91% | 86/95 UFs disclosed due to medical actionability [17] |
This technical support resource provides foundational information for researchers navigating the complex landscape of VUS and incidental findings in WES research. Regular consultation with current guidelines and multidisciplinary collaboration remain essential for ethical genomic research practice.
Troubleshooting Guides
Guide 1: Troubleshooting VUS Interpretation in WES Data
Problem: A Variant of Uncertain Significance (VUS) is identified in a gene relevant to your disease model, creating uncertainty for downstream research or validation experiments.
Background: A VUS is a genetic variant for which there is insufficient evidence to classify it as pathogenic or benign [9]. This is a classification of exclusion for alterations that lack key scientific evidence or present conflicting data [11]. In the context of WES research, it is crucial to remember that, per ACMG/AMP guidelines, a VUS should not be used for clinical decision-making [9] [20].
Investigation and Solution:
| Step | Investigation Action | Common Findings & Solutions |
|---|---|---|
| 1 | Verify Data Quality | Finding: Apparent variant is a sequencing artifact. Solution: Check sequencing depth and quality scores; confirm variant with Sanger sequencing if needed. |
| 2 | Interrogate Population Databases | Finding: Variant has a high allele frequency in gnomAD or 1000 Genomes. Solution: If frequency is higher than the disease prevalence, it is likely benign. |
| 3 | Query Clinical & Variant Databases | Finding: Variant is listed in ClinVar with conflicting interpretations. Solution: Weigh the evidence from submitters; check if your functional assay can resolve the conflict. |
| 4 | Utilize In-Silico Prediction Tools | Finding: Tools like SIFT, CADD, and GERP provide conflicting scores. Solution: Use meta-predictors or gene-specific calibration (e.g., GAVIN) for more accurate impact inference [2]. |
| 5 | Investigate Gene & Variant Function | Finding: The variant's effect on protein function (e.g., missense, nonsense) is unknown. Solution: Propose a functional study (e.g., cell-based assay) to characterize the variant's biochemical effect. |
Guide 2: Resolving VUS Reclassification Through Data Sharing
Problem: Your research has generated data that could help reclassify a VUS, but the path to formal reclassification is unclear.
Background: VUS reclassification is a collaborative process between the laboratory and the clinician/researcher [9]. Over time, as more evidence becomes available, variants can be reclassified. A recent study found that 91% of reclassified variants were downgraded to "benign," while only 9% were upgraded to "pathogenic" [20]. Data sharing is underscored as a critical component for facilitating this process and fostering equitable genomic medicine [21].
Investigation and Solution:
| Step | Investigation Action | Common Findings & Solutions |
|---|---|---|
| 1 | Collate All Available Evidence | Finding: Data is scattered across lab notes, published papers, and internal databases. Solution: Systematically gather all data, including functional assay results, case reports, and segregation data. |
| 2 | Submit Data to Public Databases | Finding: Your functional data is the missing evidence needed for reclassification. Solution: Submit all validated evidence to public repositories like ClinVar. Transparency in reporting is extremely important for the genetic community [9]. |
| 3 | Engage in Collaborative Consortia | Finding: Your single case is suggestive but not definitive. Solution: Share your findings with groups like ClinGen, VICC, or disease-specific research networks to find collaborating families or functional labs [21] [11]. |
| 4 | Contact the Original Testing Lab | Finding: The diagnostic lab that issued the original VUS report is unaware of your new data. Solution: formally present your evidence to the lab; they have the curation expertise to initiate a reclassification. |
Frequently Asked Questions (FAQs)
FAQ 1: VUS Fundamentals
Q1: What exactly is a VUS, and why is it so common in WES? A: A VUS is a genetic variant for which the available evidence is insufficient to determine whether it is disease-causing (pathogenic) or harmless (benign) [9]. It is common in WES because sequencing the ~20,000 genes in the exome reveals many rare variants that science has not yet had the chance to study in enough individuals to determine their clinical significance [2] [20].
Q2: Does a VUS result mean my research participant has an elevated disease risk? A: No. A VUS should not be used for clinical decision-making [9] [20]. All clinical and research management decisions should be based on personal and family history, not on the presence of the VUS [9].
Q3: Are all VUSs created equal? A: No. Many clinical laboratories now subclassify VUS into categories such as VUS-high (evidence leans towards pathogenic), VUS-mid (equivocal or no evidence), and VUS-low (evidence leans towards benign) [22]. This helps prioritize variants for further investigation.
FAQ 2: Reclassification Processes
Q4: How often are VUSs reclassified, and in what direction? A: Reclassification is an ongoing process. Data from four clinical laboratories shows distinct reclassification rates for different VUS subclasses [22]. A study from MD Anderson found that when reclassification occurs, about 91% of the time a VUS is downgraded to "benign," and only 9% of the time is it upgraded to "pathogenic" [20].
Q5: What is the most powerful evidence for reclassifying a VUS? A: The evidence is cumulative. Key types include:
- Genetic Evidence: Finding the same variant in multiple unrelated individuals with the same disease (case-control data) [9].
- Segregation Data: Demonstrating the variant tracks with the disease in a family [9].
- Functional Evidence: Experimental data from biochemical or cell-based assays showing a deleterious effect [11] [2].
- Population Data: Establishing that the variant is too common in healthy populations to be causative for a rare disease [11].
Q6: What is my role as a researcher in VUS reclassification? A: You are a critical part of the ecosystem. Your role is to:
- Share Data: Publish and submit your findings (e.g., functional data, case reports) to public databases like ClinVar [21] [9].
- Collaborate: Partner with clinical labs and research consortia to combine data on specific variants or genes [9].
- Investigate: Use research techniques to generate new biological evidence for VUS in your field of study.
Experimental Protocols & Workflows
Protocol 1: A Methodological Framework for VUS Reclassification Analysis
This protocol outlines the steps for systematically gathering evidence to support VUS reclassification, synthesizing guidelines from ACMG/AMP and recent laboratory practices [11] [22] [2].
1. Evidence Collection
- Population Frequency: Query large-scale population databases (e.g., gnomAD). A frequency higher than the disease prevalence is strong evidence for benign impact [11] [2].
- Computational Predictions: Run a suite of in-silico tools (e.g., SIFT, PolyPhen-2, CADD, REVEL) to predict the variant's effect on protein function. Use gene- or disease-specific calibrated tools where available [2].
- Literature and Database Mining: Conduct a comprehensive review of ClinVar, PubMed, and gene-specific databases. Look for functional studies, case reports, and existing classifications [11].
- Segregation Analysis: If possible, perform family studies to see if the variant co-segregates with the disease phenotype in affected relatives [9].
- Functional Studies: Design and execute in vitro or in vivo experiments (e.g., assays of protein function, splicing, or cell growth) to directly test the variant's biological impact [11].
2. Evidence Integration and Curation
- Weigh all collected evidence according to standardized guidelines like the ACMG/AMP criteria [21] [11].
- Resolve conflicting evidence. Strong evidence on one side can outweigh multiple weaker pieces of evidence on the other.
- Assign a final classification (Pathogenic, Likely Pathogenic, VUS, Likely Benign, Benign) based on the totality of evidence. For VUS, a subclass (High, Mid, Low) should be assigned based on the strength and direction of the available evidence [22].
3. Data Sharing and Reporting
- Submit the new classification and all supporting evidence to public databases such as ClinVar.
- If the VUS was found in a clinical test, report the new evidence to the diagnostic laboratory that issued the original report so they can issue a revised finding [20].
VUS Investigation Workflow: This diagram outlines the systematic process for resolving a VUS, from initial evidence gathering to final data sharing.
Visualizing VUS Subclassification and Reclassification
The following diagram and table summarize the VUS subclassification system used by leading laboratories and the observed reclassification outcomes, based on a recent multi-laboratory study [22].
VUS Subclassification Spectrum: This continuum shows the relationship between variant classifications. Dashed arrows indicate the most common reclassification pathways for each VUS subclass.
| VUS Subclass | Typical Evidence Level | Likely Reclassification Direction | Notes for Researchers |
|---|---|---|---|
| VUS-High | Evidence leans pathogenic but is insufficient. | More likely to be upgraded to Pathogenic/Likely Pathogenic [22]. | Highest priority for functional validation. Strong candidate for causative variant. |
| VUS-Mid | Equivocal, conflicting, or absent evidence. | Can be reclassified in either direction [22]. | Target for gathering new evidence (e.g., more cases, functional data). |
| VUS-Low | Evidence leans benign but is insufficient. | More likely to be downgraded to Benign/Likely Benign [22]. | Low priority for further investigation. Often filtered out in research analyses. |
Table 1: VUS Subclassification and Reclassification Trends. This table summarizes the characteristics and expected outcomes for the three VUS subclasses.
The Scientist's Toolkit: Research Reagent Solutions
| Tool / Reagent Category | Function in VUS Resolution | Key Examples |
|---|---|---|
| Public Population Databases | Determine if a variant is too common in healthy populations to be disease-causing. | gnomAD [11] [2], 1000 Genomes Project [11] [2], dbSNP [2] |
| Clinical & Variant Databases | Provide curated information on variant pathogenicity and interpretations from other labs. | ClinVar [2], dbVar [2] |
| In-Silico Prediction Tools | Computationally predict the functional impact of a variant on the protein or gene. | SIFT [2], CADD (Combined Annotation Dependent Depletion) [2], GERP (Genomic Evolutionary Rate Profiling) [2] |
| Gene-Specific Curation Tools | Provide gene-specific calibration for variant interpretation, improving accuracy. | GAVIN (Gene-Aware Variant Interpretation) [2] |
| Functional Study Reagents | Experimentally test the biochemical consequences of a variant in a model system. | Site-Directed Mutagenesis Kits, cDNA clones, Antibodies for protein expression/ localization, Cell-based reporter assays, CRISPR-Cas9 tools for isogenic cell line creation |
| Data Sharing Platforms | Disseminate new evidence to the community to aid in collective reclassification efforts. | ClinVar, PubMed, Gene-specific databases |
Advanced Methodologies for VUS Interpretation and Prioritization
Troubleshooting Common Variant Calling Pipeline Issues
How do I resolve low concordance with GIAB benchmark datasets?
Low concordance with Genome in a Bottle (GIAB) benchmarks often originates from suboptimal tool selection or parameter configuration. A systematic evaluation of variant callers reveals significant performance differences [23].
Table: Variant Caller Performance Benchmark on GIAB Datasets [23] [24]
| Variant Caller | SNV Precision (%) | SNV Recall (%) | Indel Precision (%) | Indel Recall (%) | Key Characteristics |
|---|---|---|---|---|---|
| DeepVariant | >99 | >99 | >96 | >96 | Highest overall performance and robustness; deep learning-based |
| DRAGEN Enrichment | >99 | >99 | >96 | >96 | High precision/recall; commercial solution |
| Strelka2 | >98 | >98 | >94 | >94 | Well-established; consistent performance |
| GATK HaplotypeCaller | >97 | >97 | >92 | >92 | Traditional gold standard; requires filtering |
| Clair3 | >98 | >98 | >95 | >95 | Excellent for long-read data; fast processing |
| FreeBayes | >95 | >95 | >90 | >90 | Sensitivity to indels; higher false positives |
Solution: Implement a multi-caller approach. Start with DeepVariant or Strelka2 for primary analysis, using GATK HaplotypeCaller for validation. For commercial environments, DRAGEN provides excellent performance with computational efficiency [23] [24].
How can I address excessive false positive variant calls?
Excessive false positives frequently stem from inadequate read alignment, insufficient quality filtering, or PCR artifacts. Systematic benchmarking identifies several contributing factors [23] [25].
Troubleshooting Steps:
- Verify alignment quality: Check mapping quality scores (MAPQ) in BAM files. Remap with BWA-MEM if Bowtie2 was used, as Bowtie2 demonstrates significantly worse performance in variant calling benchmarks [23].
- Implement duplicate marking: Use Picard MarkDuplicates or Sambamba to remove PCR duplicates, which typically represent 5-15% of sequencing reads [25].
- Apply base quality score recalibration (BQSR): Utilize GATK's BQSR to correct for systematic errors in base quality scores [25].
- Implement rigorous filtering: For GATK calls, use Variant Quality Score Recalibration (VQSR) with population frequency data from gnomAD [25].
Table: Recommended Filtering Thresholds for Germline Variants [25]
| Filter Type | SNV Threshold | Indel Threshold | Rationale |
|---|---|---|---|
| Quality (QUAL) | >30 | >30 | Basic call quality threshold |
| Depth (DP) | >10 | >15 | Minimum read support |
| Mapping Quality (MQ) | >40 | >40 | Confidence in read placement |
| Strand Bias (FS) | <60 | <200 | Fisher's exact test for bias |
| Allele Balance (AB) | 0.25-0.75 | 0.25-0.75 | Heterozygous ratio expectation |
How do I optimize pipeline runtime and computational efficiency?
Bioinformatics pipelines can become computationally intensive, particularly with deep learning-based variant callers [23] [26].
Optimization Strategies:
- Tool Selection: DNAscope and Clair3 offer favorable speed-accuracy tradeoffs. DNAscope achieves significant reduction in computational cost compared to DeepVariant and GATK while maintaining high accuracy [26].
- Workflow Management: Implement Nextflow or Snakemake for parallel processing and resource optimization [27].
- Resource Allocation: For DeepVariant, utilize GPU acceleration where available. DNAscope efficiently leverages multi-threaded CPU processing without requiring GPU resources [26].
- Data Subsampling: For pipeline testing and development, use subsets (100K reads) rather than full datasets to accelerate iteration cycles [28].
Filtering Strategy Troubleshooting
How can I efficiently prioritize candidate variants from thousands of calls?
Whole exome sequencing typically identifies 20,000-30,000 variants per sample, making prioritization essential [29]. A stratified filtering approach dramatically improves efficiency.
Variant Prioritization Workflow for Efficient Candidate Identification
Implementation Protocol:
Initial Quality Filtering [25]:
- Apply quality thresholds: QUAL > 30, DP > 10, MQ > 40
- Remove variants failing strand bias filters
Population Frequency Filtering:
- Filter against gnomAD, 1000 Genomes, and population-specific databases
- Exclude variants with allele frequency > disease prevalence
Inheritance Pattern Application [14]:
- For consanguineous populations: prioritize homozygous variants
- For dominant disorders: focus on heterozygous variants
- For trio analysis: leverage segregation patterns
Variant Impact Assessment:
- Prioritize loss-of-function variants (stop-gain, frameshift, splice-site)
- Consider missense variants with high pathogenicity predictions
Phenotype Integration:
- Annotate with Human Phenotype Ontology (HPO) terms
- Match against known gene-disease associations (OMIM, ClinVar)
This approach can narrow candidates to 5-15 variants per case while maintaining high detection rates, reducing analysis time from 5 hours to approximately 45 minutes [14].
How should I handle Variants of Uncertain Significance (VUS) in clinical reporting?
VUS classification presents significant challenges in clinical interpretation and communication [30].
VUS Management Framework:
Evidence Collection:
- Gather segregation data within families
- Search for same variant in unrelated affected individuals
- Review functional studies in literature
- Assess conservation and computational predictions
Internal VUS Subclassification [30]:
- "VUS-high suspicion": Multiple supporting evidence lines
- "VUS-low suspicion": Minimal supporting evidence
- Note: These subclasses are for internal prioritization only
Reporting and Communication:
- Clearly state that VUS should not be used for predictive testing
- Explain evidence supporting and against pathogenicity
- Outline plan for potential reclassification
- Discuss implications for family members
Critical Consideration: VUS results require careful pre-test counseling and post-test communication to manage patient expectations and prevent clinical decision-making based on uncertain information [30].
Pipeline Implementation FAQs
What are the essential components of a robust variant calling pipeline?
Table: Research Reagent Solutions for Variant Calling Pipelines [28] [25]
| Component | Recommended Tools | Function | Key Considerations |
|---|---|---|---|
| Alignment | BWA-MEM, Minimap2 | Map reads to reference genome | BWA-MEM outperforms Bowtie2 for variant calling [23] |
| Duplicate Marking | Picard, Sambamba | Identify PCR duplicates | Essential for removing technical artifacts |
| Variant Calling | DeepVariant, GATK, Strelka2 | Detect SNVs/indels | Multi-caller improves sensitivity [23] |
| Variant Annotation | VEP, SnpEff | Predict functional impact | Critical for prioritization |
| Quality Control | FastQC, MultiQC | Assess data quality | Identify sequencing issues early |
| Workflow Management | Nextflow, Snakemake | Pipeline orchestration | Ensures reproducibility |
How do I validate my variant calling pipeline performance?
Benchmarking Protocol:
Utilize GIAB Reference Materials:
Performance Metric Calculation:
- Precision: TP/(TP+FP) - measures false positive rate
- Recall: TP/(TP+FN) - measures sensitivity
- F-score: Harmonic mean of precision and recall
Stratified Performance Analysis:
- Evaluate performance in different genomic contexts (high/low GC, mappability)
- Assess variant type-specific accuracy (SNVs vs. indels)
- Check performance in clinically relevant genes
Ongoing Monitoring:
- Include control samples in each sequencing batch
- Track performance metrics over time
- Investigate significant deviations immediately
What strategies improve detection of variants in challenging genomic regions?
Technical Solutions:
Leverage AI-Based Callers: DeepVariant and Clair3 demonstrate improved performance in repetitive regions and complex variant types due to their pattern recognition capabilities [26].
Utilize Multi-Platform Data: Integrate short-read and long-read sequencing where possible. Tools like Medaka specialize in Oxford Nanopore data, while DeepVariant supports multiple sequencing technologies [26].
Implement Region-Aware Filtering: Adjust filtering thresholds for known problematic regions (e.g., reduce strand bias thresholds in GC-rich regions).
Leverage Family Information: For trio sequencing, tools like DeepTrio incorporate familial relationships to improve variant calling accuracy, particularly for de novo mutations and in challenging regions [26].
Advanced Filtering and Interpretation FAQs
How can I optimize my filtering strategy for specific populations?
Population-specific considerations significantly impact filtering efficacy [14].
Consanguineous Population Protocol [14]:
Primary Filter - Homozygous Variants:
- Focus on variants with high homozygous alternate allele frequency
- Prioritize variants in autozygous regions (runs of homozygosity)
- This approach identifies ~82% of disease-causing variants in consanguineous populations
Secondary Filter - Compound Heterozygotes:
- Identify genes with multiple rare heterozygous variants
- Verify variants are in trans (phasing)
Population Frequency Database Selection:
- Use population-specific frequency data when available
- Adjust allele frequency thresholds based on disease prevalence
Outbred Population Protocol:
Broad Inheritance Model Consideration:
- Simultaneously evaluate autosomal dominant, recessive, and X-linked models
- Prioritize de novo variants for sporadic cases
Burden Testing:
- For cohort analysis, implement gene-based burden testing
- Identify genes enriched for rare variants in affected individuals
What are the best practices for clinical reporting of filtered variants?
Comprehensive Reporting Framework [7]:
Variant Classification:
- Follow ACMG/AMP guidelines for pathogenicity assessment
- Document evidence supporting classification
- Clearly distinguish between definitive and uncertain findings
Clinical Correlation:
- Match variant to patient phenotype using HPO terms
- Assess genotype-phenotype specificity
- Consider differential diagnoses
Reporting Structure:
- Primary findings: Variants explaining the indication for testing
- Secondary findings: Medically actionable incidental findings (if consented)
- Clearly separate definitive results from VUS
Family Communication Guidance:
- Provide specific recommendations for family member testing
- Include implications for reproductive decision-making
- Offer resources for genetic counseling
This troubleshooting guide provides a foundation for optimizing variant calling and filtering strategies in WES research. Regular benchmarking against gold standard datasets and continuous refinement based on emerging tools and technologies will ensure ongoing pipeline improvement and clinical reliability.
Within Whole Exome Sequencing (WES) research, a significant proportion of analyzed genetic variants are classified as Variants of Unknown Significance (VUS) [4]. A VUS is a change in a gene where the effect on the gene's function and its link to disease is not yet known [18]. Interpreting these VUS is one of the major unsolved challenges in clinical WES, as it is difficult to determine whether they are the cause of a patient's symptoms [4]. A powerful strategy to address this challenge is to incorporate detailed phenotypic data—the observable clinical symptoms and characteristics of a patient.
The Human Phenotype Ontology (HPO) provides a standardized, structured vocabulary for describing human phenotypic abnormalities [31]. By annotating diseases and patient symptoms with HPO terms, researchers can computationally analyze phenotypic similarities. For a VUS discovered via WES, demonstrating that the patient's HPO-annotated symptoms show significant similarity to the symptoms of other patients or known diseases linked to the same gene provides crucial, independent evidence to support the variant's potential pathogenicity [32]. This guide provides technical support for implementing and troubleshooting HPO-based symptom similarity scoring in a research setting.
FAQs: Core Concepts for Researchers
Q1: What is the HPO and how does its structure enable similarity calculation?
The HPO is a structured, controlled vocabulary of over 12,000 terms representing individual phenotypic anomalies [31] [33]. Its terms are organized as a directed acyclic graph, where each term can have multiple parent terms. This "is a" relationship creates a hierarchy from general to specific terms. For example, the term "Atrial septal defect" is a child of the more general term "Abnormality of the cardiac septa" [31]. This structure allows for flexible searches and similarity measurements based on shared ancestry between terms.
Q2: How can HPO-based semantic similarity help in prioritizing VUS from a WES analysis?
When a WES analysis yields multiple VUS in different genes, HPO-based similarity provides a data-driven method to prioritize them. The phenotypic profile of the patient (their symptoms as HPO terms) can be compared to the known phenotypic profile associated with each gene harboring a VUS. The gene whose associated phenotypes are most semantically similar to the patient's profile is considered a stronger candidate [32] [33]. This method uses phenotypic data to corroborate genetic findings, adding evidence beyond population frequency and in-silico prediction scores.
Q3: What are the common sources of error when mapping patient symptoms to HPO terms?
Incorrect phenotypic similarity scores often stem from issues during the initial annotation phase:
- Imprecision: Using terms that are too general (e.g., "Abnormality of the musculoskeletal system") instead of the most specific term available (e.g., "Arachnodactyly") [33].
- Noise: Including HPO terms that describe features not present in the patient, which can lead to incorrect disease matches [33].
- Incomplete Annotation: Failing to capture the full spectrum of the patient's phenotype, which can reduce the strength of similarity to the correct genetic disease.
Q4: Our analysis yielded a high similarity score to a disease, but the gene is not listed as associated. How should we proceed?
This can indicate a novel gene-disease association or a shared biological pathway. First, verify the accuracy and completeness of your patient's HPO annotations. If confirmed, this finding can be followed up by:
- Investigating the biological network (e.g., protein-protein interactions, shared pathways) between your candidate gene and the genes known to cause the matched disease [31].
- Searching for additional patients with similar phenotypes and variants in the same gene through collaborative platforms or the literature.
- Undertaking functional studies to validate the gene's biological role in the disease context.
Troubleshooting Common Experimental Issues
| Problem | Potential Cause | Solution |
|---|---|---|
| Low discrimination between candidate diseases. | Using overly broad HPO terms that are annotated to many diseases. | Re-annotate the patient using the most specific HPO terms possible. Leverage the HPO hierarchy to ensure you are not using high-level parent terms. |
| Computationally intensive similarity calculations. | Comparing large patient phenotype sets against thousands of diseases using a complex method. | For initial screening, use a faster method like Resnik. Consider pre-filtering the disease database based on a few key HPO terms before running the full similarity analysis. |
| Inconsistent results when using different similarity measures. | Different algorithms (e.g., Lin, Jiang-Conrath) have different theoretical foundations and sensitivities. | This is expected. Use multiple established measures (Resnik, Lin) and the RelativeBestPair method to create a consensus ranking of candidate genes/diseases [33]. |
| The true underlying disease is not ranked highly. | The patient's phenotype may be noisy, imprecise, or incomplete. | Re-evaluate the patient's clinical data for missing or inaccurately annotated features. Consider simulating noise/imprecision to test your method's robustness [33]. |
Detailed Experimental Protocols
Protocol: Calculating Patient-to-Disease Semantic Similarity
This protocol outlines the steps to quantify the similarity between a patient's phenotypic profile and a database of known genetic disorders using the HPO.
- Objective: To generate a ranked list of candidate genes or diseases based on phenotypic similarity to aid in the interpretation of VUS from WES.
- Principle: The method calculates a semantic similarity score by comparing the information content of HPO terms shared between the patient and known disease profiles [31] [33].
Workflow Diagram: HPO-Based Similarity Scoring for VUS Prioritization
Step-by-Step Methodology:
Phenotype Annotation:
- Input: Detailed clinical description of the patient.
- Action: Systematically map each clinical feature to the most specific applicable HPO term. Tools like PhenoTips can assist in this process [33].
- Output: A set of HPO terms, P = {p₁, p₂, ..., pₙ}, representing the patient's phenotype.
Data Preparation:
Calculate Information Content (IC):
Select a Similarity Measure and Calculate Scores:
- Choose a semantic similarity method. A robust and widely used method is the Resnik measure [31] [33].
- For a patient profile P and a disease profile TD, the similarity is calculated by comparing all terms between the two sets. One common approach is to take the average of the best-matching term pairs [31]:
- sim(P → TD) = (1/|P|) * Σ{p in P} max{t in TD} sim{Resnik}(p, t)
- where sim_{Resnik}(p, t) = IC(MICA(p, t)). MICA is the Most Informative Common Ancestor of terms p and t.
Rank and Interpret Results:
- Rank all diseases in the database based on their final similarity score to the patient.
- Cross-reference the top-ranking diseases with the list of genes harboring VUS from the WES analysis. A VUS in a gene associated with a high-ranking disease becomes a prime candidate for further investigation.
Protocol: Implementing the RelativeBestPair Method for Robust Matching
For cases involving noisy or imprecise phenotypic data, the RelativeBestPair method has been shown to outperform traditional measures [33].
- Objective: To reliably identify the correct underlying disease even when patient HPO annotations contain inaccuracies.
- Principle: This method assigns a score to a disease based on the sum of the inverse frequencies of the patient's terms that annotate it, with a cap to prevent single rare terms from dominating [33].
Methodology:
Precompute Term-Disease Scores:
- For each HPO term t, let N_t be the number of diseases annotated by t or any of its descendants.
- The score of a disease D given term t is defined as:
- S(D|t) = 1/N_t, if D is annotated by t (or a descendant)
- S(D|t) = 0, otherwise [33].
Calculate Aggregate Similarity Score:
- For a patient with a set of query terms {t₁, t₂, …, tₙ}, the similarity score for a disease D_k is:
- Sim(Dk | t₁, t₂, …, tₙ) = Σ{i=1}^n min(α, S(Dk | ti))
- The threshold α (typically set to 0.01) limits the influence of any single, extremely rare term [33].
- For a patient with a set of query terms {t₁, t₂, …, tₙ}, the similarity score for a disease D_k is:
Rank Diseases:
- Diseases are ranked by their Sim(D_k | ...) score in descending order.
The Scientist's Toolkit: Research Reagent Solutions
| Item / Resource | Function in HPO Analysis | Key Features & Notes |
|---|---|---|
| HPO Ontology File | Core knowledge base of phenotypic terms and their relationships. | Available from the HPO website. Requires periodic updating to the latest version. |
| Phenotype-Annotated Disease Database (e.g., OMIM, Orphanet) | Provides the ground truth for training and testing similarity measures. | OMIM annotations are included with the HPO download [31]. |
| Semantic Similarity Software (e.g., HPOsim R package) | Provides pre-implemented algorithms (Resnik, Lin, etc.) for calculating similarity. | Saves development time and ensures methodological correctness [33]. |
| Phenotyping Tools (e.g., PhenoTips) | Facilitates accurate and consistent initial mapping of clinical notes to HPO terms. | Reduces annotation errors and time spent on manual curation [33]. |
| Custom Scripts (Python/R) | For implementing custom analysis pipelines, such as the RelativeBestPair method. | Essential for flexibility and integrating phenotypic analysis with WES variant data. |
Frequently Asked Questions (FAQs)
FAQ 1: What is the primary advantage of integrating LOEUF scores into my WES variant filtering pipeline?
LOEUF (Loss-of-function Observed/Expected Upper bound Fraction) scores quantify a gene's intolerance to loss-of-function (LoF) mutations. Genes with low LOEUF scores (<0.35) are highly constrained and likely haploinsufficient, making LoF variants within them strong candidates for pathogenicity. Integrating this metric helps prioritize variants in genes under strong purifying selection, significantly improving the diagnostic yield of WES analysis [34] [35].
FAQ 2: How can I functionally validate a cryptic splice variant identified by SpliceAI?
A multi-step approach is recommended for validating putative splice-altering variants:
- In silico confirmation: Use complementary tools like Pangolin or MaxEntScan to support the SpliceAI prediction.
- Experimental validation: Perform RNA sequencing (RNA-seq) on patient-derived tissue or cell lines. This allows you to directly observe aberrant splicing, such as exon skipping, intron retention, or the creation of cryptic splice sites [34] [36].
- Visualization: Use tools like the Integrative Genomics Viewer (IGV) to visualize the aberrant transcripts from RNA-seq data compared to controls [34].
FAQ 3: My WES analysis identified a VUS with a high REVEL score but in a gene with a high (tolerant) LOEUF score. How should I proceed?
A high REVEL score indicates the missense variant is likely deleterious. However, a high LOEUF score suggests the gene tolerates haploinsufficiency. In this case:
- The variant might still be pathogenic through a gain-of-function or dominant-negative mechanism, which LOEUF does not directly assess.
- Prioritize the variant but place more weight on the REVEL score and the clinical phenotype match.
- Investigate gene-specific literature for known mechanisms of disease and seek additional functional evidence to support the variant's role [37] [35].
FAQ 4: What are the common pitfalls when running SpliceAI, and how can I avoid them?
Common issues and their solutions include:
- Pitfall: Using an old version of gene annotations (Gencode), leading to inaccurate scores.
- Solution: Always use the most recent Gencode version (e.g., v47) compatible with your genome build to ensure accurate transcript modeling [38].
- Pitfall: Misinterpreting scores for insertions (ins) with a position of
0bp.- Solution: Be cautious, as these scores can be difficult to interpret; consult the SpliceAI Lookup site for warnings on specific variants [38].
- Pitfall: Over-relying on the default delta score threshold of 0.2.
Troubleshooting Guides
Issue 1: Low Diagnostic Yield in WES After Standard Exonic Analysis
Problem: After analyzing exonic and canonical splice site variants (±2 bp), a large proportion of cases, often more than 50%, remain undiagnosed [34].
Solution: Implement a comprehensive re-analysis strategy that includes non-canonical regions and advanced bioinformatic filters.
- Step 1: Integrate Genetic Intolerance Scores. Annotate your variant call format (VCF) files with LOEUF scores using a VEP plugin. Filter for variants in genes with LOEUF < 0.35 to prioritize haploinsufficient genes [34] [39].
- Step 2: Perform Intronic Variant Analysis. Use SpliceAI to screen intronic regions (e.g., up to 500bp from exon-intron boundaries) for cryptic splice-altering variants. A delta score > 0.2 is a common threshold for further consideration [34] [37].
- Step 3: Combine Constraints. For cases with a suggestive phenotype but no candidate variant after Steps 1 and 2, analyze all variants (exonic, splice site, intronic) specifically within the set of genes with low LOEUF scores. This highly targeted approach can identify high-impact variants in critical genes [34].
This integrated workflow for re-analyzing undiagnosed WES cases can be visualized as follows:
Issue 2: Inconsistent SpliceAI Predictions Across Transcripts
Problem: A single variant yields different SpliceAI scores for different transcripts of the same gene, leading to uncertainty in interpretation.
Solution: Establish a consistent protocol for transcript selection.
- Prioritize MANE Select Transcripts: The MANE (Matched Annotation from NCBI and EBI) Select transcript is a representative, well-supported transcript for a gene and is recommended for clinical interpretation [38].
- Use Gencode "Basic" Annotation Set: When running SpliceAI or looking up scores, select the "basic" set of Gencode transcripts to reduce redundancy and focus on the most biologically relevant transcripts [38].
- Check VEP Consequences: Use the Ensembl VEP to determine the canonical transcript and the most severe transcriptional consequence of the variant. Let this guide your final assessment [39] [38].
Issue 3: High Number of VUSs with Moderate REVEL Scores
Problem: The REVEL score filter returns a large number of VUSs with scores in the intermediate range (e.g., 0.4-0.7), making prioritization difficult.
Solution: Apply a tiered filtering approach that combines REVEL with other lines of evidence.
- Set Stringent REVEL Thresholds: Use a high threshold (e.g., > 0.7 or 0.75) for "strong" evidence of pathogenicity and a lower threshold (e.g., > 0.5) for "supporting" evidence, in line with ACMG guidelines.
- Integrate with Genetic Constraint: Cross-reference with LOEUF scores. A REVEL score of 0.65 in a gene with a very low LOEUF score (e.g., <0.2) is much more compelling than the same REVEL score in a tolerant gene.
- Leverage Phenotype: Filter against genes associated with your patient's Human Phenotype Ontology (HPO) terms. A variant's priority increases significantly if it is found in a gene known to be associated with the observed clinical phenotype [40].
Data Presentation
Table 1: Interpretation Guidelines for Key In Silico Scores
| Tool | Score Range | Interpretation Guideline | Clinical / Research Utility |
|---|---|---|---|
| LOEUF | < 0.35 | Highly constrained gene. LoF variants are strong candidates for pathogenicity. | Prioritizes variants in haploinsufficient genes; provides gene-level context [34] [35]. |
| 0.35 - 0.7 | Moderately constrained gene. | Use with supporting evidence from other tools. | |
| > 0.7 | Tolerant gene. LoF variants are more likely to be benign. | Can be used to deprioritize variants, but does not rule out gain-of-function mechanisms. | |
| SpliceAI | 0.2 - 0.5 | Potential splice-altering effect. | Good for screening; requires additional evidence (e.g., other tools, RNA-seq) [34] [37]. |
| 0.5 - 0.8 | Strong likelihood of a splice defect. | Can be used as supporting evidence for pathogenicity. | |
| > 0.8 | Very high likelihood of a splice defect. | Can be used as moderate evidence for pathogenicity. | |
| REVEL | 0.5 - 0.75 | Supporting evidence for pathogenicity. | Useful for VUS classification; integrate with gene constraint and phenotype [39]. |
| 0.75 - 0.93 | Moderate evidence for pathogenicity. | ||
| > 0.93 | Strong evidence for pathogenicity. |
Table 2: Essential Research Reagent Solutions
| Reagent / Resource | Function / Application | Key Details |
|---|---|---|
| SpliceAI Lookup | Web-based tool for retrieving SpliceAI scores for specific variants. | Supports hg19 and hg38; allows selection of Gencode basic/comprehensive transcripts; integrates Pangolin and AlphaMissense scores [38]. |
| Ensembl VEP Plugins | Framework for annotating VCF files with LOEUF, REVEL, and SpliceAI scores. | Centralizes annotation; plugins exist for LOEUF, dbNSFP (which includes REVEL), and SpliceAI [39]. |
| gnomAD Browser | Population frequency database. | Essential for filtering common variants; provides LOEUF scores for genes [37] [35]. |
| ConSpliceML | Machine learning tool that combines SpliceAI predictions with regional splicing constraint. | Outperforms SpliceAI alone in prioritizing deleterious cryptic splicing variants [37]. |
| DECIPHER | Database of genomic variation and phenotype in patients. | Useful for comparing VUSs against variants found in other patients with similar phenotypes [41]. |
Experimental Protocols
Protocol 1: Comprehensive Re-analysis of Undiagnosed WES Cases Using Intronic Screening and Genetic Constraint
This protocol is adapted from a 2025 study that improved diagnostic yield by re-analyzing WES data from cases with congenital anomalies [34].
- Data Preparation: Start with the raw sequence data (VCF files) from the initial, inconclusive trio-WES.
- LOEUF Annotation: Re-annotate the VCF using Ensembl VEP with the LOEUF plugin. This adds the gene-level constraint score to each variant.
- Intronic Screening with SpliceAI:
- a. For cases with a phenotype suggestive of a specific gene set (e.g., known disease-associated genes for the observed anomalies), run SpliceAI on all exonic, splice site, and intronic variants within those genes.
- b. Use a delta score cutoff of > 0.2 to select candidates. Automated scripts (Bash/Python) can process trio-VCF files, with an average runtime of 5-10 minutes per family.
- Genome-wide Constrained Gene Screening:
- a. For remaining undiagnosed cases, run SpliceAI on all variants (exonic, splice site, intronic) located within a pre-defined set of highly constrained genes (e.g., genes with LOEUF < 0.35).
- b. This automated script, which also filters for variant frequency and SpliceAI score, takes approximately 30-60 minutes per family to run.
- Variant Prioritization and Validation: Manually curate the list of candidate variants, applying inheritance filtering and ACMG/AMP guidelines. Validate putative splice variants using RNA sequencing.
Protocol 2: Functional Validation of a Cryptic Splice Variant via RNA Sequencing
This protocol is derived from methods used to validate intronic variants identified by SpliceAI [34] [36].
- Sample Acquisition: Obtain patient-derived tissue relevant to the disease phenotype (e.g., placental villi, fibroblasts, lymphoblastoid cell lines (LCLs)).
- RNA Extraction: Extract total RNA using a commercial kit (e.g., RNeasy Fibrous Tissue Mini Kit), including a DNase digestion step to remove genomic DNA.
- Library Preparation and Sequencing: Prepare an RNA-seq library using a strand-specific kit (e.g., NEBNext Ultra II Directional RNA Library Prep Kit). Sequence on a platform such as Illumina NovaSeq6000 in 100 bp paired-end mode.
- Data Analysis:
- Alignment: Map the sequencing reads to the reference genome using a splice-aware aligner like HISAT2.
- Visualization: Load the aligned BAM files into the Integrative Genomics Viewer (IGV). Compare the patient's splicing pattern at the variant locus against control samples to visually confirm aberrant splicing (e.g., exon skipping, intron retention).
- Quantification: Use tools like
rMATSto statistically quantify the differential splicing events between case and control samples.
Performance Metrics of Variant Prioritization Tools
The following table summarizes key quantitative data on the performance of optimized variant prioritization systems, demonstrating their impact on diagnostic yield.
| Tool / Strategy | Dataset | Key Performance Metric | Default Performance | Optimized Performance | Reference / Notes |
|---|---|---|---|---|---|
| Exomiser (Optimized) | Genome Sequencing (GS) | Diagnostic variants in top 10 | 49.7% | 85.5% | [42] |
| Exomiser (Optimized) | Exome Sequencing (ES) | Diagnostic variants in top 10 | 67.3% | 88.2% | [42] |
| Genomiser (Optimized) | Non-coding variants | Diagnostic variants in top 10 | 15.0% | 40.0% | Recommended as complementary to Exomiser [42] |
| Exomiser Reanalysis Strategy | 24,015 unsolved cases | New diagnoses identified | N/A | 463 (2%) | Strategy for periodic reanalysis [43] |
| AutScore.r | 441 ASD probands | Detection accuracy rate | N/A | 85% | Diagnostic yield of 10.3%; cut-off ≥ 0.335 [44] |
Frequently Asked Questions
Troubleshooting Guide: Exomiser and Genomiser
Why are my diagnostic variants not ranking in the top candidates?
Poor ranking is often linked to suboptimal parameter settings. A 2025 study demonstrated that customizing parameters significantly improves performance.
- Problem: Using Exomiser's default settings.
- Solution:
- Optimize Key Parameters: Systematically adjust parameters for gene-phenotype association data, variant pathogenicity predictors, and the quality of input Human Phenotype Ontology (HPO) terms [42].
- Validate HPO Terms: Ensure the use of a comprehensive and accurate list of HPO terms. The number and quality of terms directly impact the phenotype score and ranking accuracy [42].
- Check Variant Data: Confirm the inclusion and accuracy of family variant data in the PED file, as segregation analysis is crucial for prioritization [42].
Recommended Methodology for Parameter Optimization [42]:
- Systematic Evaluation: Assess how tool performance is affected by key parameters, including:
- Gene-phenotype association data sources.
- Variant pathogenicity prediction algorithms.
- Phenotype term quality and quantity.
- Accuracy of familial variant segregation data.
- Benchmarking: Use a cohort of solved cases, such as diagnosed probands from the Undiagnosed Diseases Network (UDN), to benchmark tool performance and identify optimal settings.
How can I effectively manage a high volume of Variants of Uncertain Significance (VUS) in my results?
VUS constitute the largest category of variants in rare disease research, creating a major interpretation bottleneck [2]. An integrative, score-based approach can streamline their assessment.
- Problem: Being overwhelmed by VUS, making it difficult to identify actionable candidates.
- Solution:
- Use an Integrative Scoring System: Implement a framework like AutScore, which aggregates evidence from multiple sources into a single, rankable score [44].
- Incorporate Automated ACMG Classification: Leverage Exomiser's automated ACMG/AMP classifier, which has been shown to correctly convert 92% of diagnostic variants from VUS to (Likely) Pathogenic, drastically reducing manual VUS review [43].
- Focus on Phenotype-Driven Prioritization: Prioritize VUS in genes with a strong known association to the patient's clinical phenotype, as this is a powerful indicator of causality.
Detailed AutScore Methodology for VUS Prioritization [44]:
The AutScore algorithm integrates multiple lines of evidence to rank candidate variants:
AutScore = I + P + D + S + G + C + H
Where:
- I: Pathogenicity from InterVar (e.g., Pathogenic=6, VUS=0).
- P: Deleteriousness from 6 in-silico tools (SIFT, PolyPhen-2, CADD, REVEL, M-CAP, MPC); score 1-6.
- D: Variant-phenotype segregation agreement with Domino tool.
- S: Gene-disease association strength from SFARI gene database.
- G: Gene-disease association strength from DisGeNET database.
- C: Pathogenicity evidence from ClinVar.
- H: Family segregation weighted by the number of affected individuals.
A refined version, AutScore.r, uses a generalized linear model to assign probabilistic weights to these modules for even higher accuracy [44].
What is the most efficient strategy for reanalyzing unsolved cases?
Periodic reanalysis of unsolved cases is essential, as new disease-gene associations are discovered regularly. A targeted strategy can make this process scalable.
- Problem: Manual reanalysis of all unsolved cases is labor-intensive and time-consuming.
- Solution: Implement a phenotype-driven reanalysis strategy using Exomiser to flag only high-probability new candidates.
- Efficient Reanalysis Protocol [43]:
- Run Exomiser on your cohort using a recent database release.
- Compare results with the previous analysis.
- Flag candidates that meet both of the following criteria:
- Variant Score > 0.8
- Increase in Human Phenotype Score ≥ 0.2 compared to the previous run.
- For maximum precision, also require the variant to be classified as (Likely) Pathogenic by Exomiser's automated ACMG classifier. This combination achieved 88% precision and 82% recall in a validation study [43].
The Scientist's Toolkit: Research Reagent Solutions
| Item / Resource | Function in Variant Prioritization |
|---|---|
| Exomiser/Genomiser | Open-source tool for phenotype-driven prioritization of coding and non-coding variants from ES/GS data [42]. |
| Human Phenotype Ontology (HPO) | Standardized vocabulary for describing patient phenotypes; crucial for calculating gene-phenotype similarity scores [42]. |
| AutScore/AutScore.r | An integrative scoring algorithm specifically designed for prioritizing ASD/NDD candidate variants from WES data [44]. |
| AutoCaSc | An existing variant prioritization tool for neurodevelopmental disorders, used as a benchmark for new algorithms [44]. |
| PanelApp | Platform for gene-disease association panels used in the 100,000 Genomes Project for virtual gene panel filtering [43]. |
| ACMG/AMP Guidelines | Standard international guidelines for variant interpretation; can be automated within tools like Exomiser [43] [2]. |
| In-silico Prediction Tools | Suite of tools (SIFT, PolyPhen-2, CADD, REVEL, etc.) used to predict the deleteriousness of missense variants [44]. |
| ClinVar | Public archive of reports on the relationships between human variants and phenotypes, with supporting evidence [44]. |
Optimizing Diagnostic Yield: Strategies for Complex VUS Cases
Why is periodic reanalysis of WES data recommended for VUS resolution?
Periodic reanalysis is recommended because the evidence used to classify genetic variants is constantly evolving. A Variant of Uncertain Significance (VUS) indicates that there is insufficient or conflicting information to determine if the variant is disease-causing (pathogenic) or benign [45]. Over time, new scientific findings, population data, and functional evidence become available, which can provide the proof needed to reclassify a VUS [2] [45]. This process is a critical step in ending the "diagnostic odyssey" for many patients with rare diseases [2].
What quantitative impact can reanalysis have on diagnostic yield?
Reanalysis of previously unresolved cases can significantly improve diagnostic outcomes. The following table summarizes key results from a recent 2025 study on Inherited Retinal Dystrophies (IRDs), which demonstrates this impact [46].
| Metric | Before Reanalysis | After Reanalysis |
|---|---|---|
| Probands with initial diagnosis | 313 of 525 | 355 of 525 |
| Overall diagnostic yield | 59.6% | 67.6% |
| Additional diagnoses from reanalysis cohort | - | 49 (42 probands, 7 relatives) |
| Diagnostic yield in reanalysis cohort | 0% (unresolved) | 48.5% (49 of 101 cases) |
Beyond this study, other recent research confirms the value of updated tools. One study showed that performing reflex RNA sequencing on 10 cases with VUSs resulted in five variants (50%) being reclassified from VUS to likely pathogenic after the RNA data revealed aberrant splicing [47].
What are the core methodological pillars of an effective reanalysis protocol?
An effective reanalysis strategy is not a single action but a stepwise, multi-faceted approach. The following workflow diagram outlines the core pillars and their sequence.
Pillar 1: Updated Bioinformatic Analysis involves revisiting the original sequencing data with new tools and knowledge. This includes:
- Updated Virtual Panels: Reanalyzing WES data with an expanded or updated list of disease-associated genes [46].
- Latest Guidelines & Population Data: Applying the most recent American College of Medical Genetics and Genomics and the Association for Molecular Pathology (ACMG-AMP) standards, recommendations from the Sequence Variant Interpretation Working Group (SVI-WG), and the newest population frequency data from resources like gnomAD [46] [48].
- Advanced Prediction Algorithms: Utilizing modern computational tools to predict variant impact. For missense variants, AlphaMissense can model protein structure, while SpliceAI is specialized for predicting impact on splicing [46] [48].
Pillar 2: Advanced Sequencing is employed when bioinformatic reanalysis is insufficient.
- Whole-Genome Sequencing (WGS): WGS is critical for detecting variants missed by WES, including those in deep intronic regions, structural variants (SVs), and complex genomic rearrangements [46].
- Customized Panels: Designing custom panels to target specific challenging regions, such as the repetitive RPGR-ORF15 or deep intronic regions of the ABCA4 gene [46].
- Reflex RNA Sequencing (RNAseq): This is a powerful functional tool that can be triggered by a VUS predicted to affect splicing. It analyzes the actual transcriptome to reveal aberrant splicing events like exon skipping or intron retention, providing direct evidence for variant reclassification [47].
Pillar 3: Functional Assays provide direct biological evidence to confirm a variant's pathogenicity, which is especially important for reclassification.
- mRNA Analysis: Isolating RNA from patient cells (e.g., whole blood or nasal ciliary cells) and performing RT-PCR to assess if a variant causes abnormal splicing or expression [46].
- Minigene/Midigene Assays: These in vitro assays are used when patient tissue is inaccessible. A genomic segment containing the variant is cloned into a vector, transfected into cells, and its effect on splicing is analyzed [46].
- Orthogonal Validation: Confirming the presence and nature of the variant using a different technology, such as Sanger sequencing, digital PCR (ddPCR), or Multiplex Ligation-dependent Probe Amplification (MLPA) [46].
The Scientist's Toolkit: Key Research Reagent Solutions
The following table details essential reagents and materials used in the featured reanalysis protocols.
| Reagent/Material | Specific Example | Function in Reanalysis Protocol |
|---|---|---|
| Library Prep Kit | KAPA HyperPrep Kit (Roche), xGen DNA Library Prep EZ Kit (IDT) [46] | Prepares DNA samples for Whole Genome Sequencing (WGS) by fragmenting and adding adapters. |
| Custom Capture Panel | Agilent SureSelect XT HS2 [46] | Enriches specific genomic regions (e.g., deep introns of ABCA4) for targeted sequencing. |
| RNA Extraction Kit | RNeasy Mini Kit (Qiagen), Maxwell RSC SimplyRNA Blood Kit (Promega) [46] | Isolates high-quality RNA from patient cells (blood, tissue) for functional mRNA analysis. |
| cDNA Synthesis Kit | PrimeScript RT Reagent Kit (TaKaRa) [46] | Converts extracted RNA into complementary DNA (cDNA) for subsequent PCR amplification and sequencing. |
| Midigene Construct | Wild-type ABCA4 midigene (BA7) [46] | A plasmid-based tool used in in vitro splice assays to study the functional impact of a specific genetic variant on splicing. |
Frequently Asked Questions for Troubleshooting Reanalysis
What is the first thing I should do when my analysis yields a VUS?
The first step is to conduct a thorough search of existing biomedical literature and variant databases. This includes:
- Search Engines & AI: A simple search using the gene name and protein change (e.g., "STAT3 R397W") can sometimes yield immediate published information. Asking specialized chatbots like OpenEvidence or Perplexity can also provide summarized references [48].
- Variant Databases: Query databases like ClinVar to see if other labs have reported the variant. Use population frequency databases like gnomAD to see how common the variant is in control populations [48].
- Disease-Specific Databases: Consult curated databases specific to your disease of interest, such as Infevers for autoinflammatory diseases [48].
We've done WES and WES reanalysis with no success. What's the next step?
If WES reanalysis is uninformative, the next logical step is often to move to Whole Genome Sequencing (WGS). WGS provides a more comprehensive view by capturing variants in non-coding regions, which are often missed by WES. A 2025 study highlighted that WGS was instrumental in detecting structural variants and deep intronic variants that resolved previously unexplained cases [46].
How do I prove a VUS affecting a splice site is truly pathogenic?
Proving pathogenicity for a splice-affecting VUS requires functional validation. The most direct and convincing method is through RNA studies.
- Option 1: Patient RNA Analysis. If accessible, isolate RNA from patient tissue (e.g., whole blood) and perform cDNA synthesis followed by PCR and sequencing. This allows you to directly observe the impact of the variant on the actual messenger RNA transcript [46] [47].
- Option 2: Minigene Assay. If patient RNA is not available, a minigene/midigene assay is a powerful alternative. This in vitro method involves cloning a genomic DNA segment containing the variant into a splicing vector. Transfecting this construct into cells allows you to analyze the resulting RNA and confirm the variant's effect on splicing [46].
The research community is a valuable resource. Do not hesitate to "phone a friend."
- Consult Experts: Reach out directly to clinical or research experts who specialize in the gene or disease of interest. The immunology community, for example, is known for being collaborative and willing to help [48].
- Use Listservs: Platforms like the Clinical Immunology Society's VUSserve listserv allow you to submit your case to a large, international community of experts who may have seen a similar variant or can offer guidance [48].
Frequently Asked Questions
Q1: What does the SpliceAI score mean, and what is a good cut-off value for predicting splicing alterations?
SpliceAI calculates a delta score (Δ score) that represents the probability of a variant causing a splicing alteration. Based on performance evaluations in genes like NF1, an optimal general cut-off is Δ score > 0.22, which provided a sensitivity of 94.5% and a specificity of 94.3% in one study [49]. The four specific delta scores to examine are:
- Acceptor Loss (AL)
- Donor Loss (DL)
- Acceptor Gain (AG)
- Donor Gain (DG)
The table below summarizes the performance metrics at this threshold [49].
| Metric | Value at Δ > 0.22 |
|---|---|
| Sensitivity | 94.5% |
| Specificity | 94.3% |
| Area Under the Curve (AUC) | 0.975 |
Q2: A variant has a low delta score (<0.2), but I still suspect a splicing defect. What should I do?
A low delta score does not always rule out a pathogenic effect. In such cases, it is critical to examine the Raw Scores (RS). The delta score is the difference between the variant and reference raw scores. If the reference raw score is already high (e.g., >0.8), even a variant that completely destroys a splice site might show only a small delta score [50]. Tools like SpliceAI-visual, which graphically displays raw scores for the reference and variant sequences, are invaluable for interpreting these scenarios [50].
Q3: How can I handle complex variants, such as deletion-insertions (delins), with SpliceAI?
The standard SpliceAI implementation or its pre-computed files often do not support complex variants. For these, you need to use tools that can run SpliceAI on custom sequences. SpliceAI-visual, available as a Google Colab notebook or integrated into the MobiDetails variant interpretation tool, is specifically designed to annotate complex variants like delins and inversions [50].
Q4: My analysis has identified a candidate non-coding variant. What is the recommended process for validation?
After a candidate non-coding variant is prioritized, a multi-step validation process is recommended. The workflow below outlines the key stages from computational prediction to functional confirmation.
Q5: Where can I find additional functional and population data for non-coding variants to support the ACMG/AMP classification?
Specialized databases aggregate this information specifically for non-coding regions. The Non-coding Variant Annotation Database (NCAD v1.0) is a comprehensive resource that integrates data from 96 sources, including population frequency from gnomAD and dbSNP, functional prediction scores, and regulatory element information [51]. Using such databases is essential for applying evidence codes like PM2 (absent from population databases) and PP3 (computational evidence of a deleterious effect) for non-coding variants.
Troubleshooting Guides
Problem: Inconsistent or misleading SpliceAI delta scores. Solution:
- Use Raw Scores: Always check the underlying raw scores using a tool like SpliceAI-visual. A variant that creates a strong splice site (high raw score) where none existed in the reference may be pathogenic even with a moderate delta score [50].
- Inspect the Sequence: SpliceAI-visual provides a graphical output in a genome browser, allowing you to visualize the position of the variant relative to existing splice sites and any newly created or strengthened cryptic sites. This can clarify the biological mechanism [50].
Problem: The diagnostic variant in my WES research is not being prioritized. Solution:
- Optimize Variant Prioritization Tools: If using tools like Exomiser/Genomiser, ensure parameters are optimized. A 2025 study showed that optimizing parameters, rather than using defaults, increased the ranking of coding diagnostic variants within the top ten candidates from 49.7% to 85.5% for WGS, and from 67.3% to 88.2% for WES [52].
- Check for Homologous Regions: Be aware of false-positive variant calls in genomic regions with high homology. As demonstrated in a case study, NGS can falsely call variants in the PRSS1 gene due to its homologous sequences. These findings should be confirmed with an independent method like Sanger sequencing [53].
Problem: Need to validate a predicted splice variant experimentally. Solution: Follow a tiered experimental protocol to confirm the splicing defect. The methodology below, derived from published evaluations, outlines a robust approach [49].
Detailed Protocol for cDNA Sequencing [49]:
- Step 1: RNA Extraction and cDNA Synthesis: Isolate high-integrity total RNA from patient cells (e.g., lymphocytes, fibroblasts). Use reverse transcription with random hexamers and/or oligo(dT) primers to synthesize complementary DNA (cDNA).
- Step 2: PCR Amplification: Design PCR primers to amplify the region of the gene spanning the variant of interest. It is often necessary to perform multiple PCRs overlapping different exons.
- Step 3: Sequence Analysis: Sequence the PCR products and analyze the cDNA sequence traces. Compare the results to the genomic DNA (gDNA) sequence to identify aberrant splicing events, such as exon skipping, intron retention, or the use of cryptic splice sites.
The Scientist's Toolkit
| Category | Tool / Reagent | Function / Explanation |
|---|---|---|
| In Silico Prediction | SpliceAI | Deep learning tool to identify splice-altering variants. The primary resource for initial screening [49] [50]. |
| In Silico Visualization | SpliceAI-visual | Free online tool that graphically displays SpliceAI's raw scores, aiding in the interpretation of complex variants and low delta-score cases [50]. |
| Variant Prioritization | Exomiser/Genomiser | Open-source software to prioritize coding and non-coding variants from WES/WGS data. Parameter optimization is critical for diagnostic performance [52]. |
| Database | NCAD v1.0 | A comprehensive database for annotating non-coding variants, aggregating population frequency, functional predictions, and regulatory element data from 96 sources [51]. |
| Validation | Sanger Sequencing | Gold-standard method for orthogonal confirmation of NGS-called variants, especially important in homologous regions to rule out false positives [53]. |
Troubleshooting Guides
Guide 1: Addressing Incomplete Exome Coverage
Problem: My whole exome sequencing (WES) data shows inconsistent coverage across exonic regions, potentially missing disease-causing variants.
Explanation: WES does not cover 100% of the exome due to challenges in target capture and amplification. Current WES technology struggles to achieve complete exonic coverage, which means disease-causing variants in poorly captured exons may be undetected [54].
Troubleshooting Steps:
- Analyze coverage metrics: Calculate the percentage of target regions with minimum 20x coverage. Clinical-grade WES should achieve >95% of exons covered at 20x [55].
- Visualize coverage distribution: Generate coverage plots across all target regions to identify consistent low-coverage areas.
- Supplement with additional testing: For regions of interest with consistently poor coverage, consider Sanger sequencing to fill coverage gaps.
- Consider alternative approaches: If comprehensive exon coverage is essential, whole genome sequencing (WGS) provides more complete coverage of exonic regions than WES [54].
Prevention Strategy:
- Use updated exome capture kits with improved target regions
- Optimize library preparation protocols to reduce GC bias
- Sequence at appropriate depth (typically 100-150x) to improve coverage uniformity
Guide 2: Improving CNV Detection in WES Data
Problem: My CNV calls from WES data show high false positive rates, particularly for small (single-exon) events.
Explanation: WES has inherent limitations for CNV detection due to discontinuous target regions and hybridization biases. The technology was primarily designed for detecting small variants rather than structural variations [54] [56]. Detection sensitivity for single-exon CNVs can be as low as 50% at typical WES depths [57].
Troubleshooting Steps:
- Implement multiple calling algorithms: Use at least two complementary CNV detection tools with different methodological approaches.
- Optimize reference samples: Select reference samples carefully using correlation metrics rather than random selection [55].
- Apply stringent filtering: Implement filters based on mappability, GC content, and repetitive regions to reduce false positives.
- Visual validation: Use visualization tools to manually inspect coverage patterns for putative CNVs.
- Orthogonal validation: Confirm clinically relevant CNVs using alternative methods such as MLPA or array CGH [57].
Table 1: Performance Comparison of CNV Detection Approaches
| Method | Deletion Sensitivity | Duplication Sensitivity | Key Limitations |
|---|---|---|---|
| WES with Read-Depth Methods | Up to 88% [57] | Up to 47% [57] | Poor detection of duplications <5 kb [57] |
| WGS with Optimized Callers | Up to 83% [57] | Varies by tool | Higher cost, computational demands [58] |
| Array CGH | Good for >50 kb | Good for >50 kb | Limited resolution for small CNVs [57] |
| MLPA | Excellent for targeted exons | Excellent for targeted exons | Low throughput, limited gene coverage [56] |
Prevention Strategy:
- Use trio sequencing to identify de novo CNVs with higher confidence
- Implement advanced algorithms like CoverageMaster that use wavelet transformation for improved signal detection [56]
- Maintain consistent sequencing protocols across samples to reduce technical variability
Frequently Asked Questions (FAQs)
FAQ 1: Coverage Depth and Quality
Q: What is the minimum recommended coverage depth for clinical WES? A: For reliable variant calling in clinical WES, a minimum of 20x coverage is required for >95% of target regions, with average coverage of 100-150x recommended to ensure sufficient data quality for accurate variant calling [55].
Q: Why does WES miss some exonic regions even at high sequencing depth? A: WES relies on hybridization-based capture which is influenced by local sequence features including GC content, secondary structure, and repetitive elements. These factors create inherent biases that prevent uniform coverage across all exons, regardless of total sequencing depth [54] [55].
Q: How can I identify whether a low-coverage region is due to technical issues or actual deletion? A: Technical artifacts typically affect multiple samples similarly, while true deletions appear as sample-specific events. Compare coverage patterns across your sample batch, and validate putative deletions with orthogonal methods like PCR or MLPA [55].
FAQ 2: CNV Detection and Analysis
Q: Why is CNV detection particularly challenging in WES data? A: CNV detection in WES is difficult due to multiple factors: (1) discontinuous target regions with gaps between exons, (2) coverage biases introduced during hybridization capture, (3) PCR amplification artifacts, and (4) the fundamental limitation that WES wasn't primarily designed for structural variant detection [54] [56] [55].
Q: What are the most reliable tools for CNV detection in WES? A: Tool performance varies significantly. Based on benchmarking studies, no single tool excels at all CNV types. The most effective approach uses an ensemble of tools with different methodologies, such as EXCAVATOR2 for larger CNVs and exomeCopy or FishingCNV for exon-level events, though each has precision limitations [55].
Q: Can WES reliably detect single-exon CNVs? A: Detection of single-exon CNVs remains challenging with WES. Sensitivity can be as low as 50% for single-exon events at standard sequencing depths. If single-exon CNV detection is clinically essential, consider supplementing with targeted methods like MLPA [57].
FAQ 3: Advanced Approaches and Integration
Q: How can I improve variant interpretation despite technical limitations? A: Integrate multiple data types and approaches: (1) Use trio sequencing to identify inheritance patterns, (2) Combine DNA and RNA sequencing to assess functional impact, (3) Implement advanced bioinformatics pipelines that incorporate population frequency data and in silico prediction tools, and (4) Maintain close communication between clinical and analysis teams for phenotypic correlation [54] [59].
Q: When should I consider WGS instead of WES? A: Consider WGS when: (1) Patients have complex phenotypes without clear candidate genes, (2) Previous WES testing was uninformative, (3) Comprehensive detection of structural variants is essential, or (4) Non-coding regulatory variants are suspected. WGS increases diagnostic yield by approximately 8% compared to WES but comes with higher computational and storage requirements [58] [57].
Q: What emerging technologies address current WES limitations? A: Several promising approaches include: (1) Long-read sequencing technologies that better resolve complex regions and structural variants, (2) Integrated RNA-DNA sequencing that connects genotypic findings to functional transcriptional effects, (3) Advanced computational methods using machine learning to improve variant prioritization, and (4) Enhanced exon capture kits with more comprehensive target regions [56] [58] [59].
Experimental Protocols
Protocol 1: Validating CNV Calls from WES Data
Purpose: To confirm putative CNVs identified through WES analysis using orthogonal methods.
Materials:
- DNA samples (test and control)
- MLPA probe mixes targeting regions of interest
- PCR reagents and thermocycler
- Capillary electrophoresis system
- Array CGH platform (optional)
Methodology:
- Design validation strategy: Select orthogonal methods based on CNV size and type:
- MLPA for exon-level CNVs (1-10 exons)
- Array CGH for larger CNVs (>50 kb)
- qPCR for rapid targeted validation
- Perform MLPA analysis:
- Denature DNA and hybridize with MLPA probe mix
- Perform ligation and PCR amplification
- Analyze fragment separation by capillary electrophoresis
- Normalize peak heights to control samples
- Calculate dosage quotients to determine copy number
- Interpret results:
- Dosage quotient of ~0.5 indicates deletion
- Dosage quotient of ~1.0 indicates normal copy number
- Dosage quotient of ~1.5 indicates duplication
- Document validation rate: Calculate the percentage of WES-based CNV calls confirmed by orthogonal methods to assess your pipeline's precision [55].
Expected Results: A well-optimized WES CNV pipeline should achieve >80% validation rate for multi-exon CNVs, though validation rates for single-exon CNVs may be lower (50-70%) [57] [55].
Protocol 2: Integrated RNA-DNA Analysis for Variant Interpretation
Purpose: To functionally characterize variants of uncertain significance (VUS) by assessing their impact on transcription.
Materials:
- Paired DNA and RNA from the same sample
- RNA extraction and DNase treatment reagents
- cDNA synthesis kit
- WES library preparation kit
- RNA-seq library preparation kit
- Sequencing platform
Methodology:
- Extract nucleic acids: IsDNA and RNA from the same tissue sample using appropriate extraction methods [59].
- Perform parallel sequencing:
- Prepare WES libraries from DNA using standard protocols
- Prepare RNA-seq libraries from RNA using stranded mRNA protocols
- Sequence both libraries on an Illumina platform
- Integrated analysis:
- Identify potential splicing defects caused by DNA variants
- Assess allele-specific expression to identify regulatory variants
- Detect aberrant expression patterns that support variant pathogenicity
- Identify gene fusions not detectable by DNA sequencing alone
- Correlate findings: Integrate DNA and RNA findings to reclassify VUS based on functional evidence [59].
Expected Results: Combined RNA and DNA sequencing can improve diagnostic yield by up to 18% compared to DNA sequencing alone, with RNA-seq playing an essential role in determining variant pathogenicity in a significant subset of cases [59].
Workflow Visualization
WES CNV Analysis and Validation Workflow
Integrated DNA-RNA Sequencing Analysis
The Scientist's Toolkit
Table 2: Essential Research Reagents and Computational Tools
| Tool/Reagent | Function | Application Notes |
|---|---|---|
| Twist Human Core Exome Kit | Target capture for WES | Provides comprehensive exonic coverage; used in CoverageMaster validation [56] |
| SureSelect XTHS2 DNA/RNA | Integrated DNA and RNA exome capture | Enables paired DNA-RNA analysis from same sample [59] |
| CoverageMaster (CoM) | CNV calling algorithm | Uses wavelet transformation for improved CNV detection; works with WES and WGS [56] |
| DRAGEN CNV-SV Caller | CNV and structural variant detection | High-sensitivity mode achieves up to 83% sensitivity; requires custom filtering [57] |
| SeeNV Visualization | CNV curation and visualization | Helps eliminate 75-90% of false positive CNV calls in diagnostic settings [60] |
| MLPA (MRC Holland) | Targeted CNV validation | Gold standard for exon-level CNV confirmation; used in CoverageMaster validation [56] |
| GATK CNV Calling | Germline CNV detection | Sensitive to mappability thresholds; requires careful parameter optimization [61] |
| Integrated WES+RNA-seq | Functional variant characterization | Increases diagnostic yield by 18% over DNA-only approaches [59] |
Evidence-Based Parameter Tuning for Variant Prioritization Software
Frequently Asked Questions (FAQs)
Q1: What is the primary challenge in variant prioritization that parameter tuning aims to solve? The primary challenge is the overwhelming number of variants of unknown significance (VUS) found in whole-exome sequencing (WES) and whole-genome sequencing (WGS). On average, WES detects 20,000–30,000 SNVs and indel calls per sample [29]. The goal of parameter tuning is to reduce this number to a shortlist of high-probability, causal variants to minimize the time and burden of manual review by clinical teams while ensuring true diagnostic variants are not filtered out [52] [42].
Q2: I am using Exomiser with default settings. How much can optimization improve my results? Parameter optimization can significantly improve diagnostic yield. Based on an analysis of 386 diagnosed probands from the Undiagnosed Diseases Network (UDN) [52] [42] [62]:
- For WGS data, the percentage of coding diagnostic variants ranked in the top ten increased from 49.7% to 85.5%.
- For WES data, the ranking of coding diagnostic variants in the top ten improved from 67.3% to 88.2%.
- For non-coding variants prioritized with Genomiser, the top ten ranking rate improved from 15.0% to 40.0%.
Q3: Which key parameters have the greatest impact on prioritization performance in Exomiser/Genomiser? Systematic evaluation identified several critical parameters [52] [42]:
- Gene-phenotype association data: The source and quality of phenotype ontologies (HPO terms).
- Variant pathogenicity predictors: The selection of in-silico prediction algorithms.
- Phenotype term quality and quantity: The accuracy and comprehensiveness of the patient's clinical HPO terms.
- Family variant data: The inclusion and genotypic accuracy of data from affected and unaffected family members.
Q4: In what scenarios might a diagnostic variant still be missed, even after optimization? Diagnostic variants may be missed in complex cases where [52] [42]:
- The variant lies in a non-coding region and is not effectively captured by Genomiser.
- The patient's phenotype is incorrectly or insufficiently annotated with HPO terms.
- The gene-disease relationship is not yet established in current knowledge bases. The study recommends using Genomiser as a complementary tool to Exomiser for non-coding variants and flagging genes that frequently appear in the top 30 candidates but are rarely diagnostic [42].
Q5: How can I standardize and automate my variant filtering and prioritization workflow? To ensure consistency and reproducibility, the gold standard is to use a single solution that automates and standardizes variant annotation, filtering, and prioritization through a user-controlled workflow, rather than multiple disparate software tools [29]. Solutions like the Mosaic platform, which implemented the recommendations from the UDN study, offer a framework for efficient, scalable analysis and reanalysis [52] [42].
Troubleshooting Guides
Problem: Low Ranking of Known Pathogenic Variants in Exomiser Output A known pathogenic variant is not appearing in the top-ranked candidates, potentially causing it to be overlooked during manual review.
Diagnosis & Solution: This is often related to suboptimal configuration of phenotype and variant filtering parameters. Follow this evidence-based protocol to reconfigure your analysis [52] [42]:
Refine Phenotype Input:
- Action: Ensure the proband's phenotype is described using a comprehensive and precise set of Human Phenotype Ontology (HPO) terms. Avoid using random or non-specific terms.
- Evidence: The UDN study found that the quality and quantity of HPO terms are a major factor in performance. Analysis showed that using randomly sampled HPO terms drastically reduces ranking effectiveness compared to using the clinician-curated terms from the patient's record [42].
Optimize Variant Pathicity Predictors:
- Action: Systematically evaluate and select the combination of in-silico prediction algorithms that work best for your specific cohort and sequencing type (WES vs. WGS). Do not rely solely on default scores.
- Evidence: The UDN analysis systematically evaluated how tool performance was affected by variant pathogenicity predictors, leading to a set of optimized parameters that significantly improved diagnostic ranking [52] [42].
Leverage Family Segregation Data:
- Action: Provide an accurate multi-sample VCF and corresponding pedigree file (PED format) for the family. Ensure the variant's mode of inheritance (e.g., autosomal dominant, recessive) is consistent with the family segregation pattern.
- Evidence: The inclusion and accuracy of family variant data were identified as a key parameter impacting the correct prioritization of diagnostic variants [52] [42].
Problem: Handling an Unmanageably Large Number of Variants after Prioritization The prioritization tool still outputs a list that is too large to feasibly review.
Diagnosis & Solution: This indicates that initial filtering may be too lenient or that the prioritization score thresholds are not sufficiently strict.
Apply a P-value Threshold:
- Action: Use the phenotype-match p-value generated by Exomiser as a filter. Setting a threshold (e.g., p < 0.05) can help exclude genes with a weak association to the patient's clinical presentation.
- Evidence: The optimized process explored refinement strategies for Exomiser outputs, including using p-value thresholds to reduce the list of candidate genes [52] [42].
Implement Frequency-Based Filtering:
- Action: Use population frequency databases (like gnomAD) to aggressively filter out common variants. For rare diseases, a typical minor allele frequency (MAF) filter is <0.01 [29].
- Evidence: Public databases are widely used for the initial elimination of common variants, which are unlikely to be causative for rare, monogenic disorders [29].
Experimental Protocols & Data
Summary of Optimized Exomiser/Genomiser Performance
The following table summarizes the key quantitative outcomes from the application of the optimized parameters on the UDN cohort [52] [42] [62].
| Sequencing Type | Tool | Variant Type | Top 10 Ranking (Default) | Top 10 Ranking (Optimized) |
|---|---|---|---|---|
| Whole-Genome (WGS) | Exomiser | Coding | 49.7% | 85.5% |
| Whole-Exome (WES) | Exomiser | Coding | 67.3% | 88.2% |
| Whole-Genome (WGS) | Genomiser | Non-coding | 15.0% | 40.0% |
Detailed Methodology: Benchmarking Variant Prioritization Performance
This protocol details the method used to generate the evidence-based recommendations for parameter tuning [52] [42].
1. Participant Cohort and Data Harmonization:
- Cohort: 386 diagnosed probands from the Undiagnosed Diseases Network (UDN) were analyzed. This included cases with both coding and non-coding diagnostic variants.
- Sequencing Data: Whole-genome and whole-exome sequencing data were harmonized. Samples were aligned to the GRCh38 reference genome, and joint variant calling was performed across all samples to generate multi-sample VCF files for each family.
- Phenotype Data: Comprehensive HPO terms for participants were curated by clinical teams and stored using PhenoTips software.
2. Systematic Parameter Evaluation:
- The performance of Exomiser and Genomiser was systematically tested against a range of key parameters:
- Gene:Phenotype Data: Different sources and scoring methods for gene-phenotype associations.
- Variant Pathogenicity Predictors: Various in-silico prediction algorithms.
- Phenotype Term Quality: The impact of using curated HPO terms versus randomly sampled terms.
- Family Data: The effect of including accurate familial segregation patterns.
3. Performance Metric and Optimization:
- The primary performance metric was the rank of the known diagnostic variant within the candidate list generated by the tool.
- Parameters were adjusted and tested iteratively. The set of parameters that produced the highest percentage of diagnostic variants within the top 10 and top 30 ranks was defined as the "optimized" configuration.
Optimized Variant Prioritization Workflow
The following diagram illustrates the evidence-based workflow for prioritizing variants in rare disease research, integrating key steps from data preparation to diagnosis.
Research Reagent Solutions
The following table details key software and data resources essential for implementing the optimized variant prioritization workflow.
| Item Name | Type | Function in Workflow |
|---|---|---|
| Exomiser/Genomiser [52] [42] | Open-Source Software Suite | The core tool for prioritizing coding (Exomiser) and non-coding (Genomiser) variants by combining genotypic and phenotypic data. |
| Human Phenotype Ontology [52] [42] | Standardized Vocabulary | Provides a computational language to accurately describe a patient's abnormal clinical phenotypes for input into prioritization tools. |
| Mosaic Platform [52] [42] | Integrated Analysis Platform | A platform that has implemented the optimized Exomiser/Genomiser parameters, providing a scalable framework for analysis and reanalysis. |
| ClinVar [63] | Public Database | A key resource used by AI-based engines to access assertions about variant pathogenicity and clinical significance. |
| QIAGEN Knowledge Base [29] | Commercial Curation Database | Provides pre-curated content from multiple sources to rapidly prioritize variants and automate manual curation processes. |
Validating VUS Pathogenicity and Assessing Clinical Actionability
Applying ACMG/AMP Guidelines for Standardized Variant Pathogenicity Assessment
Frequently Asked Questions
What are the ACMG/AMP guidelines and why are they important? The ACMG/AMP guidelines are an internationally accepted standard for interpreting genetic variants found through sequencing. They provide a structured framework to classify variants into categories like Pathogenic, Likely Pathogenic, Uncertain Significance (VUS), Likely Benign, and Benign. This standardization is crucial for ensuring consistent and accurate reporting across different clinical labs and research studies, especially when analyzing the vast number of variants from Whole Exome Sequencing (WES) [64] [65] [66].
I have identified a novel variant. How do I start classifying it? Begin by gathering evidence across different data types as outlined by the ACMG/AMP framework. Key evidence includes:
- Population Data: Check the variant's frequency in population databases (e.g., gnomAD). A high frequency suggests it is likely benign [66].
- Computational and Predictive Data: Use in silico tools to predict the variant's impact on protein function or splicing [66] [2].
- Functional Data: Seek evidence from functional assays that show a deleterious effect on the gene or protein [66].
- Segregation Data: Analyze if the variant co-segregates with the disease phenotype within a family [65].
- De Novo Data: Establish whether the variant occurred de novo in the affected individual [64].
What is the most common challenge in variant classification? The most frequently reported challenge is the interpretation of Variants of Uncertain Significance (VUS). In one analysis of variants linked to rare diseases, the majority were classified as VUS, highlighting the difficulty in determining their clinical impact without sufficient evidence [4] [2]. Another common challenge is handling incidental findings [4].
Our lab's variant classification differs from another lab's. Why does this happen? Despite standardized guidelines, differences in classification can occur due to:
- Differences in applied evidence: Labs may have access to or weigh specific evidence types (e.g., internal functional data, patient phenotype) differently [64].
- Use of updated information: Genetic knowledge evolves rapidly. A VUS in one database today might be reclassified as Likely Pathificant tomorrow as new evidence is published and shared in databases like ClinVar [64] [66].
- Curation and expertise: Interpretation can be influenced by a lab's specific expertise with a particular gene or disease [67].
Troubleshooting Common Scenarios
Scenario 1: A predicted loss-of-function variant is classified as a VUS Problem: A frameshift or nonsense variant in a disease-associated gene is not automatically classified as Pathogenic. Solution:
- Check for common artifacts: Verify the variant is not located in a low-complexity or repetitive region prone to sequencing or alignment errors [67].
- Review population frequency: Ensure the variant is truly rare. Even putative loss-of-function variants can be found at low frequencies in healthy populations and may not be pathogenic [66].
- Confirm the transcript: Use the correct and canonical transcript for your annotation. A variant in a non-coding or non-expressed transcript may not have a functional impact.
- Investigate the gene: Determine if the gene is known to be tolerant to haploinsufficiency (i.e., can function with only one working copy). If the gene is highly tolerant, a single loss-of-function variant may not cause disease [2].
Scenario 2: Inconsistent phenotype-genotype correlation is blocking classification Problem: The patient's clinical features do not perfectly match the known spectrum of the disease linked to the gene. Solution:
- Consider phenotypic expansion: The variant may cause a novel or expanded phenotype not previously described. Literature reviews and databases like OMIM should be checked for recent updates on gene-disease associations [68].
- Evaluate for allelic disorders: The gene might be associated with multiple distinct diseases (allelic disorders), which can have very different clinical presentations [68].
- Rule out dual diagnoses: The patient might have two independent genetic conditions. Re-evaluate the data for a potential second causative variant in a different gene [68].
Scenario 3: A missense variant has conflicting computational predictions Problem: One in silico tool predicts the missense change is "damaging," while another predicts it is "tolerated." Solution:
- Use a consensus approach: Rely on multiple reputable prediction tools and follow the consensus. Do not base evidence on a single tool's output.
- Weigh supporting evidence stronger: In the ACMG/AMP framework, conflicting computational data typically provides only "supporting" level evidence (PP3 or BP4). It should not be the primary factor for classification and must be combined with other lines of evidence, such as segregation or functional data [65] [66].
- Check for conservation: Assess whether the affected amino acid is highly conserved across species, which can strengthen the case for pathogenicity.
Experimental Protocols for Evidence Generation
Protocol 1: Segregation Analysis in a Family Objective: To determine if a variant co-segregates with the disease phenotype within a family. Methodology:
- Sample Collection: Obtain DNA samples from the proband and available family members (e.g., parents, siblings, and other affected or unaffected relatives).
- Variant Confirmation: Use an independent method, such as Sanger sequencing, to confirm the presence of the variant in the proband's sample.
- Genotyping: Test all collected family samples for the variant.
- Phenotype Correlation: Correlate the genotype (presence/absence of the variant) with the phenotype (affected/unaffected status) for each family member. Interpretation: Perfect segregation, where all affected individuals carry the variant and no unaffected individuals do (assuming complete penetrance), provides strong evidence for pathogenicity (ACMG/AMP criterion PP1) [65].
Protocol 2: Assessing for a De Novo Event Objective: To confirm that a variant in an affected individual has arisen newly and was not inherited from either parent. Methodology:
- Trio Sequencing: Perform sequencing (e.g., WES) on the proband and both biological parents.
- Variant Calling and Filtering: Identify variants in the proband and then filter out those that are present in either parent's data.
- Confirmation by Orthogonal Method: Use a different sequencing technology (like Sanger sequencing) to confirm the de novo status of the candidate variant in the trio.
- Confirm Biological Relationships: Verify the reported parent-child relationships using genetic markers to rule out sample mix-ups or non-paternity. Interpretation: A confirmed de novo event is strong evidence for pathogenicity (ACMG/AMP criterion PS2) [64] [65].
The Scientist's Toolkit: Research Reagent Solutions
Table: Essential resources for ACMG/AMP variant interpretation.
| Resource Name | Type | Primary Function in Interpretation |
|---|---|---|
| gnomAD [66] | Population Database | Assess variant frequency in large, diverse populations to filter out common polymorphisms. |
| ClinVar [66] | Clinical Database | Review existing classifications and evidence from other labs and researchers. |
| CADD [2] | In Silico Prediction | Score variant deleteriousness by integrating multiple genomic annotations. |
| SIFT & PolyPhen-2 | In Silico Prediction | Predict the functional impact of missense variants on the protein. |
| REVEL | In Silico Prediction | A meta-predictor that combines scores from multiple tools for improved accuracy. |
| OMIM | Knowledge Base | Research established gene-disease relationships and clinical phenotypes. |
| HGVS Nomenclature | Standardization Tool | Ensure unambiguous and correct variant description using standard terminology [65]. |
Quantitative Data for Variant Assessment
Table: Summary of key quantitative thresholds used in ACMG/AMP classification.
| Data Type | Typical Threshold (for Rare Diseases) | ACMG/AMP Criterion | Application |
|---|---|---|---|
| Allele Frequency | < 0.1% (0.001) in population databases | PM2 | Supports pathogenicity for rare variants [66]. |
| De Novo Observation | Confirmed in proband (both parents negative) | PS2 | Strong evidence for pathogenicity [64]. |
| Segregation Data | Observed in multiple affected family members | PP1 | Supporting evidence for pathogenicity [65]. |
| Computational Evidence | Multiple tools predict a damaging effect | PP3 | Supporting evidence for pathogenicity [66]. |
Workflow and Pathway Diagrams
Variant Assessment Workflow
Evidence Integration for VUS Resolution
Troubleshooting Guide: Functional Validation FAQs
This guide addresses common challenges in validating Variants of Uncertain Significance (VUS) discovered through Whole Exome Sequencing (WES), providing practical solutions for researchers and drug development professionals.
RNA Sequencing Challenges
Problem: My RNA-seq data shows inconsistent splicing patterns across different tissues. How do I determine the true biological impact of a VUS?
Question: What is the first step to troubleshoot inconsistent splicing results?
- Answer: Always verify the biological relevance of your sample tissue. RNA sequencing (RNA-seq) on clinically relevant tissues is crucial, as splicing patterns are highly tissue-specific. For example, a splicing variant in a neuromuscular gene may only show aberrant splicing in muscle tissue, not in whole blood [69]. If possible, use multiple tissue types (e.g., whole blood and fibroblasts) to build a complete picture.
Question: After sequencing, my alignment rates are low. What could be the issue?
- Answer: Low alignment rates can stem from several factors. First, check RNA quality; degraded samples yield poor data. Second, ensure you are using a splice-aware aligner like STAR (Spliced Transcripts Alignment to a Reference), which is designed to handle reads that span intron-exon junctions, a common challenge in RNA-seq [70]. Using an inappropriate aligner will result in many reads being discarded.
Question: I've identified aberrant splicing, but how do I prove it's caused by my specific VUS?
- Answer: Correlative evidence from RNA-seq must be combined with other data. Manually inspect the aligned reads in a genome browser like the Integrative Genomics Viewer (IGV) to visualize splicing events like exon skipping or intron retention directly linked to the variant's genomic location [69]. For definitive proof, use minigene splicing assays, which isolate the variant's effect in a controlled cellular environment.
Problem: Bioinformatics pipelines for RNA-seq are giving highly variable results, leading to conflicting conclusions about a variant's effect.
Question: How can I make my RNA-seq analysis more robust and reproducible?
- Answer: Standardize your bioinformatics practices. This includes:
- Using the latest genome build (e.g., hg38) [71].
- Employing containerized software environments (e.g., Docker, Singularity) to ensure consistency [71].
- Following a strict version control system (e.g., git) for all analysis code [71].
- Utilizing a standard set of analyses and multiple tools for variant calling to cross-validate results [71].
- Answer: Standardize your bioinformatics practices. This includes:
Question: What are the key steps in a standard RNA-seq workflow I should double-check?
- Answer: A robust RNA-seq pipeline follows these core steps. Inconsistencies at any stage can dramatically alter results and interpretation [70].
The diagram below illustrates the key steps in a standard RNA-seq workflow.
Animal Model Challenges
Problem: I am getting negative results in my animal model, even though all computational and RNA-seq data suggest the VUS is pathogenic.
Question: My therapeutic compound works in my mouse model but fails in human trials. What is wrong with my model?
- Answer: This is a classic translational failure often due to insufficient predictive validity. Your animal model may not accurately predict the human therapeutic response. To address this, select animal models based on a multifactorial validation approach. No single model is universal; use a combination of models that cover predictive, face, and construct validity to improve translational significance [72].
Question: How do I choose the right animal model to validate a VUS found in human patients?
- Answer: Select a model by evaluating it against three key validity criteria. The table below defines these criteria and their importance.
| Validity Criterion | Definition | Key Question | Relative Importance in Drug Discovery |
|---|---|---|---|
| Predictive Validity | How well the model's response to therapeutics predicts the human response. | "Does a treatment that works in the model also work in humans?" | Highest [72] |
| Face Validity | How well the model's phenotype resembles the human disease symptoms. | "Does the model look like it has the human disease?" | Medium [72] |
| Construct Validity | How well the model's underlying mechanism mirrors the known human disease biology. | "Is the disease caused by the same biological mechanism in the model and humans?" | Medium [72] |
- Question: A colleague suggested we use a zebrafish model for rapid testing, but I'm concerned it's too different from humans. How do I decide?
- Answer: The choice depends on the specific gene and phenotype. Zebrafish offer high throughput and excellent visual assessment of developmental phenotypes (good face validity for some conditions). However, they may lack construct validity for complex neurological disorders. The optimal strategy is a multi-model approach. You might use zebrafish for high-throughput screening and then validate top hits in a mammalian model like a mouse, which has greater physiological similarity to humans [73] [72].
The relationships between the different types of animal model validity and the overall goal of translational significance are shown in the pathway below.
Integrated Analysis & VUS Interpretation
Problem: I have functional data from RNA-seq and animal models, but I'm unsure how to combine it to reclassify a VUS.
Question: What level of evidence does RNA-seq provide for VUS reclassification?
- Answer: RNA-seq can provide functional evidence that is considered "strong" or "very strong" according to ACMG/AMP guidelines for variant interpretation [69]. For example, the detection of aberrant splicing (e.g., exon skipping, intron retention) due to a non-coding variant can be the key evidence needed to upgrade a VUS to "Likely Pathogenic" [69] [4]. The quantitative data from a cohort of 30 cases showed that RNA-seq contributed to a definitive or likely diagnosis in 27% of cases, primarily by detecting these splicing defects [69].
Question: How significant is the challenge of VUS in rare disease diagnosis?
- Answer: VUS represents the single largest category of variant classifications in clinical databases, creating a major bottleneck. As of late 2024, a query of the ClinVar database for rare diseases yielded 94,287 variants, with the majority being classified as VUS [2]. This highlights the critical need for the functional validation approaches described in this guide.
Question: What is a systematic method to link computational predictions to experimental validation?
- Answer: Adopt a structured workflow that moves from in silico prediction to functional assays. The transition is not always straightforward and requires careful experimental design tailored to the research question [74]. The table below summarizes a recommended approach.
| Step | Activity | Purpose & Consideration |
|---|---|---|
| 1. In Silico Prediction | Use multiple bioinformatics tools (e.g., SpliceAI, CADD) to predict variant impact. | Generates a testable hypothesis. Be aware that tools are built on existing knowledge and can inherit its limitations [73]. |
| 2. Transcriptomic Assessment | Perform RNA-seq on patient cells or relevant tissues. | Provides functional evidence of splicing or expression defects. Tissue relevance is critical [69]. |
| 3. In Vitro Validation | Conduct minigene assays or functional tests in cell cultures. | Isolates the variant's effect in a controlled system, confirming causality [74]. |
| 4. In Vivo Validation | Use animal models selected for relevant validity. | Confirms the variant's effect in a whole organism, providing context for pathophysiology [72]. |
The Scientist's Toolkit: Research Reagent Solutions
The following table details key materials and tools essential for setting up functional validation experiments.
| Item | Function / Application |
|---|---|
| STAR Aligner | A splice-aware aligner for RNA-seq data that accurately maps reads across exon-intron junctions [70]. |
| featureCounts | A highly efficient read summarization program that assigns aligned sequences to genomic features (e.g., genes, exons) [70]. |
| Integrative Genomics Viewer (IGV) | A visualization tool for manual exploration of aligned RNA-seq data, allowing scientists to visually confirm splicing events [69]. |
| hg38 Reference Genome | The current standard reference genome build for human clinical genomics; its use is recommended for alignment to ensure accuracy and consistency [71]. |
| GENCODE Annotation | A comprehensive gene annotation database for the human genome, providing the coordinates of genes and transcripts essential for the read summarization step [70]. |
| Containers (Docker/Singularity) | Software encapsulation tools that ensure bioinformatics pipelines run consistently across different computing environments, guaranteeing reproducibility [71]. |
| Minigene Splicing Vectors | Plasmid-based recombinant DNA tools containing a genomic region of interest with a cloned VUS, used to assay splicing activity in cell culture independently of the patient's native genome [69]. |
| Genome in a Bottle (GIAB) | A reference set of benchmark variant calls from a well-characterized human genome, used to validate the accuracy of bioinformatics pipelines [71]. |
The Clinical Challenge of Variants of Uncertain Significance
What are Variants of Uncertain Significance (VUS) and why do they pose a significant challenge in genomic medicine? Variants of Uncertain Significance (VUS) represent genetic alterations whose impact on health and disease risk is currently unknown. They are a major challenge in clinical genomics because their uncertain clinical significance complicates diagnosis, prognosis, and treatment decisions. In rare diseases, which often follow Mendelian inheritance patterns, VUS account for a substantial proportion of identified variants, creating diagnostic uncertainty and potentially delaying appropriate care [2].
How common are VUS in genetic testing? VUS are remarkably common in genetic testing. As of October 2024, querying the ClinVar database with the term "rare diseases" yielded 94,287 variants, with the majority categorized as VUS [2]. The burden of VUS is particularly high in populations underrepresented in genomic databases, such as Indigenous African populations, where 47% of early-onset colorectal cancer patients carried VUS with strong pathogenic potential [75].
Protective Loss-of-Function Variants: Conceptual Framework
What are protective loss-of-function (LoF) variants and why are they important for drug development? Protective LoF variants are natural human genetic mutations that inactivate a gene product but concurrently reduce risk for specific diseases. These variants provide powerful validation of drug targets because they demonstrate the clinical consequences of modulating a specific gene or pathway in humans. Pharmaceutical researchers study these natural human "knockouts" to identify and prioritize drug targets with higher confidence in efficacy and safety profiles.
What evidence exists that apparent LoF variants in disease-associated genes may not always cause disease? Recent research analyzing 807,162 individuals from the Genome Aggregation Database (gnomAD) investigated 734 predicted LoF variants in 77 genes associated with severe, early-onset, highly penetrant haploinsufficient diseases. This study found explanations for the presumed lack of disease manifestation in 701 of 734 variants (95%), highlighting that many apparent LoF variants in disease genes have underlying rescue mechanisms or were initially misclassified [76].
Technical Foundations: Analytical Approaches and Workflows
Computational Tools for SV and VUS Prioritization
Table 1: Benchmarking Performance of Structural Variant Annotation Tools
| Tool Name | Approach Type | AUC Score | Key Features | Best Use Cases |
|---|---|---|---|---|
| StrVCTVRE | Data-driven | 0.96 | Focuses on molecular functions overlapping exons | Highest accuracy for pathogenic SV prediction |
| XCNV | Data-driven | 0.91 | Integrates broad population genomic information | General SV prioritization |
| CADD-SV | Data-driven | 0.89 | Uses human-chimpanzee SVs as neutral proxies | Evolutionary constraint analysis |
| TADA | Data-driven | 0.86 | Considers long-range hypotheses from 3D genomic data | Regulatory SV impact |
| SVScore | Data-driven | 0.83 | Aggregates scores from individual SNPs | SNP-based impact assessment |
| AnnotSV | Knowledge-driven | 0.82 | Based on ACMG/ClinGen guidelines | Clinical SV interpretation |
| ClassifyCNV | Knowledge-driven | 0.79 | Implements ACMG criteria with scoring metrics | CNV classification |
| dbCNV | Data-driven | 0.50 | Incorporates diverse gold standard datasets | Limited utility based on current performance [77] |
Core Analytical Workflow for Protective LoF Identification
What is the standard workflow for identifying and validating protective LoF variants from population genomic data? The identification of protective LoF variants follows a systematic computational and experimental workflow beginning with large-scale population genomic data analysis. The process involves: (1) Identifying predicted LoF variants using specialized filters; (2) Detecting apparent non-penetrance by identifying healthy carriers of disease-associated variants; (3) Performing deep case-by-case assessment to identify rescue mechanisms; (4) Predicting functional impact using annotation tools; and (5) Prioritizing targets with drug development potential [76]. This workflow requires integration of multiple data types and rigorous validation to minimize false assignments of disease risk.
Research Reagent Solutions for VUS Functional Characterization
Table 2: Essential Research Reagents for VUS Functional Studies
| Reagent/Category | Specific Examples | Primary Function | Application Context |
|---|---|---|---|
| Model Organisms | C. elegans (nematodes) | In vivo functional testing of missense variants | Conservation of biological pathways enables human variant modeling |
| Genome Editing Tools | CRISPR-Cas9 systems | Precise introduction of human variants into model systems | Creating isogenic lines for functional comparison |
| Functional Assays | Coenzyme Q10 deficiency assays | Phenotypic characterization of metabolic variants | Quantifying biochemical consequences of VUS |
| Multi-omics Platforms | RNA-seq, proteomics, metabolomics | Comprehensive molecular profiling | Identifying downstream effects of variants |
| Structural Prediction | AlphaMissense | Protein structure and folding impact prediction | Best for loss-of-function, limited for gain-of-function variants [48] [78] |
Troubleshooting Common Experimental Challenges
VUS Interpretation and Validation Issues
FAQ: How can I resolve a VUS finding in clinical or research settings? When encountering a VUS, researchers and clinicians can employ multiple strategies:
- Database interrogation: Query resources like gnomAD (v4 contains 730,947 exomes and 76,215 genomes), ClinVar, and disease-specific databases like Infevers for autoinflammatory diseases [48]
- Computational prediction: Utilize effect prediction algorithms (99 currently available), including AlphaMissense for missense variants, though with caution for gain-of-function mutations [48]
- Expert consultation: Reach out to specialized researchers or utilize listservs like the Clinical Immunology Society's VUSserve, followed by approximately 1,000 immunologists [48]
- Functional testing: Implement experimental assays to characterize variant effects, though many are currently research-grade rather than clinically validated [48]
FAQ: What are the limitations of population frequency databases like gnomAD? While gnomAD is an essential resource for variant interpretation, researchers should be aware of several limitations:
- Disease contamination: gnomAD includes adult cases from disease cohorts such as inflammatory bowel disease, potentially affecting variant frequency calculations
- Ancestry bias: Despite improvements, the database still predominantly represents Caucasian populations with northern European ancestry
- Population-specific frequencies: Variants may be common in specific populations but rare overall, requiring careful interpretation in the context of the patient's ancestry [48]
Structural Variant Analysis Challenges
FAQ: Why are complex structural variants challenging to detect and interpret? Complex de novo structural variants (dnSVs) present significant technical and interpretative challenges due to several factors:
- Detection limitations: Short-read technologies struggle to accurately capture large-scale genomic rearrangements, particularly in regions with high sequence similarity
- Classification difficulty: In a study of 12,568 families from the UK 100,000 Genomes Project, complex dnSVs constituted 8.4% of all dnSVs and were the third most common type following simple deletions and duplications
- Functional impact complexity: SVs can disrupt the three-dimensional organization of the genome by interfering with topologically associating domains (TADs), repositioning regulatory elements, or creating ectopic interactions between genes and regulatory elements [79] [80]
FAQ: What methodological approaches improve complex SV detection? Enhancing complex SV detection requires complementary strategies:
- Pipeline refinement: Precise short-read analytical pipelines remain essential, particularly in the absence of large cohort population datasets
- Long-read sequencing: Although more expensive, long-read technologies provide better resolution for complex genomic variations
- Multi-platform validation: Combining array-based methods, whole-exome sequencing, and RNA-seq data improves detection rates, with one study finding that 22% of de novo deletions or duplications previously identified by array-based or WES methods were actually complex dnSVs [80]
Advanced Methodologies and Experimental Protocols
Functional Validation Workflow for VUS
Detailed Protocol: C. elegans Functional Assay for Missense VUS
Protocol Title: Functional Testing of Human Disease Missense Variants in C. elegans Orthologs
Background and Principle: This protocol utilizes the evolutionary conservation between human genes and C. elegans orthologs to assess the functional impact of missense variants. The approach is particularly valuable for variants whose clinical significance remains undetermined, as it provides in vivo functional data in a whole-organism context.
Materials and Reagents:
- N2 Bristol wild-type C. elegans strain
- CRISPR-Cas9 genome editing components (sgRNAs, repair templates)
- Coenzyme Q10 (CoQ10) supplementation reagents (for COQ2/coq-2 studies)
- Synchronization reagents (alkaline hypochlorite solution, S-basal)
- Phenotypic assessment tools (microscopes, thrashing assay apparatus)
Methodology:
- Ortholog Analysis: Identify C. elegans orthologs of human genes of interest through sequence alignment and functional conservation assessment
- Variant Introduction: Use CRISPR-Cas9 genome editing to generate C. elegans strains carrying specific missense variants equivalent to human VUS
- Phenotypic Characterization: Conduct comprehensive phenotypic analyses comparing wild-type and variant strains:
- Locomotory defects (thrashing assays)
- Developmental abnormalities
- Reproductive fitness
- Biochemical deficits (e.g., CoQ10 levels for coq-2 variants)
- Rescue Experiments: Administer therapeutic compounds (e.g., CoQ10 supplementation) to determine if phenotypic abnormalities can be reversed
- Multi-parameter Assessment: Evaluate rescue efficacy across multiple phenotypic parameters
Applications and Limitations: This approach successfully modeled human primary CoQ10 deficiency through coq-2 missense variants, with phenotypes generally rescued by CoQ10 supplementation. The method is particularly effective for loss-of-function variants but may have limitations for gain-of-function mutations or genes without clear orthologs [78].
Protocol for Periodic VUS Re-evaluation
Background: Systematically reassessing VUS classifications over time as new evidence emerges is critical for maintaining accurate genomic interpretations.
Procedure:
- Initial Assessment: Document original classification evidence and date of interpretation
- Evidence Monitoring: Establish regular intervals (recommended 3-5 years) for reviewing new data from:
- Population databases (gnomAD, DGV)
- Clinical databases (ClinVar, DECIPHER)
- Scientific literature (PubMed)
- Functional data repositories
- Updated Classification: Apply current ACMG/ClinGen guidelines using all new evidence
- Documentation: Generate revised reports with explanation of classification changes
Outcome Metrics: A retrospective study of 567 CNVus from 480 pediatric cases demonstrated a 5.6% overall reclassification rate, with 0.8% reclassified as pathogenic/likely pathogenic and 4.8% as benign/likely benign [81]. Commercial laboratories like Blueprint Genetics offer formal variant re-evaluation services 12 months after initial reporting [82].
Data Integration and Target Prioritization Framework
Quantitative Assessment of Apparent Non-Penetrance
Table 3: Resolution of Apparent Non-Penetrant LoF Variants in Haploinsufficient Disease Genes
| Category | Number of Variants | Percentage | Explanation Mechanisms |
|---|---|---|---|
| Total pLoF Variants Assessed | 734 | 100% | Variants in 77 severe, early-onset, highly penetrant haploinsufficient disease genes |
| Variants with Explained Non-Penetrance | 701 | 95% | Rescue mechanisms, annotation errors, or technical artifacts |
| Unexplained Non-Penetrance | 33 | 5% | Potential true non-penetrance or unidentified rescue mechanisms |
| Common Rescue Mechanisms | Local modifying variants, biological relevance of variant site, technical artifacts | Detailed case-by-case assessment required [76] |
Druggability Assessment Framework for Protective LoF Targets
How are protective LoF variants prioritized for drug development programs? Targets arising from protective LoF variant analysis are evaluated through a multi-parameter framework:
- Genetic evidence strength: Effect size, number of independent LoF variants, and protective dose-response relationship
- Biological plausibility: Understanding of the gene's role in disease-relevant pathways
- Therapeutic tractability: Ability to pharmacologically modulate the target (inhibition for protective LoF)
- Safety profile: Phenotypic consequences of complete gene disruption in human carriers
- Commercial considerations: Disease prevalence, unmet need, and competitive landscape
What are the key considerations for translating protective LoF findings into drug development programs? Successful translation requires:
- Comprehensive variant characterization: Distinguishing true protective effects from technical artifacts or population stratification
- Mechanism of action understanding: Elucidating how gene disruption confers protection
- Therapeutic modality selection: Choosing appropriate approaches (small molecules, antibodies, oligonucleotides) to recapitulate the protective effect
- Clinical development strategy: Designing trials that account for potential efficacy and safety profiles suggested by human genetics
This guide synthesizes a recent, independent evaluation of seven commercial bioinformatics platforms for automated variant interpretation in Whole Exome Sequencing (WES). For researchers grappling with Variants of Unknown Significance (VUS), understanding the sensitivity and specificity of these tools is critical for efficient analysis. The following data, presented in the context of a broader thesis on handling VUS, provides a performance benchmark to guide platform selection and troubleshoot common experimental challenges.
Performance at a Glance: Variant Prioritization and Classification
The table below summarizes the key performance metrics for automated variant prioritization (the ability to rank the true causal variant highly) and classification (the accuracy of assigning the correct ACMG pathogenicity class) [83].
Table 1: Benchmarking Platform Performance on 24 Known Pathogenic/Likely Pathogenic Variants
| Platform | Top 1 Ranked | Top 5 Ranked | Not Prioritized (NP) / Not Detected (ND) | Concordance with Reference Classification |
|---|---|---|---|---|
| SeqOne | 19 | 4 | 0 | Data Not Specified |
| CentoCloud | Data Not Specified | Data Not Specified | 0 | Data Not Specified |
| Franklin | Data Not Specified | Data Not Specified | 0 | 75% |
| eVai | Data Not Specified | Data Not Specified | 0 | Data Not Specified |
| Emedgene | 22 (in Top 10) | - | 1 NP, 1 ND | Data Not Specified |
| Varsome Clinical | 14 | 6 | 4 NP | 67% |
| QCI Interpret | Data Not Specified | Data Not Specified | 6 NP, 1 ND | 63% |
- Key Finding for VUS Workflows: Platforms that fail to prioritize or detect causal variants (NP/ND events) can inadvertently create false VUS scenarios by overlooking the true causative variant, thereby complicating the analysis. SeqOne, CentoCloud, and Franklin demonstrated the highest reliability by prioritizing all 24 variants [83].
Detailed Experimental Protocols
Understanding the methodology behind this benchmark is essential for evaluating its applicability to your research.
Sample and Variant Selection
A retrospective WES study was performed on 20 patients with a broad variety of deleterious variants and inheritance patterns. A total of 24 genetic variants previously established as the phenotypic cause were selected for the benchmark, comprising [83]:
- 12 Single Nucleotide Variants (SNVs): 5 missense, 4 nonsense, 2 canonical splice-site, 1 silent.
- 6 Small Indels: 5 frameshift deletions, 1 frameshift duplication.
- 6 Copy Number Variations (CNVs): Deletions and duplications ranging from 1.9 kb to 9.4 Mb, with mostly autosomal dominant inheritance.
Platform Evaluation Workflow
The following diagram illustrates the standardized process used to evaluate each platform.
Performance Metrics and Analysis
- Prioritization Performance: For each of the 24 variants, its rank position on each platform's output list was recorded. Success was categorized as Top 1, Top 5, Top 10, or Top 15. "Not Prioritized" (NP) meant the variant was ranked beyond position 16, and "Not Detected" (ND) meant it was absent from the list entirely. NP and ND were considered selection failures [83].
- Classification Performance: The automated ACMG classification (Pathogenic, Likely Pathogenic, etc.) from each platform was compared to a reference standard established by clinical genetics experts. Discordances were noted, with particular attention to those with clinical implications (e.g., a pathogenic variant classified as Benign) [83].
The Scientist's Toolkit: Research Reagent Solutions
Table 2: Essential Components for an Automated Variant Interpretation Workflow
| Item | Function in the Experiment |
|---|---|
| Whole Exome Sequencing (WES) Data | The primary input; generates sequencing data for the ~20,000 coding genes, containing an average of 100,000 variants per sample to be filtered and interpreted [83] [18]. |
| Human Phenotype Ontology (HPO) Terms | Standardized terms used to input patient phenotypes into the platforms, enabling phenotype-driven gene and variant prioritization [83]. |
| ACMG/AMP/ClinGen Guidelines | The international standard for classifying sequence variants into categories like "Pathogenic," "VUS," and "Benign," providing the rule set for automated classification [83] [65]. |
| Reference Variant Set | A set of variants with known, expert-curated classifications (the 24 variants in this study) essential for validating and benchmarking platform performance [83]. |
Frequently Asked Questions (FAQs)
Q1: A platform failed to prioritize a known pathogenic variant in our data. What could be the cause? This is a known limitation that varies by platform. Based on the benchmark:
- CNV Challenges: Some platforms, like Varsome Clinical, struggled specifically with CNVs, accounting for 3 of its 4 non-prioritized variants [83].
- Algorithm Limitations: Platforms like QCI Interpret and Emedgene had instances of non-prioritization or non-detection of SNVs, suggesting potential gaps in their AI models or underlying databases [83].
- Troubleshooting Step: If a variant is missed, confirm the platform's proven capabilities with your variant type (SNV, Indel, CNV). Manually inspecting the raw data or using an orthogonal platform for confirmation may be necessary.
Q2: How reliable is the automated ACMG classification from these platforms? Automated classification is improving but requires expert review. In the study:
- Highest Concordance: Franklin showed the highest agreement (75%) with the reference classification [83].
- Potential for Discordance: Automated classifications can be incorrect. The study noted that some platforms produced classifications discordant with the reference that had direct clinical implications, meaning a pathogenic variant was classified as benign or uncertain [83].
- Best Practice: Treat automated classifications as a powerful initial filter. The final classification should always be confirmed by a board-certified clinical molecular geneticist or equivalent, in accordance with best practices [65].
Q3: Our research focuses on a specific disease. How can I ensure the platform performs well for our genes of interest? The benchmark highlights that performance is not uniform across all genes or variant types.
- Investigate Specialization: Some platforms may leverage specialized, proprietary databases or algorithms for certain disease areas.
- Pilot Testing: For critical projects, run a small pilot dataset with known causal variants in your genes of interest against the platform's output. This provides a direct measure of its sensitivity and specificity for your specific research context.
Q4: Within the context of handling VUS, how can these platforms help? These AI-driven platforms are key to breaking the VUS interpretation bottleneck.
- Efficient Prioritization: They can rapidly sift through hundreds of VUS to identify those most likely to be pathogenic based on the patient's specific phenotype (using HPO terms), computational predictions, and segregation data [83] [84].
- Standardization: They apply the ACMG guidelines consistently to every variant, reducing manual labor and subjective bias in the initial assessment of VUS [85].
Conclusion
Effectively navigating VUS in WES is a dynamic and multi-faceted process crucial for advancing genomic medicine. A systematic approach that integrates robust bioinformatics, deep phenotypic information, and regular data reanalysis significantly improves diagnostic resolution. The future of VUS interpretation lies in the continuous expansion of population databases, the refinement of AI-driven prediction tools, and the functional characterization of variants in research models. For the drug development community, resolving VUS not only aids in patient diagnosis but also unlocks novel therapeutic targets by identifying disease-modifying genetic variants. Embracing collaborative frameworks and standardized guidelines will be paramount in translating VUS from points of uncertainty into actionable insights for patient care and innovative therapy development.
References
- 1. The challenge of genetic variants of uncertain clinical ... [https://pmc.ncbi.nlm.nih.gov/articles/PMC10555957/]
- 2. Variants of uncertain significance: At the crux of diagnostic ... [https://www.sciencedirect.com/science/article/abs/pii/S0378111925003762]
- 3. Selecting variants of unknown significance through ... [https://www.nature.com/articles/s41598-019-39796-w]
- 4. Unsolved challenges of clinical whole-exome sequencing [https://pmc.ncbi.nlm.nih.gov/articles/PMC4982236/]
- 5. Insights on improving accessibility and usability of ... [https://www.sciencedirect.com/science/article/pii/S0002929725001508]
- 6. The promises and pitfalls of automated variant interpretation [https://pmc.ncbi.nlm.nih.gov/articles/PMC12513165/]
- 7. Best practices for the interpretation and reporting of clinical ... [https://www.nature.com/articles/s41525-022-00295-z]
- 8. Editorial: Functional study of novel VUS (variant of ... [https://www.frontiersin.org/journals/genetics/articles/10.3389/fgene.2025.1578736/full]
- 9. VUS – The Most Maligned Result in Genetic Testing [https://www.blueprintgenetics.com/resources/vus-the-most-maligned-result-in-genetic-testing/]
- 10. Solving the Problem of Uncertain Significance - by Stetson [https://stetson.substack.com/p/solving-the-problem-of-uncertain]
- 11. Understanding variants of unknown significance and ... [https://pmc.ncbi.nlm.nih.gov/articles/PMC11299939/]
- 12. Prenatal Variants of Uncertain Significance (VUS): to report ... [https://pubmed.ncbi.nlm.nih.gov/40841822/]
- 13. Rare disease gene association discovery in the ... [https://www.nature.com/articles/s41586-025-08623-w]
- 14. Applying filtration steps to interpret the results of whole- ... [https://pmc.ncbi.nlm.nih.gov/articles/PMC6124828/]
- 15. ACMG Recommendations for Reporting of Incidental ... [https://pmc.ncbi.nlm.nih.gov/articles/PMC3727274/]
- 16. Criteria for reporting incidental findings in clinical exome ... [https://bmcmedgenomics.biomedcentral.com/articles/10.1186/s12920-019-0561-0]
- 17. Lessons learned from unsolicited findings in clinical exome ... [https://www.nature.com/articles/s41431-021-00964-0]
- 18. Whole exome sequencing (WES) guide for patients and ... [https://www.blueprintgenetics.com/whole-exome-sequencing-wes-guide-patients-families/]
- 19. Standard Mutation Nomenclature in Molecular Diagnostics [https://pmc.ncbi.nlm.nih.gov/articles/PMC1867422/]
- 20. Genetic testing found a variant of uncertain significance. ... [https://www.mdanderson.org/cancerwise/genetic-testing-found-a-variant-of-uncertain-significance--now-what.h00-159464001.html]
- 21. A Brief History and Bright Future of DNA Variant Interpretation [https://pubmed.ncbi.nlm.nih.gov/40660810/]
- 22. Distinct rates of VUS reclassification are observed when ... [https://pmc.ncbi.nlm.nih.gov/articles/PMC11601763/]
- 23. Systematic benchmark of state-of-the-art variant calling pipelines identifies major factors affecting accuracy of coding sequence variant discovery | BMC Genomics | Full Text [https://bmcgenomics.biomedcentral.com/articles/10.1186/s12864-022-08365-3]
- 24. Benchmarking of variant calling software for whole-exome ... [https://www.nature.com/articles/s41598-025-97047-7]
- 25. Best practices for variant calling in clinical sequencing | Genome Medicine | Full Text [https://genomemedicine.biomedcentral.com/articles/10.1186/s13073-020-00791-w]
- 26. Frontiers | Artificial intelligence in variant calling: a review [https://www.frontiersin.org/journals/bioinformatics/articles/10.3389/fbinf.2025.1574359/full]
- 27. Bioinformatics Pipeline Troubleshooting [https://www.meegle.com/en_us/topics/bioinformatics-pipeline/bioinformatics-pipeline-troubleshooting]
- 28. Building an End-to-End Variant Calling Pipeline (WES) [https://medium.com/@naila.srivastava/building-an-end-to-end-variant-calling-pipeline-wes-a-bioinformaticians-guide-42ddb308edba]
- 29. Overcoming Challenges in Variant Filtering and Prioritization [https://digitalinsights.qiagen.com/news/blog/clinical/challenges-in-variant-filtering/]
- 30. Variants of Uncertain Significance: Should We Revisit How ... [https://pmc.ncbi.nlm.nih.gov/articles/PMC5999032/]
- 31. The Human Phenotype Ontology: A Tool for Annotating and ... [https://pmc.ncbi.nlm.nih.gov/articles/PMC2668030/]
- 32. Semantic Similarity Analysis Reveals Robust Gene ... [https://www.sciencedirect.com/science/article/pii/S0002929720302718]
- 33. A new method to measure the semantic similarity from query ... [https://bmcbioinformatics.biomedcentral.com/articles/10.1186/s12859-018-2064-y]
- 34. Approaches to Evaluate Whole Exome Sequencing Data That ... [https://pmc.ncbi.nlm.nih.gov/articles/PMC11904091/]
- 35. A deep catalogue of protein-coding variation in ... [https://www.nature.com/articles/s41586-024-07556-0]
- 36. Genome sequencing provides high diagnostic yield and ... [https://pmc.ncbi.nlm.nih.gov/articles/PMC12381280/]
- 37. Combining genetic constraint with predictions of alternative ... [https://pmc.ncbi.nlm.nih.gov/articles/PMC9664736/]
- 38. SpliceAI Lookup [https://spliceailookup.broadinstitute.org/]
- 39. Plugins - Ensembl Variant Effect Predictor (VEP) [http://www.ensembl.org/info/docs/tools/vep/script/vep_plugins.html]
- 40. Improved genomic characterization of a clinically ... [https://www.nature.com/articles/s41598-025-21421-8]
- 41. About - DECIPHER v11.36 [https://www.deciphergenomics.org/about/news]
- 42. An optimized variant prioritization process for rare disease ... [https://pmc.ncbi.nlm.nih.gov/articles/PMC12539062/]
- 43. Efficient reinterpretation of rare disease cases using ... [https://www.nature.com/articles/s41525-024-00456-2]
- 44. An integrative scoring approach for prioritization of rare ... [https://www.nature.com/articles/s41598-025-96063-x]
- 45. Considerations for Variants of Uncertain Significance (VUS) [https://www.rarediseasegenes.com/variants-of-uncertain-significance/]
- 46. Personalised genomic strategies improve diagnostic yield ... [https://www.nature.com/articles/s41433-025-03981-1]
- 47. Unlocking the Mysteries of Rare Disease: Key Takeaways ... [https://www.baylorgenetics.com/blog/unlocking-the-mysteries-of-rare-disease-key-takeaways-from-four-studies-on-rare-disease-at-the-2025-acmg-annual-meeting/]
- 48. Options available for deciphering variants of unknown ... [https://www.healio.com/news/allergy-asthma/20250513/options-available-for-deciphering-variants-of-unknown-significance-in-genetic-testing]
- 49. Performance Evaluation of SpliceAI for the Prediction ... [https://pmc.ncbi.nlm.nih.gov/articles/PMC8472818/]
- 50. a free online tool to improve SpliceAI splicing variant ... [https://humgenomics.biomedcentral.com/articles/10.1186/s40246-023-00451-1]
- 51. NCAD v1.0: a database for non-coding variant annotation ... [https://www.sciencedirect.com/science/article/abs/pii/S1673852723002576]
- 52. An optimized variant prioritization process for rare disease ... [https://www.medrxiv.org/content/10.1101/2025.04.18.25326061v1]
- 53. Next generation sequencing misguided the clinical ... [https://pmc.ncbi.nlm.nih.gov/articles/PMC12375464/]
- 54. Limitations of Whole Exome Sequencing [https://3billion.io/blog/limitations-of-whole-exome-sequencing]
- 55. Benchmarking germline CNV calling tools from exome ... [https://www.nature.com/articles/s41598-021-93878-2]
- 56. comprehensive CNV detection and visualization from NGS ... [https://pmc.ncbi.nlm.nih.gov/articles/PMC8921749/]
- 57. Benchmarking of germline copy number variant callers ... [https://pmc.ncbi.nlm.nih.gov/articles/PMC12005901/]
- 58. Limitations of Whole Genome Sequencing in Genetic Testing [https://3billion.io/blog/limitation-of-whole-genome-sequencing]
- 59. Clinical and analytical validation of a combined RNA ... [https://www.nature.com/articles/s43856-025-00934-3]
- 60. Rapid, Reliable, and Interpretable Copy Number Variant ... [https://www.sciencedirect.com/science/article/abs/pii/S1525157825000443]
- 61. GATK4 CNV calling in Wheat WES data very sensitive to small ... [https://gatk.broadinstitute.org/hc/en-us/community/posts/360059910511-GATK4-CNV-calling-in-Wheat-WES-data-very-sensitive-to-small-changes-in-minimum-mappability-in-FilterIntervals]
- 62. An optimized variant prioritization process for rare disease ... [https://sciety.org/articles/activity/10.1101/2025.04.18.25326061]
- 63. Franklin's AI-based variant prioritization engine [https://help.genoox.com/en/articles/4444301-franklin-s-ai-based-variant-prioritization-engine]
- 64. Understanding ACMG Guidelines: Standards for Genetic ... [https://3billion.io/blog/what-are-the-acmg-standards-and-guidelines-and-how-do-they-work]
- 65. Standards and Guidelines for the Interpretation of Sequence ... [https://pmc.ncbi.nlm.nih.gov/articles/PMC4544753/]
- 66. A Practical Guide to Clinical Variant Interpretation [https://www.euformatics.com/blog-post/a-practical-guide-to-clinical-variant-interpretation]
- 67. Clinical exome sequencing—Mistakes and caveats - PMC [https://pmc.ncbi.nlm.nih.gov/articles/PMC9541396/]
- 68. Diagnostic implications of pitfalls in causal variant ... [https://www.nature.com/articles/s41467-023-40909-3]
- 69. RNA sequencing provides functional insights and ... [https://pmc.ncbi.nlm.nih.gov/articles/PMC12619422/]
- 70. The hitchhikers' guide to RNA sequencing and functional ... [https://pmc.ncbi.nlm.nih.gov/articles/PMC9851315/]
- 71. Recommendations for bioinformatics in clinical practice - PMC [https://pmc.ncbi.nlm.nih.gov/articles/PMC12535132/]
- 72. Understanding Validity in Animal Models for Drug Discovery [https://www.taconic.com/resources/validated-animal-models]
- 73. Utility and limitations of animal models for the functional ... [https://pmc.ncbi.nlm.nih.gov/articles/PMC4585444/]
- 74. A Comprehensive Guide to Validating Bioinformatics ... [https://arxiv.org/html/2502.03478v1]
- 75. High burden of variants of uncertain significance in early ... [https://pmc.ncbi.nlm.nih.gov/articles/PMC12238126/]
- 76. Exploring penetrance of clinically relevant variants in over ... [https://pmc.ncbi.nlm.nih.gov/articles/PMC12579199/]
- 77. Systematic assessment of structural variant annotation ... [https://www.life-science-alliance.org/content/8/3/e202402949]
- 78. Functional Testing of Human Disease Missense Variants in ... [https://www.sciencedirect.com/science/article/pii/S2468024925004759]
- 79. Structural Variants: Mechanisms, Mapping, and Interpretation ... [https://pmc.ncbi.nlm.nih.gov/articles/PMC12385565/]
- 80. Complex de novo structural variants are an underestimated ... [https://www.nature.com/articles/s41467-025-64722-2]
- 81. Copy Number Variants of Uncertain Significance by ... [https://www.mdpi.com/2073-4425/16/8/874]
- 82. Variant Reevaluation Service [https://www.blueprintgenetics.com/variant-re-evaluation-service/]
- 83. Evaluating seven bioinformatics platforms for tertiary ... [https://pmc.ncbi.nlm.nih.gov/articles/PMC11949535/]
- 84. Variant interpretation software | EVIDENCE [https://3billion.io/variant-interpretation]
- 85. Emedgene software | Germline variant interpretation [https://www.illumina.com/products/by-type/informatics-products/emedgene.html]